Troubleshooting IDP
show idp application status and its sub-commands provide information about the running state of the IDP engine.
admin@node.idp # show idp application status
Thu 2022-05-19 04:45:49 UTC
✔ Retrieving IDP application status...

======================
 node.idp
======================
 Engine:     on
 Last:       starting

 Pod:        active
 Docker:     running
FIPS Mode and IDP
IDP is not currently compatible with systems running in FIPS 140-3 mode, including Common Criteria or JITC deployments.
SSR400 and SSR440 devices are FIPS 140-3 compliant from the factory; FIPS mode is enabled by default.
Beginning with SSR software version 7.0 (including 7.1), FIPS mode is also enabled by default on every other SSR install type (SSR1x0/1x00 devices, software installations, VMs, and Whitebox installations). On releases prior to 7.0, FIPS was disabled by default on those install types.
If FIPS mode is enabled on the target system and you need to enable IDP, FIPS mode must be disabled on that system first. The disable procedure is the same as for any other feature that requires non-FIPS-compliant algorithms — see FIPS Default Behavior In 7.0 / 7.1 and Impact on Non-FIPS Algorithms on the conductor install page, or use the steps below.
--set-fips 0disables FIPS mode.--set-fips 1enables FIPS mode.
Open a linux shell on the SSR and execute the following command as a root user:
/usr/libexec/unpacker.sh --set-fips 0
[root@localhost t128]# /usr/libexec/unpacker.sh --set-fips 0
Setting FIPS mode to 0
[root@localhost t128]# reboot
Log back into the linux shell after the reboot and run the following to verify the change:
[root@localhost ~]# cat /proc/sys/crypto/fips_enabled
0
IDP Start-up
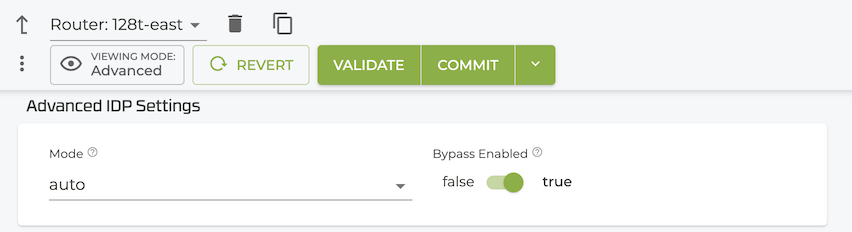
Beginning with SSR version 6.1.4-R2, traffic destined for IDP will temporarily bypass the IDP engine until it completes the startup process. This will take place at initial start up of the device, upgrade, or restart. An alarm is triggered on the device to indicate this is taking place, and is visible using the show idp events command. Once the IDP engine is fully booted, traffic is appropriately routed through IDP. Earlier versions routed traffic to the IDP engine before it was fully engaged, resulting in the loss of traffic. With bypass-enabled set to true (this is the default) traffic temporarily bypasses the IDP.
Additionally, services configured for IDP and their status (passing through IDP or not, and why), and when the IDP will be operational are reported in the show idp application status command.
Show Commands
Each of the commands listed below, and the subcommands for each, provide additional details for IDP visibility. Use the links to learn more about each command.
| command | description |
|---|---|
request idp signature-query | Request IDP signature database connectivity. |
show idp application details | Show IDP engine details. |
show idp application status | Show IDP application status. |
show idp details | Show IDP details. |
show idp events | Show all IDP events. |
show idp events by-application | Show IDP events by application. |
show idp events by-attack | Show IDP events by attack type. |
show idp events by-severity | Show IDP events by severity level. |
show idp network | Show IDP networks. |
show idp platform | Show IDP platform data. |
show idp signatures | Show IDP signature package details. |
show stats idp | Metrics about IDP. |
Additional Commands
The following commands are visible only in the Advanced view, and should only be run when instructed to do so by Juniper technical support.
| command | description |
|---|---|
request idp restart | Restart IDP Command. |
Stats
The show stats idp display metrics for attacks, bytes received and transmitted, and packets dropped, processed, received, and transmitted, as well as by individual protocol.
Logs
The save tech-support info contains the relevant logs and journals associated with the IDP engine. A log category of IDP is available to increase the level of IDP info logged. IDP function logs are stored here: /var/log/128technology/idp/*.