ON THIS PAGE
Asset Insights
Get visibility into all the BLE-tagged assets (named assets) and their utilization in your organization.
The Asset Insights dashboard provides end-to-end visibility into all Bluetooth Low Energy (BLE)-tagged assets (named assets) in your organization.This dashboard transforms data from periodic asset detection into valuable insights to support better planning and operational decisions. Asset detection data includes information about location, status, and usage. You can use this data to identify underutilized or missing assets, optimize asset utilization, and improve overall efficiency.
The dashboard provides a comprehensive view of the assets in your organization. You can track the movement patterns of assets across multiple zones and sites. This visibility helps optimize operations and implement audits and security measures.
Features
-
Provides details about the BLE-tagged (named) assets in your organization.
-
Provides insights into the distribution of BLE-tagged (named) assets across sites.
-
Identifies inactive or unresponsive BLE-tagged (named) assets.
-
Tracks historic journey and movement of BLE-tagged (named) assets across zones.
Subscription Requirements for Asset Insights
You’ll need an Asset Visibility (SUB-AST) subscription to view and use the Asset Insights dashboard. For information about subscriptions, see Subscription Types for Juniper Mist.
Before You Begin
-
Refer to the Juniper Mist Location Services Guide for information about how to set up your sites and floor plans for location services.
- Refer to Asset Visibility and Room Occupancy for information about Asset Visibility.
-
Refer to Mist Premium Analytics Trial License to know about license requirements for Juniper Mist™ Premium Analytics.
- Become familiar with the options available on the Juniper Mist Premium Analytics dashboards. See Figure 3.
Asset Insights Dashboard
Asset Insights Tiles
The Asset Insights dashboard includes various tiles that provide graphical representations of analytics at a granular level.
- Assets by Status
- Assets by Site
- Tag Types by Manufacturer
- Asset Inventory
- Asset Journey Insights
- Asset Journey Map
Assets by Status
The tile displays the percentage of assets grouped by status. You can select days and a month by using the filter options at the top of the tile.
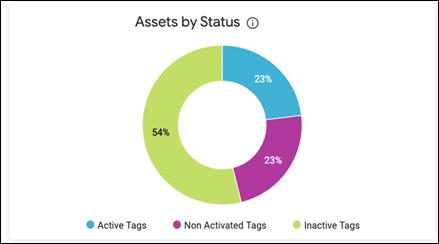
-
Active Tags—Assets that were detected within the last 3 days.
-
Non Activated Tags—Assets that are added to the Juniper Mist portal but are not yet detected by the network.
-
Inactive Tags—Assets that were not detected within the last 3 days (that is, the assets were detected more than 3 days ago).
When you hover over the chart, you see a pop-up message with the actual number of assets at the given time. To view more details about the assets, you can scroll down and see the Inventory table.
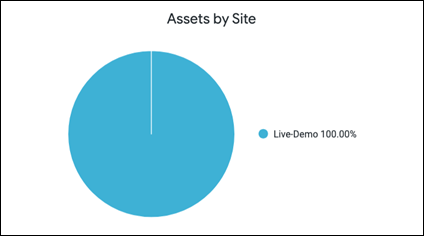
Assets by Site
The tile displays the distribution of assets across the sites in your organization.
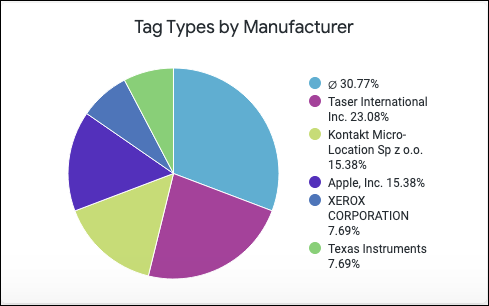
Tag Types by Manufacturer
The tile shows a distribution of assets based on the tag manufacturer.
Asset Inventory
The Asset Inventory table provides a listing of all the assets along with details such as asset name, MAC address, tag manufacturer, site, date when an asset was last detected, and asset status.
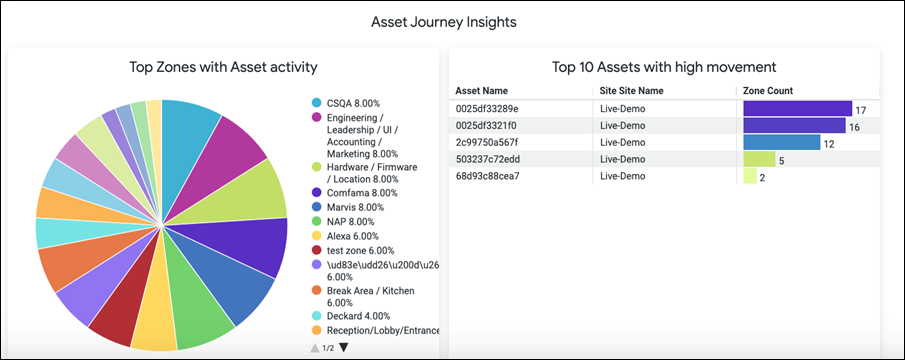
Asset Journey Insights
The tile focuses on asset behavior and historical movement. In addition to displaying the sites and zones in which an asset was active, the tile also highlights the assets that moved frequently. In the following example, you can see that the first asset was active in 20 zones. If you click the Zone Count value, you’ll see the details of all the zones.
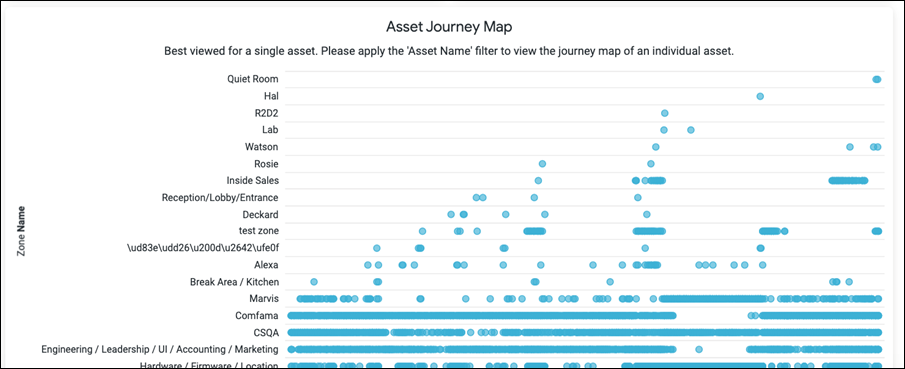
Asset Journey Map
The tile provides a visual map that you can use to investigate the journey of an asset for a given timeframe. You can see each instance of asset location for a 15-minute window within the given timeframe. Use this data to understand utilization trends, review workflows, or trace asset movement paths during audits or recovery efforts.