Understanding Junos Telemetry
Junos Telemetry is a framework developed by Juniper Networks that enables the export of operational data from Junos devices to external collectors. This data is analyzed for real-time device monitoring. This topic describes the concepts of model-driven telemetry, telemetry modes, transport protocols, telemetry sensors, sensor paths, and data models used by Junos Telemetry.
Network Telemetry
Network telemetry is the process of collecting, transmitting, and analyzing data from network devices. This data can include information about traffic patterns, device status, error rates, and other metrics that provide insights into the health and behavior of the network. Using this data, you can draw useful insights and apply this information to monitor and manage network performance and security effectively. Network administrators can use telemetry data to troubleshoot network issues, detect anomalies, and optimize resource utilization across the network. One of the key benefits of network telemetry is its ability to provide real-time visibility into network operations.
Network telemetry also plays a crucial role in enhancing network security. By analyzing telemetry data, security teams can identify unusual patterns that may indicate a cyber-attack or other security threats, thus enabling faster detection and response to potential security incidents and helping to protect the network and its data.
Junos Telemetry
Junos Telemetry is Juniper's telemetry solution, developed to stream telemetry data. It is highly scalable and can support monitoring devices remotely in a network. It also helps improve troubleshooting, proactively manage the network, and reduce operational costs.
Junos Telemetry can be applied in a variety of network scenarios:
- Performance monitoring: Monitor key metrics like interface utilization, latency, and packet loss to ensure optimal network performance.
- Security monitoring: Track security events, analyze traffic patterns, and identify potential security threats.
- Application performance management: Gain insights into application performance by correlating network data with application data.
- Network capacity planning: Analyze historical and real-time data to identify potential bottlenecks and plan for future capacity needs.
Other Juniper applications also utilize Junos Telemetry to provide real-time data, supporting operational state synchronization between network elements and an external controller, such as Juniper's Mist, Juniper's Routing Director, and Apstra.
Model-Driven Telemetry
Junos Telemetry has adopted a Model Driven Telemetry (MDT) architecture. A model-driven network telemetry system is an advanced approach to network monitoring that leverages data models to define and collect telemetry data from network devices. In this system, data models are defined using a YANG (Yet Another Next Generation) language to specify the structure and types of data to be collected or streamed.
Juniper currently supports the following different data models:
-
Juniper Native data model
-
OpenConfig data model
-
Genstate model
All models use YANG to specify the data structure and data types to be streamed, for more information, see Data Models.
Choosing the right data model depends on the specific needs. You can subscribe to sensors from any model simultaneously. Native sensors have an edge in supporting varied use cases.
Follow the steps below to set up a model-driven telemetry solution:
Set up the Juniper device to stream telemetry data: Ensure that the Juniper device runs a compatible Junos OS version that supports Junos Telemetry and the network connectivity between the Juniper device and the collector is present.
- Set up the data collector: Configure the collector to collect and decode the data. For more information, see Telemetry Data Collector.
- Establish the transport protocols: Choose and configure the appropriate transport protocols for data transmission. For more information, see Transport Protocols.
- Configure the sensor: A sensor profile defines the parameters of the system resource to be monitored and streamed. You can enable only one system resource to monitor each sensor profile or configure a different sensor profile for each system resource. You can, however, configure more than one sensor to monitor the same system resource. For more information, see Sensors and Sensor Paths.
- Create subscriptions: Set up subscriptions for the data streams you need to monitor. The telemetry session can be established in dial-in mode or dial-out mode, depending on whether the device or receiver is configured to initiate the subscription. For more information, see Telemetry Modes.
Sensors and Sensor Paths
Telemetry sensors are an important component of a telemetry solution. They measure various physical, environmental, and performance parameters and convert them into data that is transmitted over TCP or UDP connections to the collector for remote monitoring and analysis. Some examples are temperature sensors, interface sensors, flow sensors, and so on. A telemetry sensor path is a specific route within a data model, defined using YANG, that specifies the exact data to be collected and streamed from a network device. Juniper supports sensors from both Openconfig, native, and genstate models. Openconfig sensors track counter-based or state-based metrics and native sensors effectively track event-driven metrics as these sensors have access to in-depth device data. You can configure Openconfig-based sensors paths to retrieve sensor information in a vendor-neutral format or configure native sensor paths to retrieve Juniper proprietary information in a native format. For more information see, Explore Sensor Paths.
Telemetry Data Collector
The telemetry collector is a specialized tool or software that performs data collection, processing, transmission, and storage of telemetry data. It is an intermediary between the Junos devices generating telemetry data and the backend systems that store, analyse, and visualize it.
Functions of a data collector:
- Data Collection: The collector receives telemetry data from Juniper devices over gRPC or UDP connections.
- Data Processing: The collector processes the collected data by aggregating and normalizing it to filter out unnecessary information, aggregate metrics, and perform an initial analysis. This processing helps reduce the data volume and focus on the most critical metrics.
- Data Transmission: It ensures reliable data transmission and low latency.
- Data Storage: The processed data is then exported to various backend systems for further analysis, visualization, and storage. It can be stored in data lakes for long-term analysis and historical comparison. The collector supports multiple data formats and protocols, making it compatible with different monitoring and analytics tools. The analysed data can be presented through interactive dashboards and reports, providing actionable insights to network administrators.
Telemetry Modes
The Junos Telemetry supports telemetry sessions in two modes:
Juniper devices can operate in both dial-in and dial-out modes. You can configure the Juniper device in either mode based on your network's topology. Both modes use the same data models and stream the same telemetry data over the network. The difference between the two modes is based on whether the collector or Juniper device initiates and maintains the connection.
Subscription Types
Junos Telemetry supports various subscription modes, enabling tailored data collection based on specific needs and conditions. The subscription modes are configured on the device using CLI commands or are a part of the subscription request based on the telemetry type. These modes determine the behavior of the data stream. Streaming intervals determine the frequency of telemetry data transmission between the device and the collector. Data collection and streaming are triggered when certain conditions are met or events occur that initiate the collection and streaming of telemetry data. These triggers ensure that data is collected when specific criteria are met. For example, telemetry data can be collected and streamed when packet loss is detected. The following subscription modes are supported:
- Once: This is a one-time request for telemetry data. You can configure this subscription type when a snapshot of the current state of the subscribed data is required. The device sends the telemetry data once to the collector and stops.
- Poll: Is periodic on-demand retrieval of telemetry data. This configuration is suitable for monitoring sensors at specific intervals. In a dial-in scenario, the collector subscribes to telemetry data through this type of subscription and then polls information as needed.
- Stream: This ongoing subscription continuously streams data when configured triggers occur.
Note: Not all sensors (OpenConfig or native) support all types of subscription.
Subscription Modes
Junos telemetry supports the following subscription modes:
- ON_CHANGE: The device sends updates only when the monitored data changes (for example, an interface counter increments or a state flips). This mode is suitable for event-driven metrics rather than time-driven.
- SAMPLE: Telemetry updates are streamed at regular intervals based on the configured interval. This mode is suitable for metrics like packet counts or bytes transferred, which are sampled over time.
- TARGET_DEFINED: The device decides the best mode (SAMPLE or ON_CHANGE)
based on the monitored sensor or resource. Juniper's implementation may default
to SAMPLE unless ON_CHANGE is explicitly supported for the sensor.
-
Note: The TARGET_DEFINED subscription requests for configuration paths are treated as ON_CHANGE requests only.
-
Determine the Appropriate Telemetry Configuration for your Network
Your network topology and data requirements determine the appropriate sensors, subscription type, and subscription mode. For example, use OpenConfig sensors with the SAMPLE subscription mode for standardized, periodic monitoring—such as supporting multivendor dashboards. For Juniper-specific or event-driven insights—such as hardware troubleshooting—use native sensors with the ON_CHANGE subscription mode.
Transport Protocols
Transport protocols define how telemetry data is transmitted between Junos devices and telemetry collectors.
The following protocols are supported:
-
Transmission Control Protocol (TCP)
-
User Datagram Protocol (UDP)
TCP
TCP is the primary protocol supported by Junos Telemetry. TCP is connection-oriented, stateful, and secure (TLS support), making it reliable for data delivery. TCP is supported in dial-in and dial-out telemetry modes. It forms the foundation layer for telemetry mechanisms such as pre-gNMI (Juniper proprietary) and gNMI.
| Dial-In | Dial-Out | |
|---|---|---|
| Transport | TCP | TCP |
| Session | HTTP/2 | HTTP/2 |
| RPC Framework | gRPC | gRPC |
| Telemetry API | gNMI | gNMI |
| Data Models |
|
|
To configure telemetry and decode telemetry messages, see , gNMI Subscription, Configure gRPC Services, Supported Data Types, Juniper GitHub repository, and Protobuf Compact Message Format (Juniper proprietary).
UDP
UDP is a lightweight connectionless transport protocol supported by Junos Telemetry. UDP is supported in dial-out telemetry mode.
| Dial-In | Dial-Out | |
|---|---|---|
| Transport | - | UDP |
| Session | - | - |
| RPC Framework | - | gRPC |
| Telemetry API | - | - |
| Data Models | - |
|
In UDP telemetry the proto files are required to decode the telemetry message structure. To configure and decode telemetry messages, see Streaming Telemetry Data Over UDP, Sensor Data Encapsulation Format, Supported Data Types, Juniper GitHub repository, and Protobuf Compact Message Format (Juniper proprietary).
Data Models
The Junos Telemetry data models define the structure of telemetry data collected from network devices, using YANG (Yet Another Next Generation). YANG is a standards-based, extensible data modeling language used in Junos Telemetry to define configuration, operational state data, and remote procedure calls (RPCs) for network devices. In Junos Telemetry, YANG models express the structure and details of data models which contain the sensors such as interface statistics.The YANG standard is defined in RFC 6020 and RFC 7950.
Juniper Networks publishes YANG modules for Junos devices, which can be downloaded from the Juniper GitHub repository. From release 23.4 onwards configuration and telemetry YANG models are merged and published in the Juniper GitHub repository. This contains YANG definitions for configuration, RPCs and telemetry models.
The OpenConfig working group defines the OpenConfig data model. It is a vendor-neutral data model to configure and manage the network. OpenConfig data model generates data as Google Protocol Buffers (GPB) messages in a universal key/value format. Junos Telemetry allows you to leverage OpenConfig models for a broader, vendor-agnostic view of your network. Openconfig sensor paths are used to retrive sensor information from sensors based on the Openconfig data model. For detailed Openconfig resource path exploration, see Junos YANG Data Model Explorer.
The Juniper native data model is an open and extensible framework developed by Juniper. This model is used to stream telemetry data about the unique features found on Juniper devices. These include interface statistics, routing information, security metrics, and so on. Additionally, the native model allows for the definition of enterprise-specific sensors. To access information from Juniper or enterprise-specific sensors, subscribe to Juniper native sensors. Native sensor paths are used to retrive sensor information from sensors based on the native data model. Juniper’s YANG modules for native sensors are available at Juniper's YANG repository on GitHub.
Genstate models are autogenerated YANG models derived from operational state data. The genstate YANG models expose a subset of show command data through the gNMI subscribe RPC. A gNMI telemetry collector can subscribe to the resource paths defined in the published models to obtain specific state data. To configure gNMI subscription, see gNMI Subscription. The collectors consume genstate models to issue resource path queries to retrieve specific operational state data. Each root tag corresponds to a single genstate model (that is, one YANG file per root tag).
Explore Sensor Paths
A telemetry sensor path describes the hierarchical path to the data points or metrics that need to be monitored. It is used to identify, activate, and stream the relevant data. Junos Telemetry supports Openconfig, Genstate and native sensor paths:
-
Openconfig Sensor Paths
To configure data collection from Openconfig sensors, define the subscriptions and sensor paths (for example,
/interfaces/interface/state/counters), set up the data collector, and download the Junos Telemetry protocol buffers files from the Juniper Networks support page. Capture and decode the captured data on the collector. -
Native Sensor Paths
Native sensor paths are specific to Junos OS (for example,
/junos/system/line card/interface/) and offer granular, Juniper-optimized access to device-specific metrics.The subscription modes are configured on the device using CLI commands or are a part of the subscription request based on the telemetry type. Use the protocol buffer's files to decode the sensor data on the collector.
-
Genstate Sensor Paths
Genstate resource paths are used to retrieve state data exposed through genstate YANG data models from a network device. The genstate YANG models expose a subset of show command data through the gNMI subscribe RPC. The genstate model resource paths are appended with
/genstate/. For example, the collector sends the following query to retrieve the mpls lsp name:genstate:/genstate/mpls-lsp-information/rsvp-session-data/rsvp-session/mpls-lsp/nameNote:For more information about the genstate YANG modules and how to discover the corresponding module and available resource paths for a given show command, see Junos Genstate YANG Data Models.
See Genstate YANG Data Models to view the supported show commands and the root paths.
All path types enable the structured output of data in formats such as JSON or XML, ensuring compatibility with external collectors for efficient monitoring and analytics.
- Sensor Path Explorer
- Selecting Telemetry Sensor Paths
- Important Guidelines and Naming Conventions for Sensor Paths
- Sensor Path Example
Sensor Path Explorer
The Juniper Networks Junos YANG Data Model Explorer is an online tool for viewing all the supported resource paths, their corresponding leaves, and the device platforms that support them. It enables you to explore or compare various data model attributes. Use the filter option based on the software release number or product to view the list of resource paths and sensors on each platform.
Selecting Telemetry Sensor Paths
In a model-driven telemetry system, the sensor path can be configured to end at any level within the data model's container hierarchy. Based on the required telemetry information, you can configure the sensor path to retrieve a broad data set or be very specific and retrieve targeted information for a particular sensor. For example, a sensor path might point to a container that includes all interface statistics on a router, or it could be more granular, focusing on a single metric like packet loss on a specific interface.
For example, to receive telemetry data about alarms generated on the device (using the OpenConfig data model), you can configure either of the following resource paths based on the granularity of sensor data required:
/system/alarms/alarm/id: This path retrieves only the alarm ID./system/alarms/alarm/config: This path retrieves the detailed alarm information.
Configuring the correct sensor paths ensures an efficient telemetry system. Each
resource path enables data streaming for the system resource globally, that is,
systemwide. You can modify each resource path to specify a logical or physical
interface. The resource path "/interfaces/interface/config"
retrieves the list of configurable items at the global, physical interface
level, whereas the path "/interfaces/interface/config/name"
specifies the name of the interface, and the device may restrict the allowed
values for this leaf depending on the type of the interface.
Important Guidelines and Naming Conventions for Sensor Paths
In most cases, you should provide the complete and direct resource path when
configuring sensors. Providing partial resource paths, such
as "/components/component/", can result in incomplete
configurations and potential errors. Such resource paths can impose a
significant load on the device, as it must retrieve and display all available
options within that hierarchy.To prevent this, always verify and use the full
resource path to ensure precise and efficient sensor configuration.
Use the hierarchical component naming convention for system components.. This
convention allows for precise component identification, using a full path
starting from the root node, such as CHASSIS0:REx for Routing
Engines and CHASSIS0:FPCx:PICy:NPUz for Network Processing
Units (NPUs).
The following table includes examples of how component names have changed:
|
Component Category |
Old Name |
New Name |
|---|---|---|
|
Chassis |
|
|
|
Control Board (CB) |
|
|
|
Fan Tray |
Fan Tray, Fan Tray 0 |
|
|
Fan |
Fan Tray 0 Fan 0 |
|
|
FPC |
|
|
|
RE CPU |
|
|
|
FPC CPU (logical) |
|
|
|
FPC CPU (core) |
|
|
|
PIC |
|
|
|
CC |
|
|
|
NPU |
|
|
|
DP |
|
|
|
Port |
|
|
|
XCVR |
|
|
|
OCH |
|
|
|
Lane |
|
|
|
FPM |
|
|
|
MIDPLANE |
|
|
|
PSM |
|
|
|
Routing Engine (RE) |
|
|
|
FTC |
|
|
|
SIB |
|
|
|
RE Bootloader |
|
|
|
RE BIOS |
|
|
|
FEB |
|
|
A full path example for fpc for instance is
/components/component[name="CHASSIS0:FPC0"]/state/parent :
                    CHASSIS0
.
For more information on component naming conventions, see, Interface Naming
Sensor Path Example
| Complete Sensor Path | Partial Sensor Path |
|---|---|
/interfaces/interface/subinterfaces/subinterface/state/counters/out-pkts |
/interfaces/interface |
/interfaces/interface/ producing
the streamed path /junos/system/linecard/interface/logical/
usage/ reports key name leaves parent_ae_name and
init_time (with underscores in the leaf name). The
subscribed path /interfaces/interface/state/ producing the
streamed path / junos/system/linecard/interface/queue/ reports
key name leaves parent-ae-name and init-time
(with hyphens in the leaf name).The performance of Junos Evolved devices is optimized through a service-based architecture, in which some processes or daemons are activated based on service configuration. These processes remain inactive until the service is configured. If a telemetry subscription targets an inactive service, no telemetry output will be generated.
Sensor Data Encapsulation Format
The Junos telemetry supports two ways of exporting data in the protocol buffers (gpb) format. This section describes the data format used by native sensors when exporting telemetry data over UDP. The data is encapsulated into a UDP header, which is further encapsulated in the IPv4 payload. This telemetry model follows a distributed architecture, where data generated by configured sensors is exported directly from the data plane. By bypassing the control plane, this approach helps conserve control plane resources for other critical functions.
A native sensor exports data close to the source using UDP. Various types of telemetry data, such as physical interface statistics, firewall filter counter statistics, or statistics for label-switched paths (LSPs) can be exported. A sensor starts to emit data as soon as it is enabled.
The sensor data is represented as a single structured protocol buffers message, named
TelemetryStream. The message, or .proto file,
shown below, includes several attributes that identify the data source, such as a
line card, a Packet Forwarding Engine, or a Routing Engine. The name of the
configured sensor is also included. For more information about how to configure
sensors, see Explore Sensor Paths.
For a a list of supported native sensors, see sensor (Junos Telemetry Interface).
You must also download the .proto files for all the sensors
supported to a streaming server or collector. To download OpenConfig and YANG model
files, open a web browser and navigate to https://www.hpe.com/us/en/networking/hpe-juniper-networking.html, then
click Support to open the Juniper Support portal at https://support.juniper.net/support/. Select the Downloads tab,
enter a product name in the Type a product name field, click
Find a product, search for and select the required
product, then choose the appropriate Junos OSand software
VERSION from the drop-down list. Scroll down on the same
page, expand the + Tools section, and download the required
files: JUNOS Telemetry Interface Data Model Files for
OpenConfig models and YANG Module for YANG files. For more
information about configuring a streaming-server, see streaming-server (Junos Telemetry Interface).
Protobuf Compact Message Format (Juniper Proprietary)
The information streamed to the collector is sent using the top-level message
structure of TelemetryStream (telemetry_top.proto file). The
message contains the metadata of the sensor data being streamed (for example, sensor
path, the system from where data is being sent, the node from where data is sent,
and so on). The actual sensor data is sent as an extension to the top-level message.
A separate proto file is sent for the sensor data. The telemetry_top.proto
file and the sensor proto file are used to decode the sensor data at the
collector.
Structure of telemetry_top.proto File
message TelemetryStream {
    required string system_id = 1
[(telemetry_options).is_key = true];
    optional uint32 component_id = 2
[(telemetry_options).is_key = true];
    optional string sensor_name = 4
[(telemetry_options).is_key = true];
    ….
    optional EnterpriseSensors enterprise = 101;
}
message EnterpriseSensors {
    extensions 1 to max;
}
extend EnterpriseSensors {
    // re-use IANA assigned numbers
    optional JuniperNetworksSensors juniperNetworks = 2636;
}
message JuniperNetworksSensors {
extensions 1 to max; → ends with the extension message

} This file ends with the extension message.
Structure of Sensor Proto File
This file begins with the extension message.
extend JuniperNetworksSensors { → begins with the extension message
    optional Port jnpr_interface_ext = 3;
}
message Port {
    repeated InterfaceInfos interface_stats = 1;
}
message InterfaceInfos {
    required string if_name = 1
[(telemetry_options).is_key = true];
    optional uint64 init_time = 2;
    …..
}
The TelemetryStream message also includes optional nested structures
that carry different types of data. The nested structures can also carry privately
defined sensor data such as EnterpriseSensors. See the example
below:
//
// This file defines the top level message used for all Juniper
// Telemetry packets encoded to the protocol buffer format.
// The top level message is TelemetryStream.
//

import "google/protobuf/descriptor.proto";

extend google.protobuf.FieldOptions {
    optional TelemetryFieldOptions telemetry_options = 1024;
}

message TelemetryFieldOptions {
    optional bool is_key             = 1;
    optional bool is_timestamp       = 2;
    optional bool is_counter         = 3;
    optional bool is_gauge           = 4;
}

message TelemetryStream {
    // router name or export IP address
    required string system_id        = 1 [(telemetry_options).is_key = true];

    // line card / RE (slot number)
    optional uint32 component_id     = 2 [(telemetry_options).is_key = true];

    // PFE (if applicable)
    optional uint32 sub_component_id = 3 [(telemetry_options).is_key = true];

    // configured sensor name
    optional string sensor_name      = 4 [(telemetry_options).is_key = true];

    // sequence number, monotonically increasesing for each
    // system_id, component_id, sub_component_id + sensor_name.
    optional uint32 sequence_number  = 5;

    // timestamp (milliseconds since 00:00:00 UTC 1/1/1970)
    optional uint64 timestamp        = 6 [(telemetry_options).is_timestamp = true];

    // major version
    optional uint32 version_major    = 7;

    // minor version
    optional uint32 version_minor    = 8;

    optional IETFSensors ietf        = 100;

    optional EnterpriseSensors enterprise = 101;
}

message IETFSensors {
    extensions 1 to max;
}

message EnterpriseSensors {
    extensions 1 to max;
}

extend EnterpriseSensors {
    // re-use IANA assigned numbers
    optional JuniperNetworksSensors juniperNetworks = 2636;
}

message JuniperNetworksSensors {
    extensions 1 to max;
}
Individual companies, such as Juniper Networks, define and maintain the attributes generated by enterprise sensors. Each company is assigned a unique attribute identifier. The current convention is to use IANA-assigned enterprise MIB identifiers for each attribute. For Juniper Networks, this assigned identifier is 2636.
Recommended: To verify that a particular message type has been exported
and received, check for those attributes under
TelemetryStream.enterprise.juniperNetworks in the gpb
message.
See Table 5 for descriptions of each element collected by sensor data, including semantics and corresponding schema.
|
Element Type |
Description |
|---|---|
|
Counter |
An unsigned integer that increases monotonically. When it reaches its maximum value, it starts back at zero. |
|
Gauge |
An unsigned 32-bit or 64-bit integer that can increase or decrease in value. An example of the data represented by this element is the instantaneous value of a specific resource, such as queue depth or temperature. |
|
Rate |
Rate at which a base metric changes, such as a counter or a gauge. For this element type, units of measurement are defined explicitly (such as bits per second), as well the interval over which the rate is collected. |
|
Average |
The average of several samples of a base metric. For example, an average queue depth data element would be calculated by averaging several elements of the queue depth. For this element type, we strongly recommend defining the number of measurements used to compute the average, as well as the time interval between the measurements. Otherwise, you should define explicitly the means by which this average value is calculated. |
|
Peak |
Maximum value among several samples of a base metric. For example, a peak queue depth element would be calculated by comparing several measurements of the queue depth and selecting the maximum. For this data element type, we strongly recommend that you define the number of measurements used to compute the peak value, as well as the time interval between measurements. Otherwise, define explicitly how this peak value is defined. You must also know whether this value is never cleared and thus represents the overall maximum value over all time. |
Each data element type also includes element subsets. For example, the data
elements Counter and Gauge would include
subsets for rate, average, and
peak measurements.
Supported Data Types
A GetRequest is sent when a collector client initiates a Get RPC to receive telemetry data. Specified within the GetRequest are the data elements with which the target should return data to the collector, including the data type. The data type is the variable that specifies the form in which data should be delivered.
Table 6 lists the data types supported by Junos telemetry . Unless specified, the data type is supported for Junos Telemetry data export using remote procedure call (gRPC) services, gRPC Network Management Interface (gNMI) services, or through UDP.
|
Type |
Value |
Description |
|---|---|---|
|
string |
|
String value. |
|
int64 |
|
Integer value. |
|
uint64 |
|
Unsigned integer value. |
|
bool |
|
Bool value. |
|
float |
|
Floating point value. Note:
This data type is deprecated. Use |
|
double |
|
A double value is a 64-bit floating point value. |
|
Decimal64 |
|
Decimal64 encoded value. Supported only with gNMI services. Use decimal64 to encode a fixed precision decimal number. The value is expressed as a set of digits with the precision specifying the number of digits following the decimal point in the digit set. For example: message Decimal64 {
int64 digits = 1; // Set of digits.
uint32 precision = 2; // Number of digits following the decimal point.
Note:
This data type is deprecated. Use |
|
ScalarArray |
|
Mixed type scalar array value. An homogenous array of the values of mixed datatypes (string, int64, uint64, bool float or decimal64). Supported only with gNMI services. |
| Type | Value | Description |
|---|---|---|
| ieeefloat32 | Binary, length = 4 |
An IEEE 32-bit floating point number. This is a Open Config model data type. The format of this number is of the form: 1-bit sign
8-bit exponent
23-bit fraction
The floating point value is calculated using:
(-1)**S * 2**(Exponent-127) * (1+Fraction)";
Note: The gNMI data type equivalent to binary
format is "byte." In a gNMI response, data was incorrectly
received from a device in float_val format, and a non-compliance
error was displayed. Changes have been incorporated to return
data in the bytes_val format. The four bytes (that represent a
floating-point value) are sent in network byte order. Ensure to
reorder them in host byte order before interpreting the
value.
|
For more information on data types, see github and http://www.openconfig.net/.
Performance Monitoring using Junos Telemetry
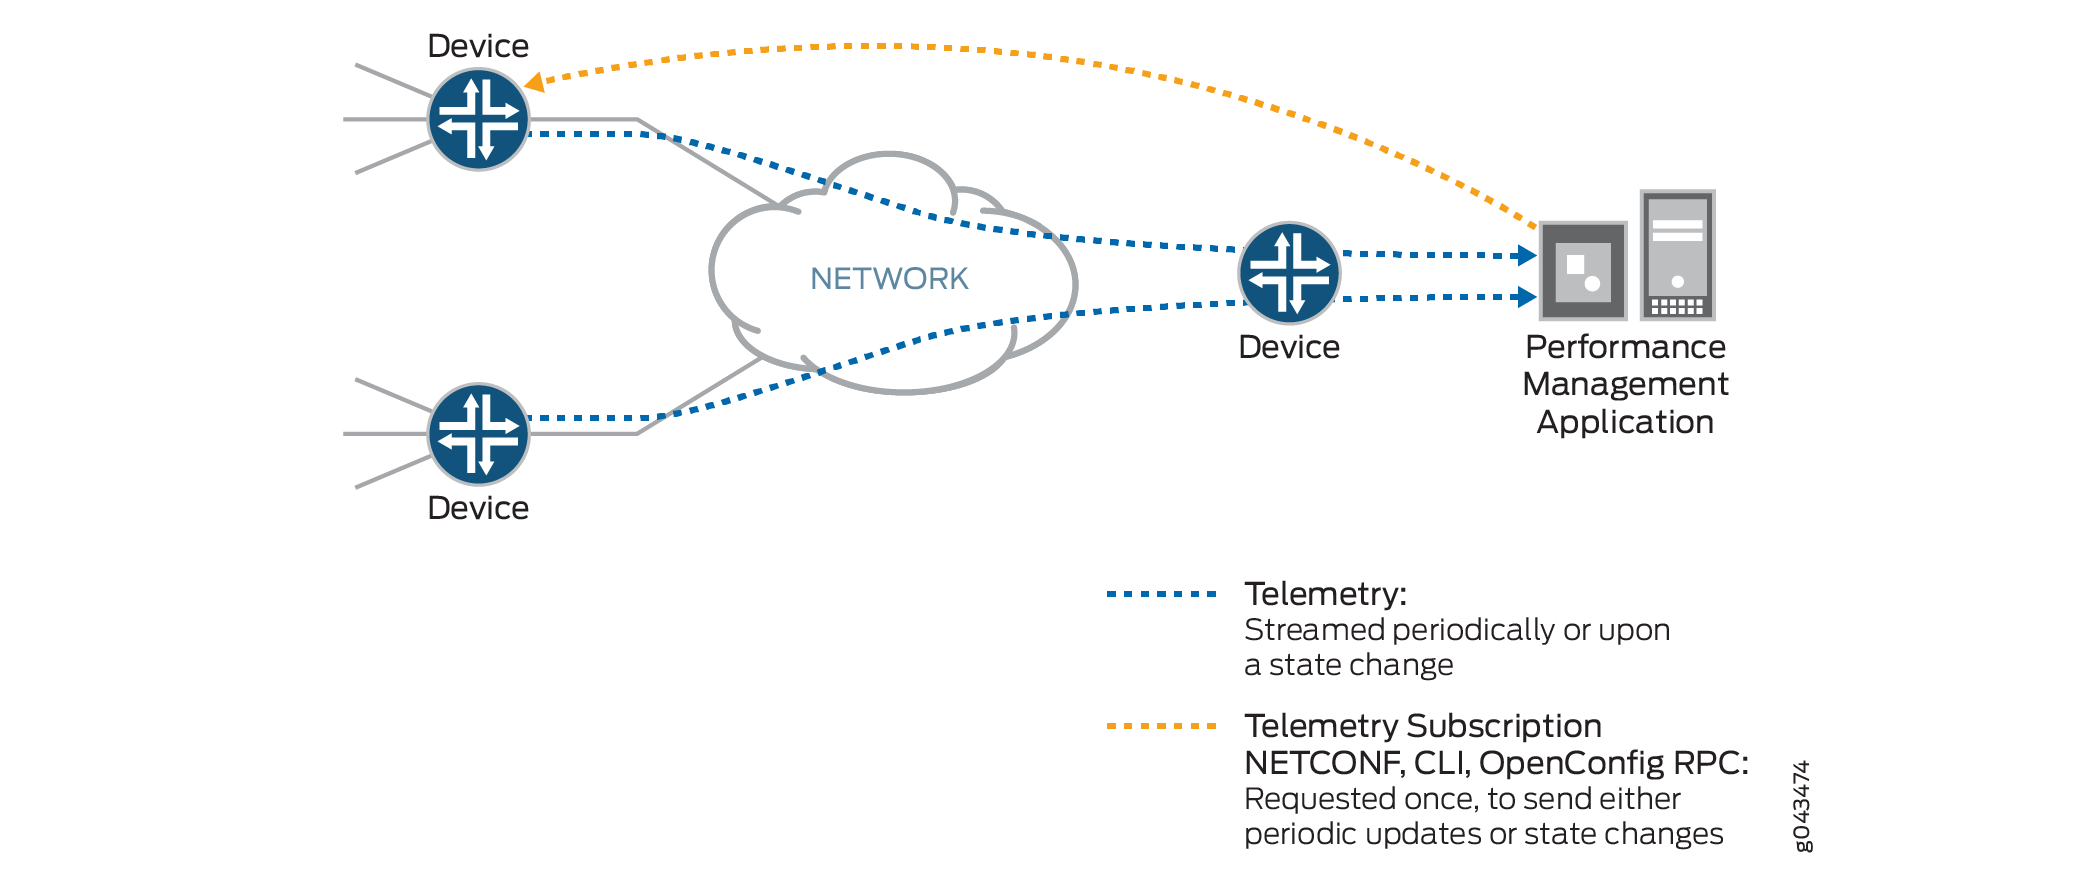
One primary function of the Junos Telemetry is performance monitoring. Streaming data to a performance management system enables network administrators to measure trends in link and node utilization, and troubleshoot issues such as network congestion in real time.
In a typical deployment, the network element, or device, streams duplicate data to two destination servers that function as performance management system collectors. Streaming data to two collectors provides redundancy. See Figure 1 for an illustration of how the performance management system collectors request data and how the device streams data. The device provisions sensors to collect and export data using command-line interface (CLI), configuration through NETCONF, or gRPC subscription calls. The collectors request data by initiating a telemetry subscription. Data is requested only once and is streamed periodically.
Other applications of the Junos Telemetry include providing real-time data to support operational state synchronization between a network element and an external controller, such as the Northstar Controller, which automates the creation of traffic-engineering paths across the network. The NorthStar Controller can subscribe to telemetry data about certain network elements, such as label-switched path (LSP) statistics.