Detect Blackholes
Use this topic to understand how Routing Director provides notifications about blackholes and information for root cause analysis of the blackhole events.
A traffic blackhole occurs when transit traffic is consistently or intermittently dropped. Blackholes are caused due to:
- Hardware errors (interface, fabric, queuing drop counters)
- Software issues
- Side effects of events such as BFD Session Flaps, Link flaps, Line card restart, GRES, NSR, Config Change
- Resource exhaustion
- Incorrect configuration
Juniper Routing Director detects blackholes and displays alerts when a blackhole is detected. To detect blackholes, blackhole detection must be enabled in Routing Director.
Use the following commands to configure blackhole detection in Routing Director:
For Routing Director to detect and display blackholes, the following commands must be configured in the Routing Director installation:
set paragon cluster applications aiops install-aiml true
set paragon cluster applications aiops enable-blackhole true
See Deploy the Cluster for details.
When you enable blackhole detection on Routing Director, playbook rules for collecting KPIs (packet drops, software errors, and hardware interrupts) to detect blackholes are applied to the devices.
Enabling AI/ML requires additional system resources (CPU and memory). For information about the additional resources required for AI/ML, see Hardware Requirements.
Routing Director uses AI/ML to detect blackholes on devices onboarded to Routing Director. When blackhole detection is enabled on Routing Director, sensors are initialized to capture input packet rates, output packet rates, and packet drop rates. When captured rates are compared to respective thresholds, blackhole is detected if the packet drop rate threshold is persistently breached.
View Blackhole Details
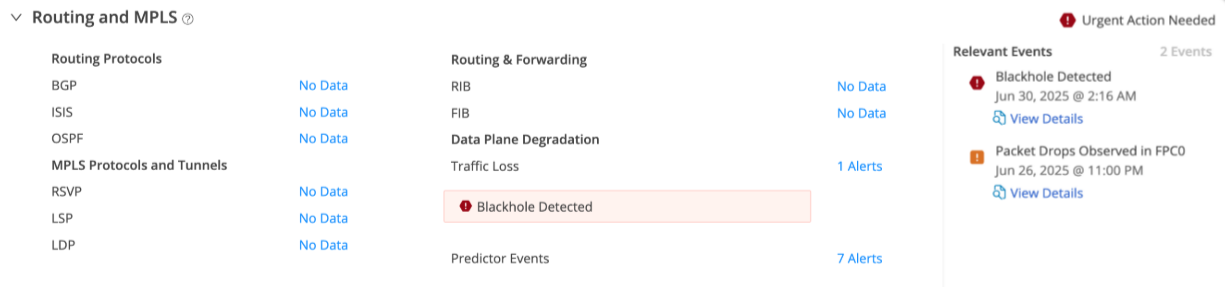
Routing Director identifies blackholes based on changes in the number of packets dropped over a period of time. If the number of packets dropped exceeds a specified threshold, Routing Director generates a critical alarm indicating blackhole. This information is displayed as Traffic Loss in the Alerts table (Observability > Events > Alerts tab) and the Routing and MPLS accordion of the Device-Name page. To access the Device-Name page, click Observability > Health > Troubleshoot Devices > Device-Name > Overview > Routing and MPLS accordion > click Traffic Loss Alert link.
Figure 1 displays the Blackhole Detected alert displayed on the Routing and MPLS accordion.
Click the Alerts link of the Traffic Loss field to view graphs of packet input rate, packet output rate, packet drop rate, and traffic loss alerts. Figure shows the Traffic Loss page with alerts indicated as follows:
-
A red alert icon (critical) indicates that blackhole is detected
-
An orange alert icon (major) indicates that packet drop anomalies are present but blackhole is not detected.
-
A normal small circle icon indicates that blackhole is not detected and packet drop anomalies are not present.
Clicking the red alert icon or orange alert icon in the graph filters the corresponding rows in the Alerts table.
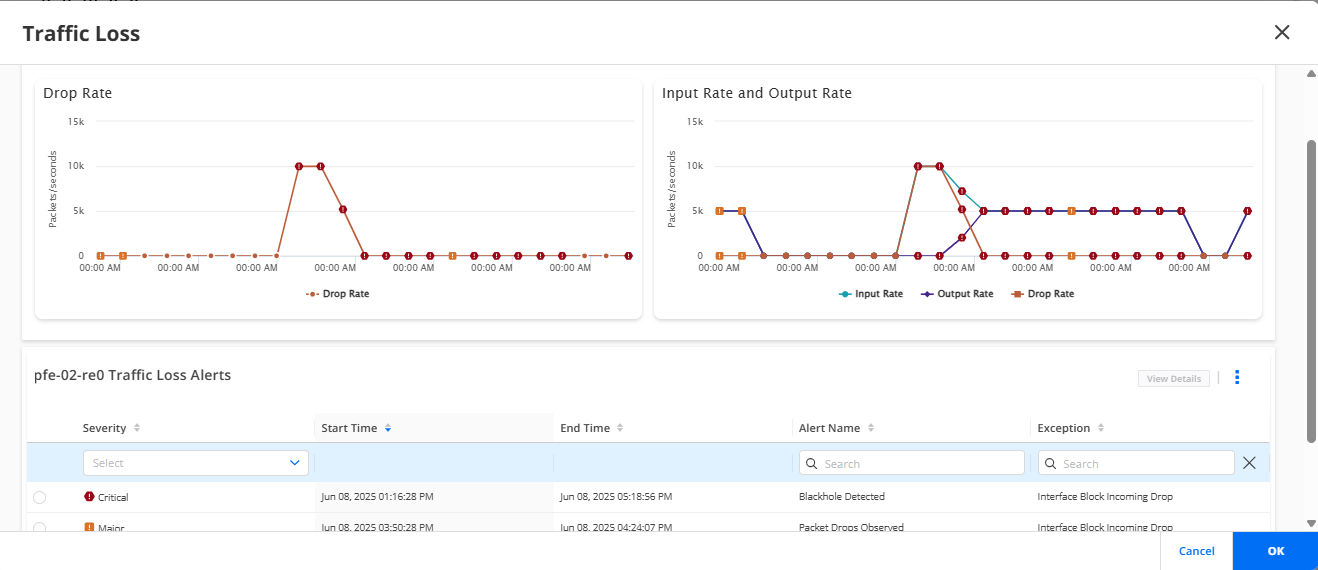
For more information on the Traffic Loss page, see Traffic Loss.