ON THIS PAGE
Traffic Loss and Predictor Events
This topic provides details about the Traffic Loss and Predictor Events alerts displayed on the Routing and MPLS accordion of the Device-Name page (Observability > Health > Troubleshoot Devices > click a Device-Name).
Traffic Loss
Traffic Loss is a beta feature in this release.
The Traffic Loss page displays details about the traffic loss that has occurred on the device. To access the Traffic Loss page, click Observability > Health > Troubleshoot Devices > Device-Name > Overview > Routing and MPLS accordion > click Traffic Loss Alert link.
Figure shows the Traffic Loss page. On the Traffic Loss page, you can see:
-
A graph showing packet drop rate.
-
A graph showing packet input rate, packet output rate, and packet drop rate.
Click a KPI to turn off the graph for that KPI. For example, clicking Input Rate turns off the graph of input packet rate.
-
An alerts table listing the alerts raised on the device. You can see the following alerts:
-
A red alert icon (critical) indicates that blackhole is detected
-
An orange alert icon (major) indicates that packet drop anomalies are present but blackhole is not detected.
-
A normal small circle icon indicates that blackhole is not detected and packet drop anomalies are not present.
Clicking an alert icon on the graph filters the corresponding alert in the Alerts table.
-
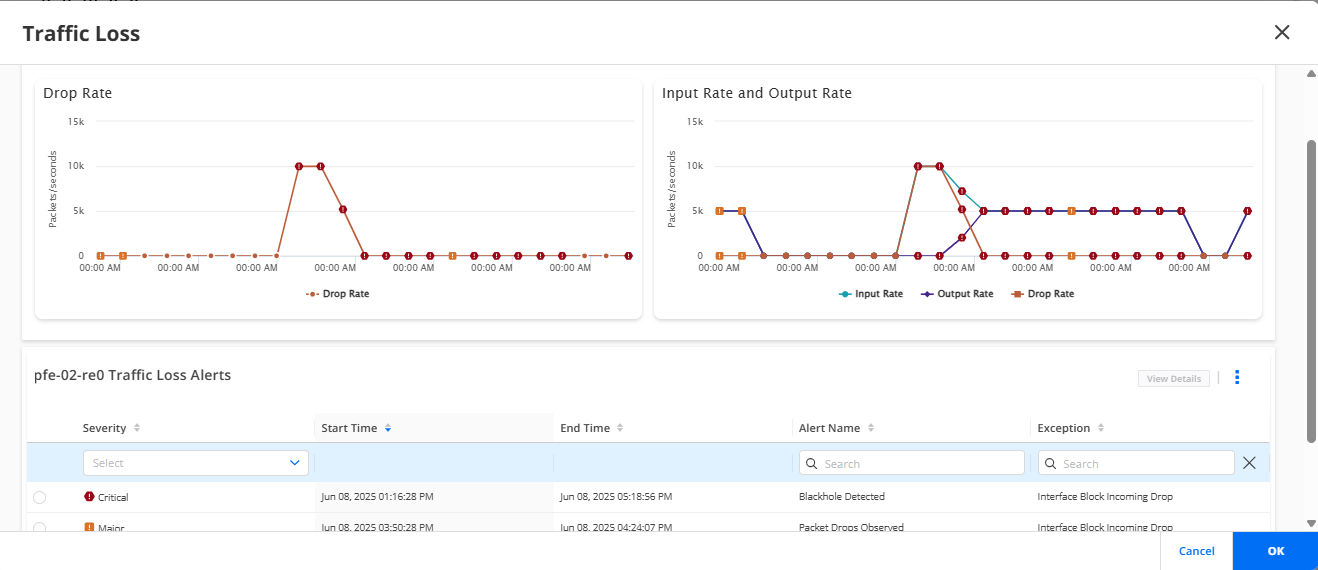
You can filter data in the Alerts table by the severity, alert name, exception, exception type, and the PFE from which the alert is raised. Select an alert and click View details to view details on the Traffic Loss Details page. The Traffic Loss Details page lists the general details of the alert on the General tab. For forwarding exceptions, additional details about the traffic flows affected by blackhole or traffic loss are displayed on the Metadata tab.
Table lists the fields on the Traffic Loss Alerts table.
| Field | Description |
|---|---|
|
Severity |
Severity of the alert:
|
|
Start Time |
The time when the packet drops or blackhole started occurring, in the MM-DD-YYYY HH:MM:SS format. For example, Jun 06, 2025 10:29:41 PM. |
|
End Time |
The time when the packet drop or blackhole was rectified, in the MM-DD-YYYY HH:MM:SS format. For example, Jun 06, 2025 10:29:41 PM. |
|
Alert Name |
Name of the alert raised by the device. For example, Packet Drops Observed, Blackhole Detected. |
|
Exception |
Message indicating the issue corresponding to the alert raised by the device. For example, Interface Block Incoming Drop. |
|
Exception Type |
Type of exception:
|
|
PFE |
For forwarding exception types, the packet forwarding engine on the device that raised the alert. |
By default, information for the past 30 minutes is displayed. To change this period, click the Week, Day, 3 hrs, 1 hr, 30 mins, or Custom buttons provided above the graph.
Predictor Events
Predictor events indicate the routing, forwarding, and OS exceptions that are identified by Routing Director as a potential indicator of traffic loss.
To view predictor events on a device, enable the Blackhole Detection option present in the Analytics tab of the Device Profile assigned to the device in a network Implementation plan. See Add a Device Profile for details.
To view details of forwarding exceptions in predictor events, the following must be configured in your Routing Director installation:
root@eop# set paragon cluster applications routingbot install-routingbot true
[edit]
root@eop# set paragon cluster applications routingbot routingbot-ipfix-vip v4-ipfix-term-address
Where, routingbot-ipfix-vi is the virtual IP (VIP) address to view
predictor events.
See Deploy the Cluster for details.
On the Predictor Events page, by default, information for the past 30 minutes is displayed. To change this period, click the Week, Day, 3 hrs, 1 hr, 30 mins, or Custom buttons provided above the Predictor Events table.
Figure 2 shows the Predictor Event page.
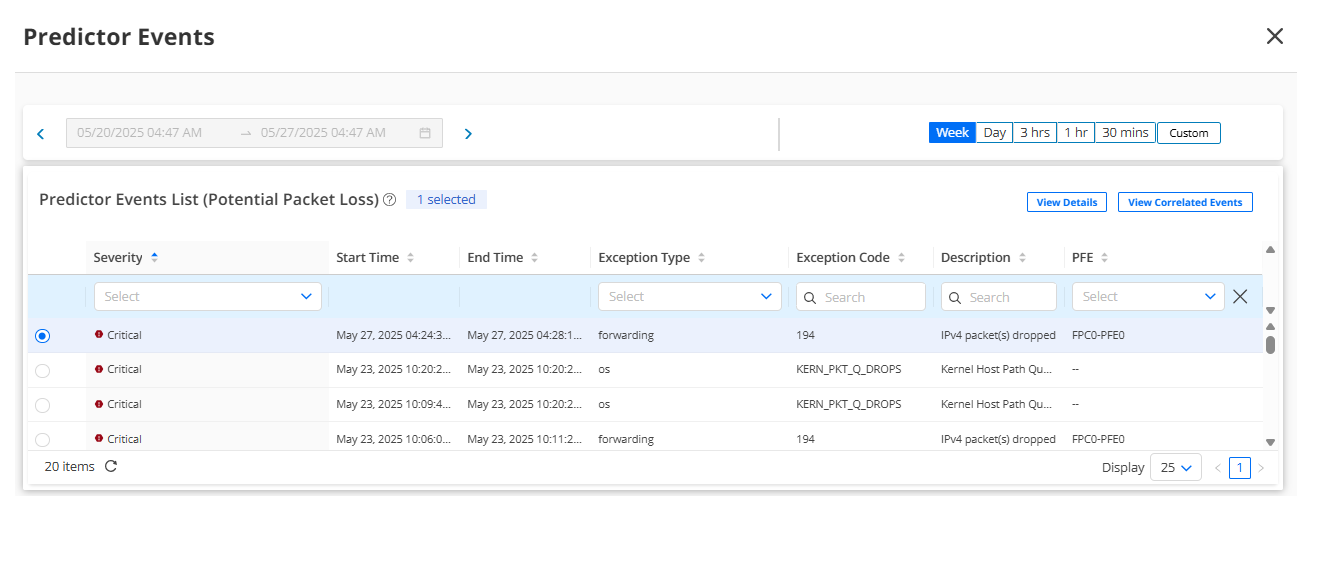
Table 2 lists the fields on the Predictor Events table.
| Field | Description |
|---|---|
| Severity |
Severity of the alert:
|
|
Start Time |
The start time (referenced to the local time zone) of the predictor event, in the MM-DD-YYYY HH:MM:SS format. For example, Jun 06, 2025 10:29:41 PM. |
|
End Time |
The end time (referenced to the local time zone) of the predictor event, in the MM-DD-YYYY HH:MM:SS format. For example, Jun 06, 2025 10:50:20 PM. |
|
Exception Type |
Type of exception:
|
|
Exception Code |
Code for the exception. |
|
Description |
Description of the predictor event alert. |
|
PFE |
PFE on which the forwarding exception occurred. This field is not relevant for routing and OS exceptions. |
For further information on a predictor event, select an alert and do any of the following:
-
Click View Details to view details of the predictor event on the Predictor Event Details page.
The General tab of the Predictor Event Details page displays the general information (exception code, component on which the exception occurred, type of exception, and so on) and the Metadata tab displays flow information for forwarding exceptions and additional information for routing and OS exceptions.
-
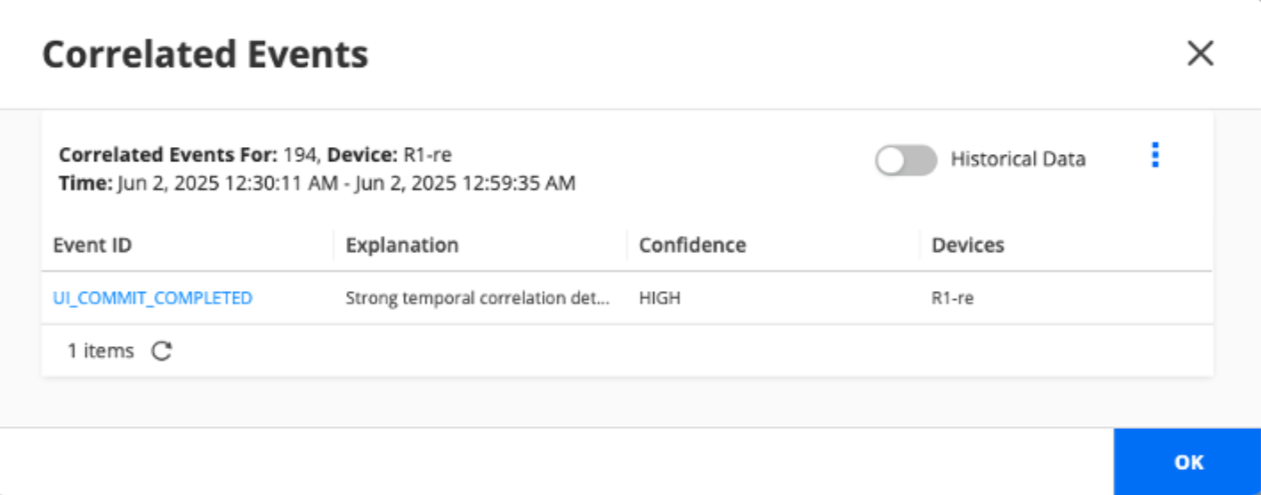
Click View Correlated Events to view events correlated to the predictor event. Correlated events identify other network events that have occurred on onboarded devices and that may have lead to the selected exception on the device.
Figure 3 shows the correlated events page.
| Field | Description |
|---|---|
|
Event ID |
Identifier of the correlated event. A correlated event can be:
|
|
Explanation |
Explanation of how the event is correlated to the predictor event. |
|
Confidence |
Degree of confidence (relevance) that the correlated event has caused the predictor event. Confidence can be—Low, Medium, and High. Correlated events help to identify potential root cause of problematic exceptions or events that may lead to traffic loss. For example, IPv4 packet drop due to a discarded route could be because of a change in the device configuration or change in the route state. Correlated events are listed in the decreasing order of confidence. |
|
Devices |
Devices on which the correlated events have occurred. |
Clicking the Event ID of a correlated event opens the Events page filtered by the event ID. Enable Historical Data to view additional events that may have contributed to the predictor event over a period of time. The correlated events table lists up to 10 correlated events in the decreasing order of relevance.
Routing Director runs a job every 15 minutes to identify and list correlated events. As a result, it may take up to 15 minutes for a correlated event to be listed for a predictor event. For instance, if a correlated event is identified in the 1st minute of a 15-minute interval when the job runs, the correlated event will be listed after 15 minutes. Conversely, if a correlated event is identified in the 11th minute of the 15-minute interval, it will be listed after 4 minutes.