Visualizing MITRE Tactic and Technique Coverage in Your Environment
If you want to filter by MITRE ATT&CK tactics, you must first map your rules to MITRE tactics and techniques. For more information, see Editing MITRE Mappings in a Rule or Building Block.
Visualize the coverage of MITRE ATT&CK tactics and techniques that the rules provide in IBM QRadar. After you organize the rule report, you can visualize the data through diagrams and heat maps and export the data to share with others.
-
Click ATT&CK Actions > Coverage map
and report in the upper right of the visualization pane.
-
Select from the filters in the MITRE ATT&CK section.
The following options are available to filter:
Tactics
Select tactics from the list. For example, an Initial Access tactic is used by adversaries who are trying to get into your network.
Technique
Search for techniques and their sub-techniques or select them from the list. The techniques are pre-filtered to match the selected tactic. For example, an Account Discovery technique occurs when adversaries attempt to get a list of your local system or domain accounts.
Sub-techniques are identified by a dot in the ID, such as "T1003.002 Security Account Manager". Sub-techniques provide a more specific description of the behavior an adversary uses to achieve their goal. For example, an adversary might dump credentials by accessing the Local Security Authority (LSA) Secrets.
Mapping confidence
Indicates mappings that are assigned a specific level of confidence for rule coverage.
Mapping enabled
Indicates for each rule whether the mapping between the tactic or technique and rules is turned on. Mappings that are not enabled are not added to the technique coverage heat map.
- To update the rule report with your filters, click Apply Filters.
-
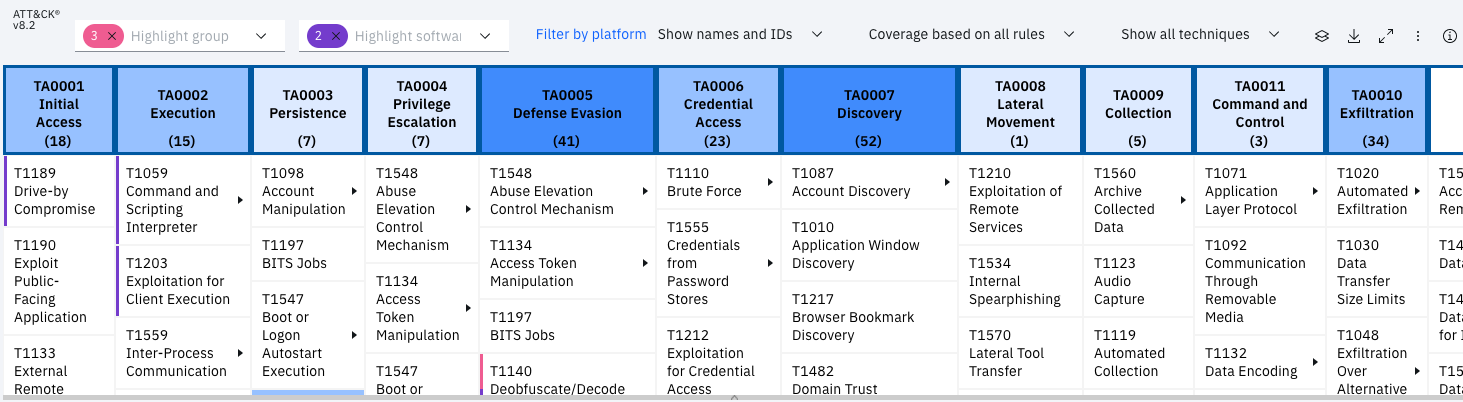
Scroll through the heat map visualization to see the different techniques that
are covered by QRadar Use Case Manager. The number in the chart header indicates
the number of rules that are mapped per tactic. (This number might be larger
than the sum of the number of mappings of its techniques because the mappings
are done directly to the tactic, not to the technique.)
Hover over the number in each technique cell to see the number of rules that are mapped to the technique, and then click the number in the cell to see the heat map calculation for the technique. For more information, see MITRE Heat Map Calculations.
- Click the arrow in the cell to expand the columns to display the sub-techniques for the technique. Hover over the sub-technique cell to see the number of rules that are mapped to the sub-technique, and then click the number to see the heat map calculation for that sub-technique. For more information, see MITRE Heat Map Calculations.
- To change the labeling in the chart, click the Show option in the report menu bar and select from names, technique IDs, or technique names and IDs. By default, the technique names are displayed.
- To see only the mappings for rules that are currently in the coverage map and report, select the Coverage based on rules in report option in the report menu bar. Click any section in the heat map and then click Apply Filters to update the filtered list in the table report.
- To see which MITRE techniques are being used by adversary groups and software, select the appropriate filters from the Highlight groups and Highlight software lists. Relevant groups are highlighted in the heat map by pink sidebars, and relevant software are highlighted by purple sidebars.
-
To see only the techniques that are selected in the filter, hold the control
key (on Windows) or the command key (on Mac) of your keyboard and select the
relevant techniques on the heat map. Then select the Show techniques
in filter option in the report menu bar. All other filters are
hidden in the heat map.
Tip:
If you don't see any technique filters in the heat map, add techniques in the MITRE ATT&CK section of the filter pane or select techniques in the map.
- To see only the sub-techniques for each tactic and technique, click the stack icon in the report menu bar.
-
To change the platforms that are filtered in the heat map, click
Filter by platform and change the selection in your
user preferences.
By default, the heat map shows tactics, techniques, and sub-techniques from three platforms: Linux, macOS, and Windows.
The Selected platforms filter tag in the filter bar is not selectable, but represents the selected MITRE ATT&CK platforms, and is added whenever the report includes ATT&CK-related filters or columns. To change the selected platforms, modify your user preferences. For more information, see Customizing user preferences.
- To work with tactics, techniques and sub-techniques from other platforms, click Filter by platform and change the selection in your user preferences. Changing the platform also affects the contents of MITRE filters on the Use Case Explorer page and MITRE ATT&CK Mappings edit page.
- To export the current display of the chart as a PNG image, click the export icon. Then, you can share the image with colleagues or executives who don't have access to QRadar Use Case Manager.
-
To expand the visualization pane to the width of your screen, click the
maximize icon on the menu bar of the pane. Zoom in or out to see the
visualization at the size you want. Any filtering that you apply in the expanded
pane is kept when you return to the Use Case Explorer.
Note:
The zoom capability is not supported on Mozilla Firefox. Use the browser control to zoom in and out.
- Close the report visualization to return to the dashboard.