
ON THIS PAGE
Create an IBA Probe and Processor
We've created a custom telemetry service for BFD. Next, we'll create a probe and add a processor to enable Apstra to collect data from the telemetry service. Before continuing, we first need to understand IBA and the role of processors.
Introduction to IBA
IBA, or Intent-Based Analytics, is a real-time analytics pipeline composed of processors in two categories: source processors and analytical processors. Source processors, the pipeline's initial stage, ingest telemetry data from built-in and custom telemetry services. These processors use graph queries to define data collection scope, skip an input stage, and produce data for downstream analytical processors.
Types of Processors
Source processors start the IBA pipeline by ingesting telemetry data from both built-in and custom telemetry services. These processors do not require an input stage and produces initial data for downstream analytical processors. The three types of source processors are described in Table 1.
You can also add analytical processors to the probe for extra data analytics. See Add an Analytical Processor for details.
| Built-in Processors | Built-in processors ingest data from service collectors as a
source for IBA Probes. These processors are designed for use
cases involving one or more predefined IBA Probes but can also
be used in custom probes. Some examples of built-in processors
include the following types:
|
| Extensible Processors |
Extensible processors ingest data from extensible collectors as a source of IBA probes. This category includes processors for custom service collectors. You can use a graph query to determine which systems to activate the service on depending on the service’s data type: Static or Dynamic. For static or dynamic data types, use graph elements to map the service keys to determine the scope of the telemetry collection, including which telemetry series to extract from each system. |
| Graph Processors | Graph processors ingest data from the graph database as a source of IBA Probes. These processors do not consume device telemetry data. The only processor in this category, Generic Graph Collector, ingests data from the active graph. The value field expression generates a value for each item in the graph query response. |
Create a Probe
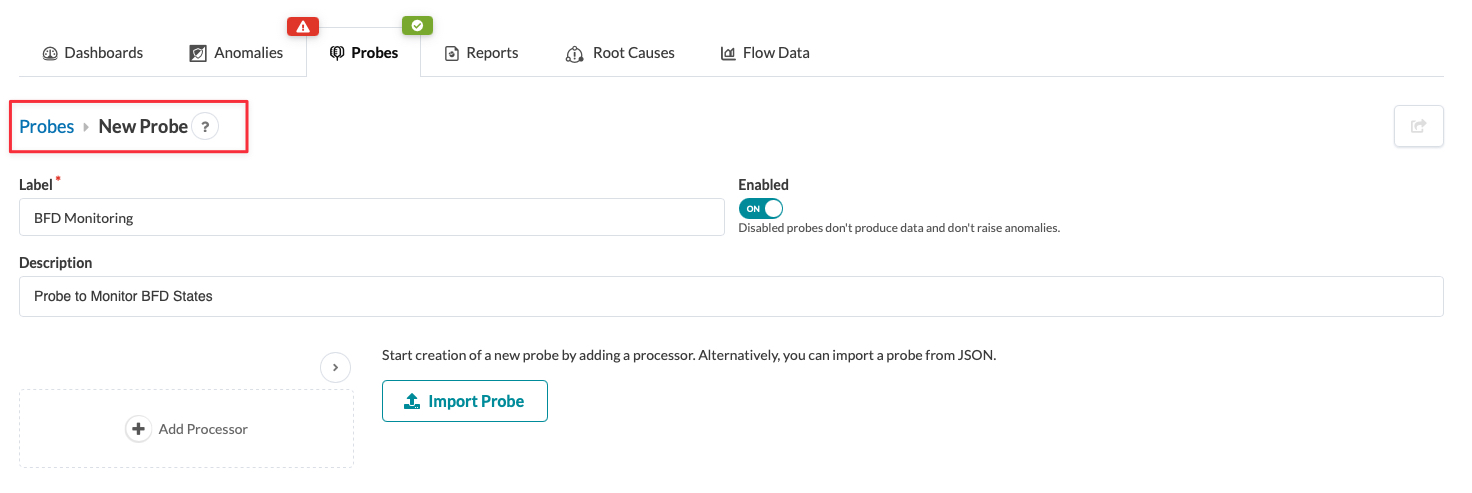
To create a probe:
-
Enter a label for the new probe. Optionally, you can enter a
description.
-
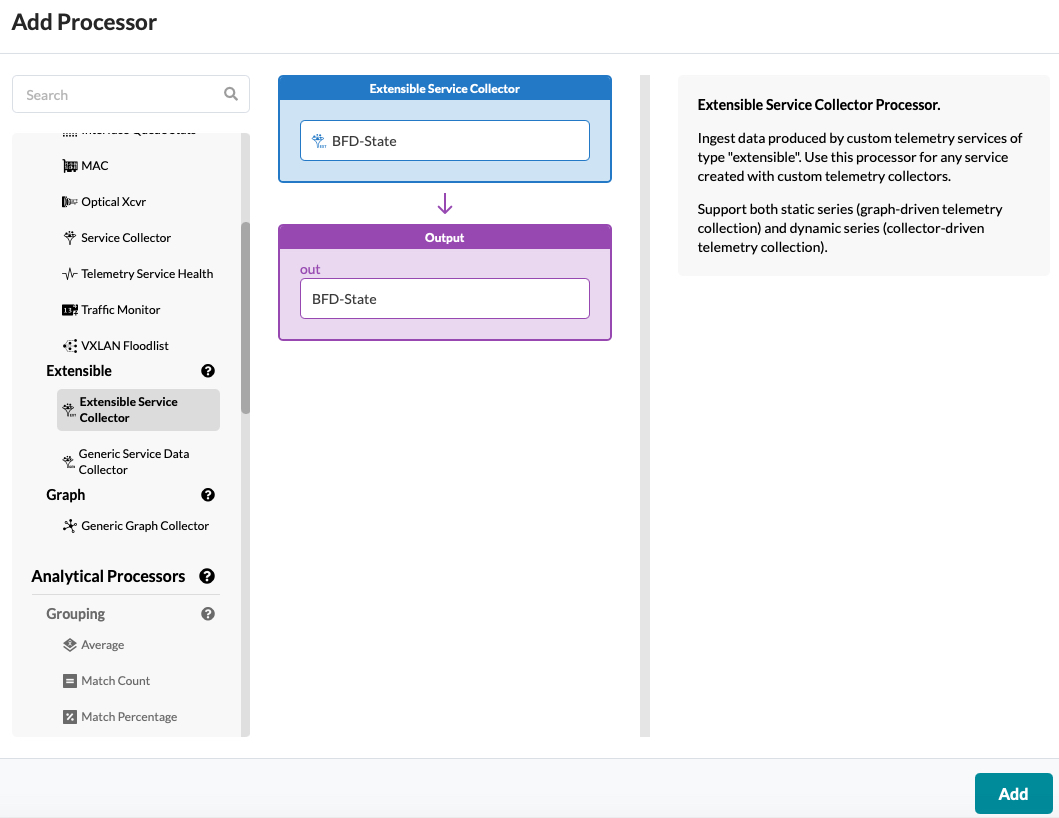
Rename the collector. For our example, we renamed the collector and output
fields to BFD-state.
You can use this processor for any service you create with custom telemetry collectors. This collector supports both static series (graph-driven) and dynamic series (collector-driven) telemetry collections.
-
Click Add.
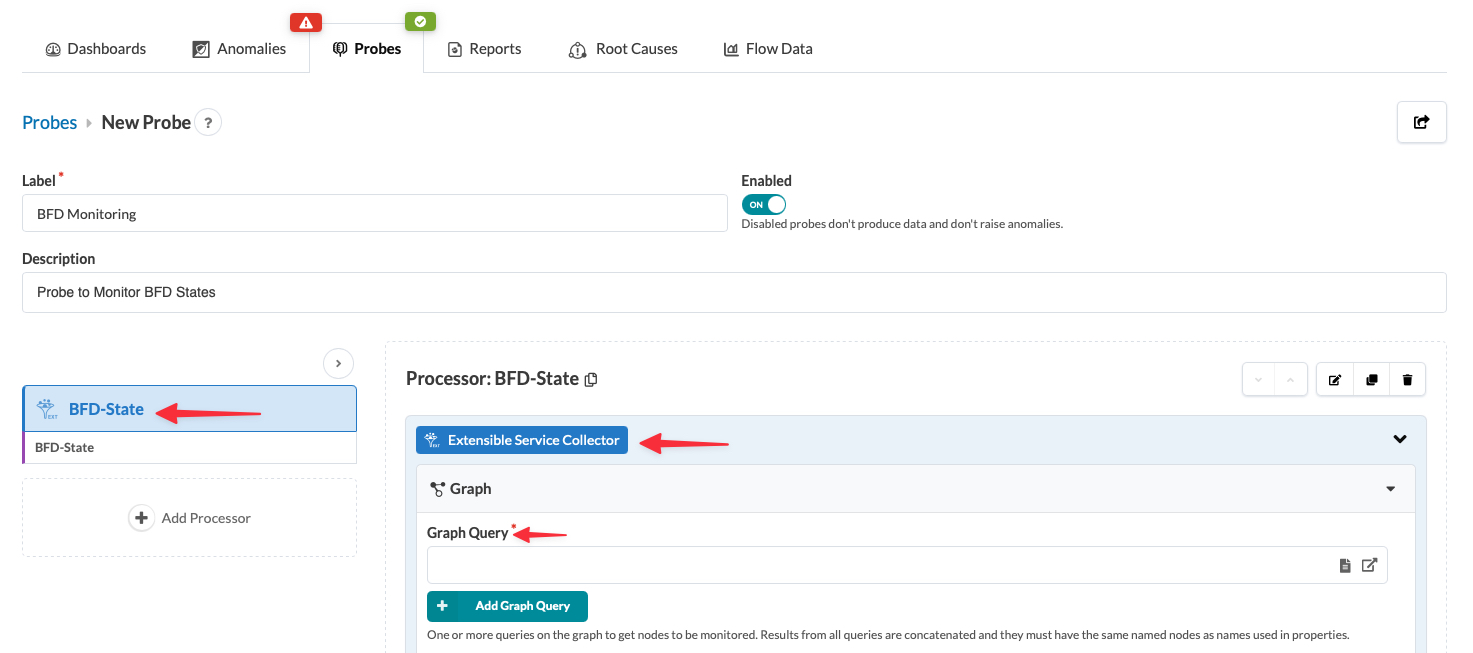
Continue to Graph Database Overview for an overview of the graph database. Or, skip to Add Graph Queries to the Probe.