
Add an Analytical Processor
Analytical Processors Overview
Analytical processors receive data from sources or other processors, analyze it, and prepare it for further analysis. Each processor has at least one input and one or more outputs.
Analytical processors fall into the following categories:
-
Grouping
-
Check
-
Periodic
-
Arithmetic
-
Specialized
-
Miscellaneous
Our use case highlights two analytical processors for BFD monitoring: the State processor and the Match Count processor. In the following sections, we'll configure these processors to run simultaneously and apply specific functions to the output of the source processor output.
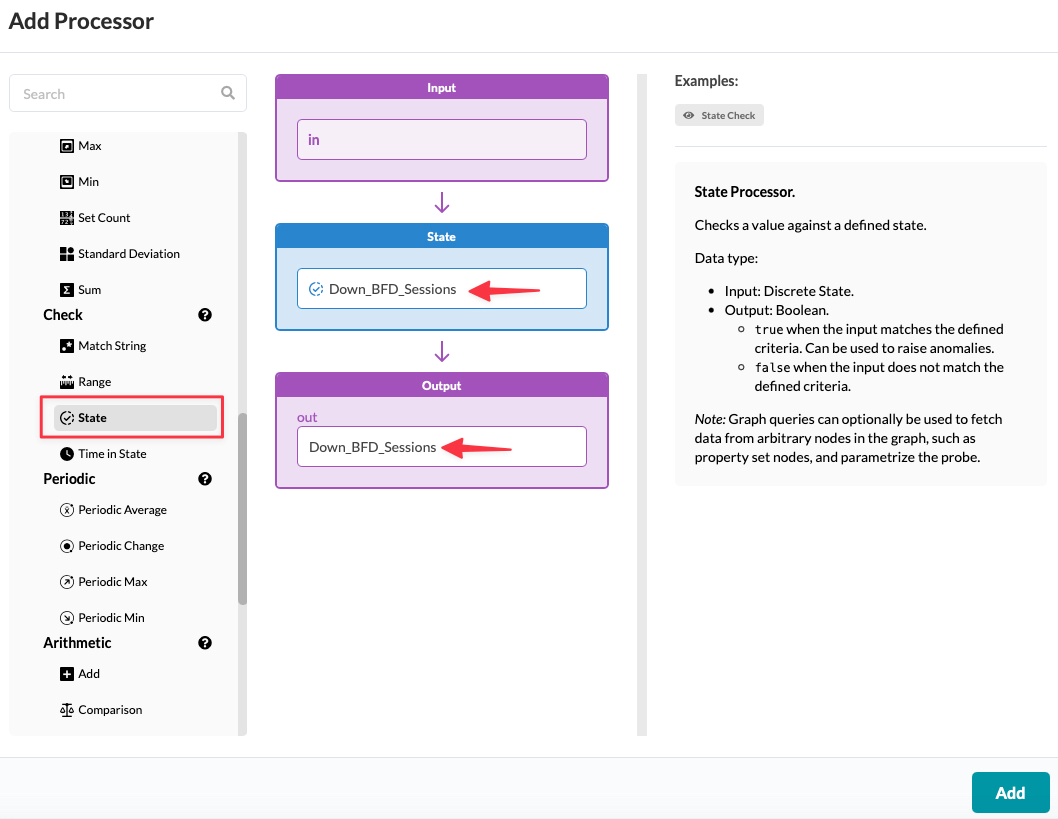
Add a State Processor
true when the input matches the
specified criteria, enabling anomalies. In BFD monitoring, the processor monitors
the BFD state for each neighbor. The processor triggers an anomaly whenever the
state is 'Down', 'Init' or
'Failing'.-
Rename the State and Output
fields. Because we are monitoring down sessions, we renamed the fields to
Down_BFD_Sessions.
-
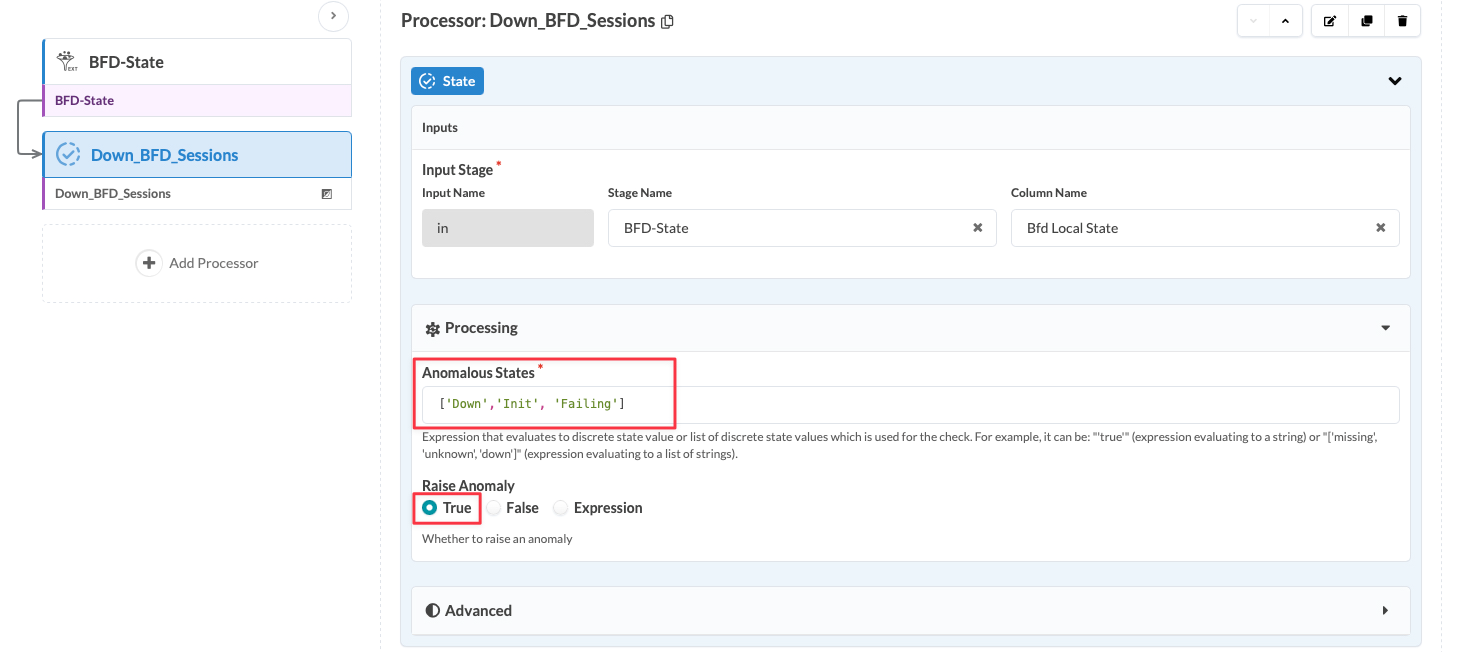
Enter the following values:
In our example, the output of the source processor functions as input for the analytical processor.
-
Inputs:
-
Stage Name: BFD-State
-
Column Name: BFD Local State
-
-
Raise Anomaly: True. This setting triggers an alert when the comparison result is
true.
-
-
Click Update Probe.
The processor outputs
truefor sessions in the 'Down', 'Init', or 'Failing' state, (see the Value column), andfalsefor all other sessions. The processor detects five anomalies, indicating that five BFD sessions are Down. All sessions are linked to the generic system (to_generic) as shown in the Link column.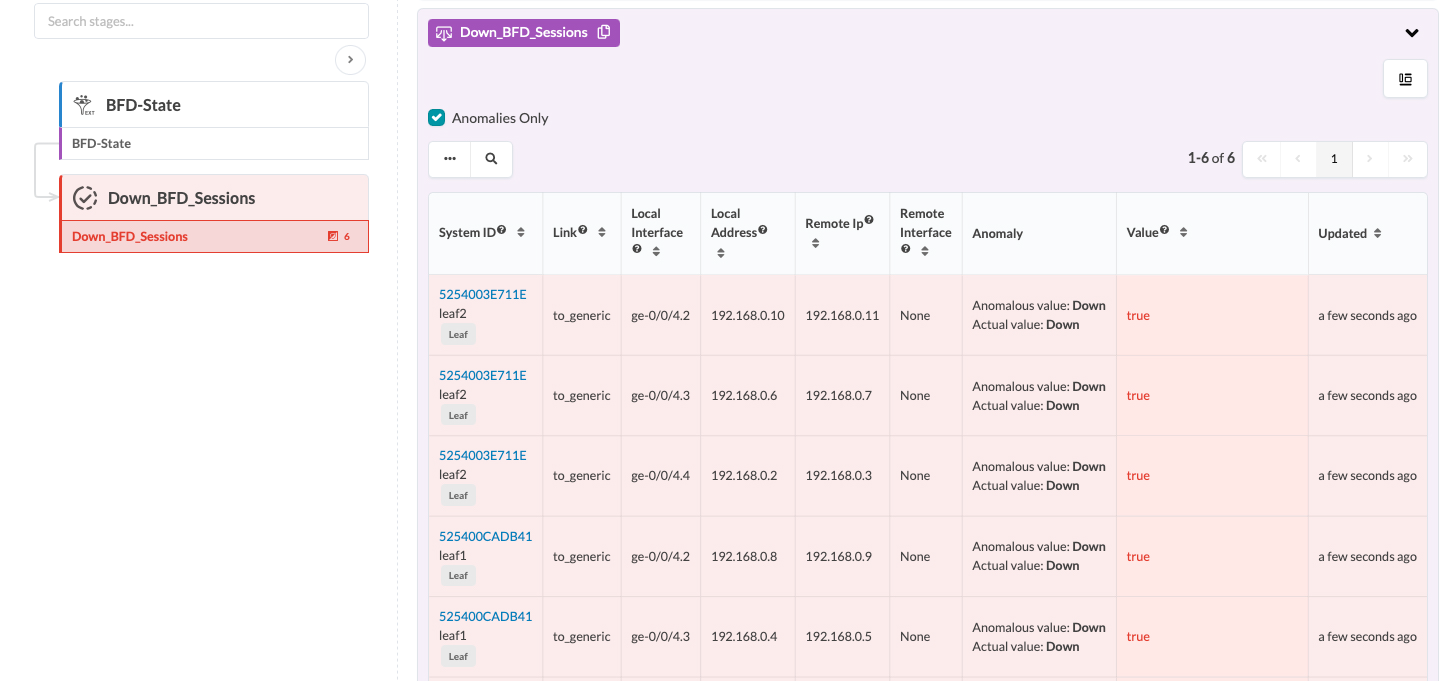
The following example shows a negative (
false) value. A false value indicates that all BFD sessions are operational.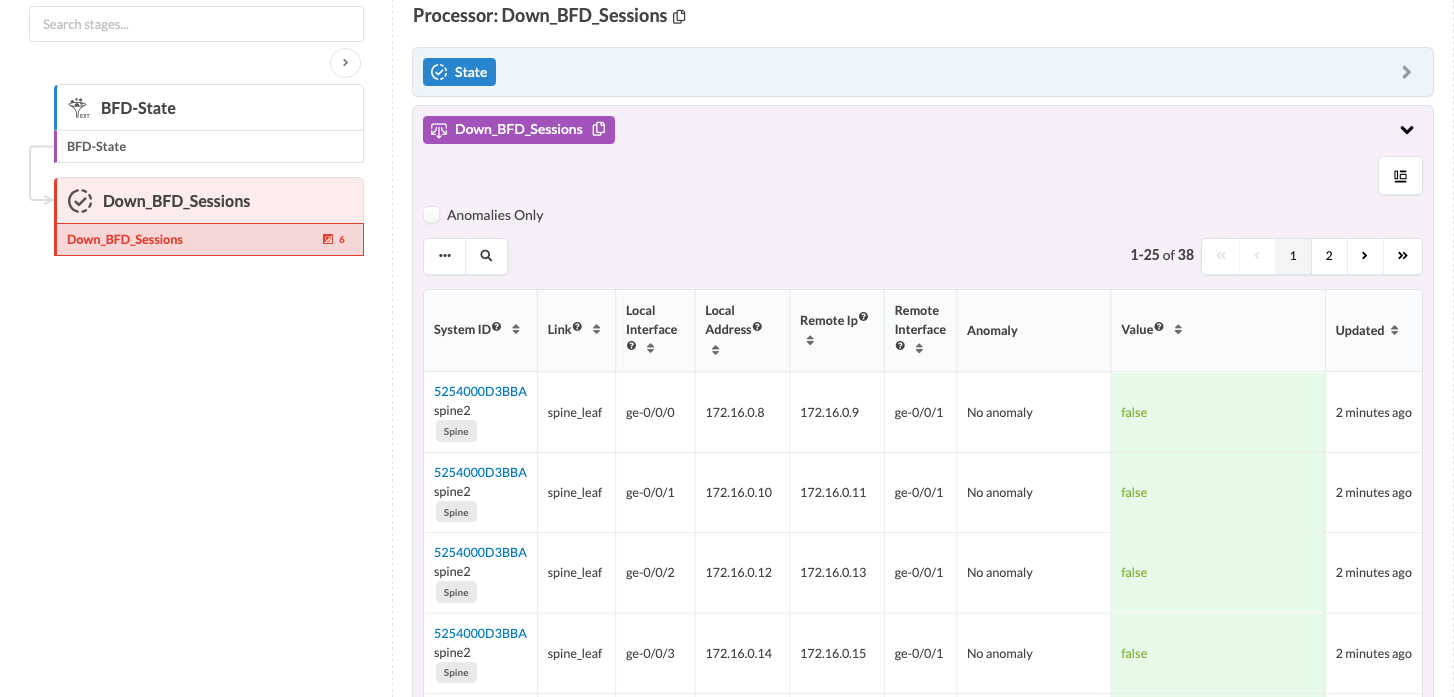
Add a Match Count Processor
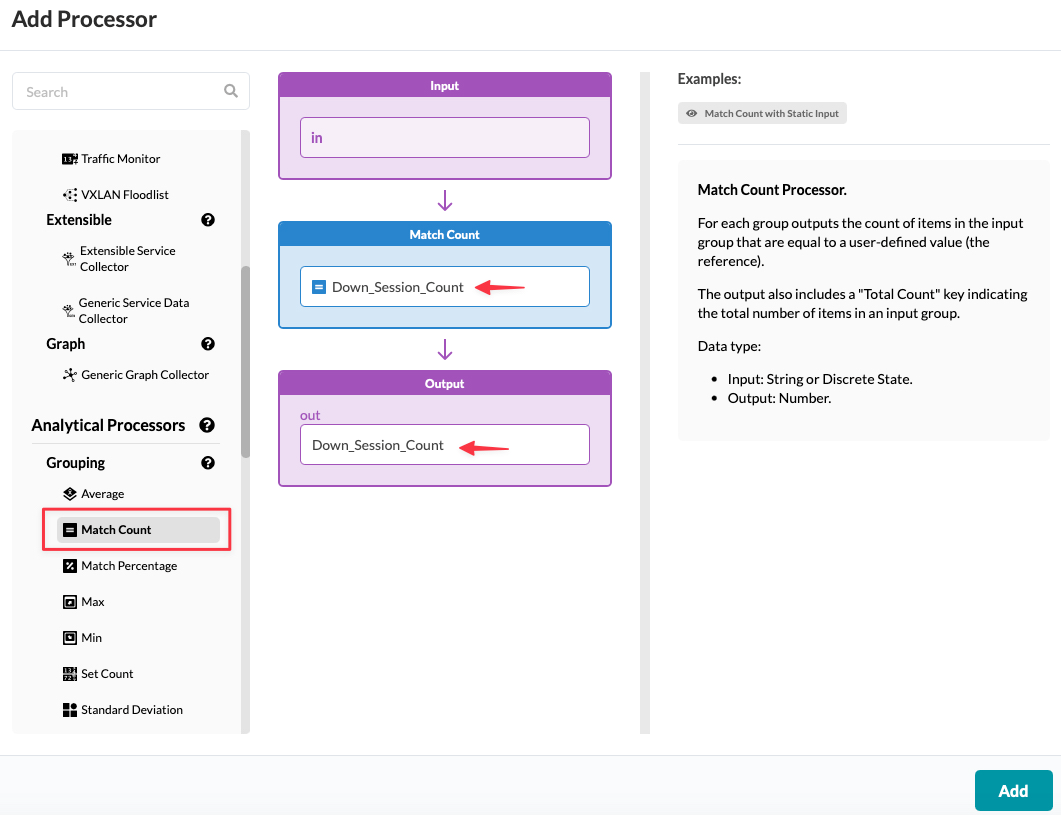
As a grouping processor, the Match Count Processor requires a
Group_By configuration parameter that defines the grouping
scheme. The processor produces results based on the defined grouping scheme. In
the pipeline, the Match Count processor serves as the final stage.
-
Rename the Match Count and Output
stages. We renamed both stages to
Down_Session_Count.
-
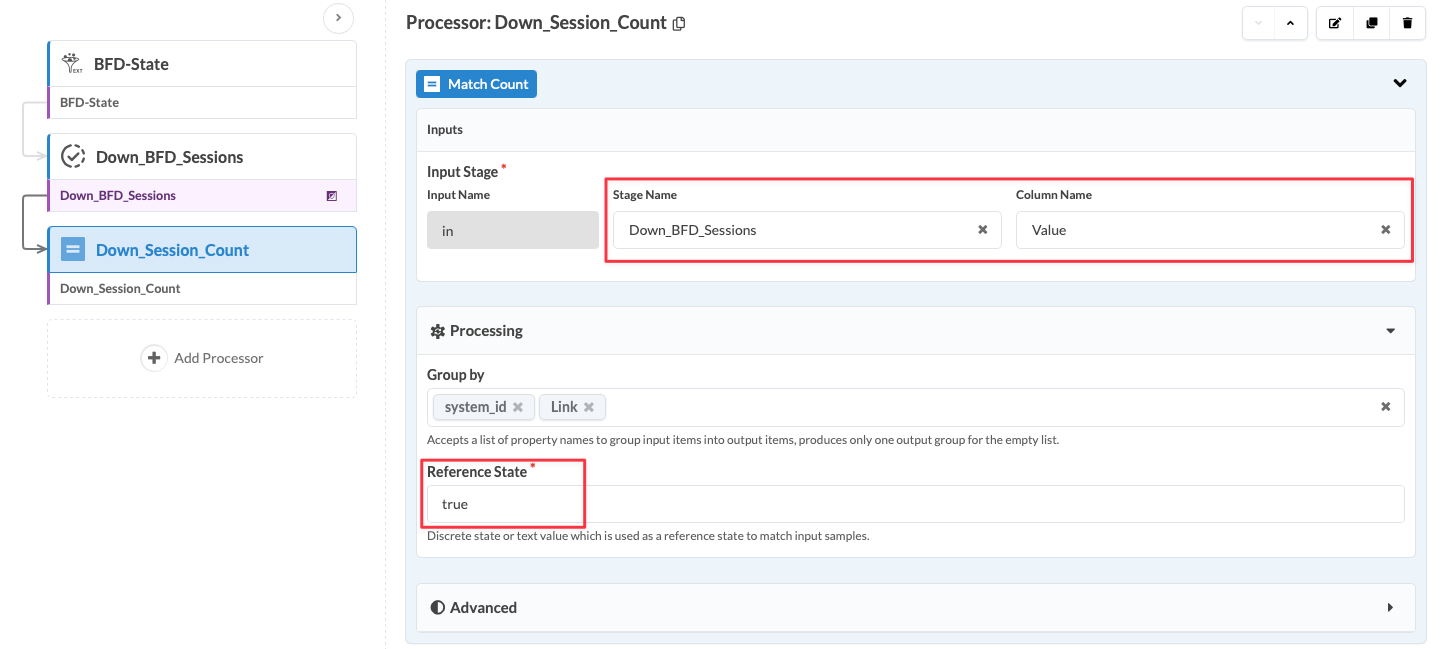
Enter the Match Count values:
For our example, we set the values to the following:
-
Inputs:
-
Stage Name: Down_BFD_Sessions
-
Column Name: Value
-
Processing
-
Group by:
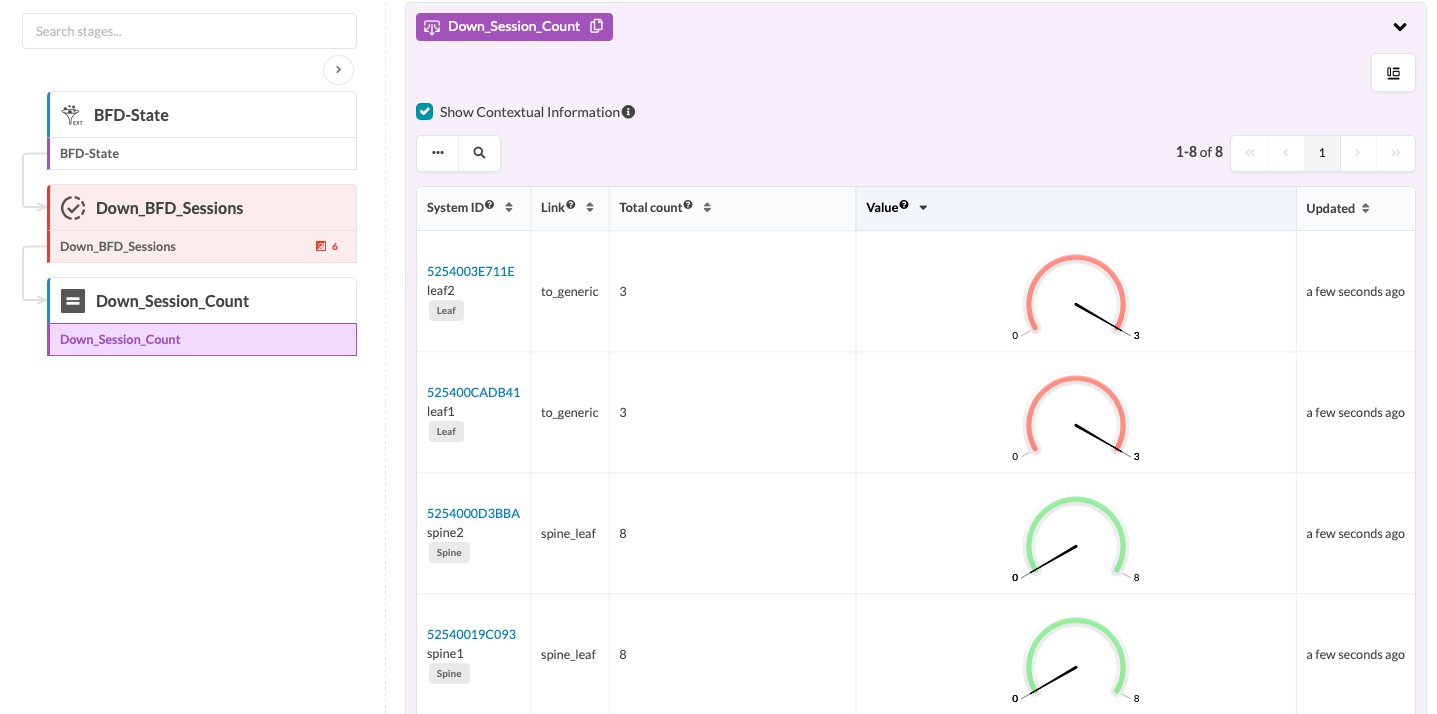
system_idandLink. The processor receives input from the State processor output (true or false) and counts those values to generate a numeric total. -
Reference State:
true. This setting triggers an alert when the comparison result is true.
-
-
-