
Create the Dashboards and Widgets
Next we'll create dashboards that display live anomalies and down BFD session counts for Fabric and External BGP sessions. We’ll build widgets directly from the output stage of each relevant analytical processor to populate the dashboards. This method ensures that fields populate automatically and that new widgets inherit the filters configured at the processor output. For this use case, we’ll create the dashboards from widgets created from the output stage of both State and Match Count analytical processors.
Create Widgets for Fabric-Side BFD Sessions
To create a dashboard widget for a fabric-side BFD session:
-
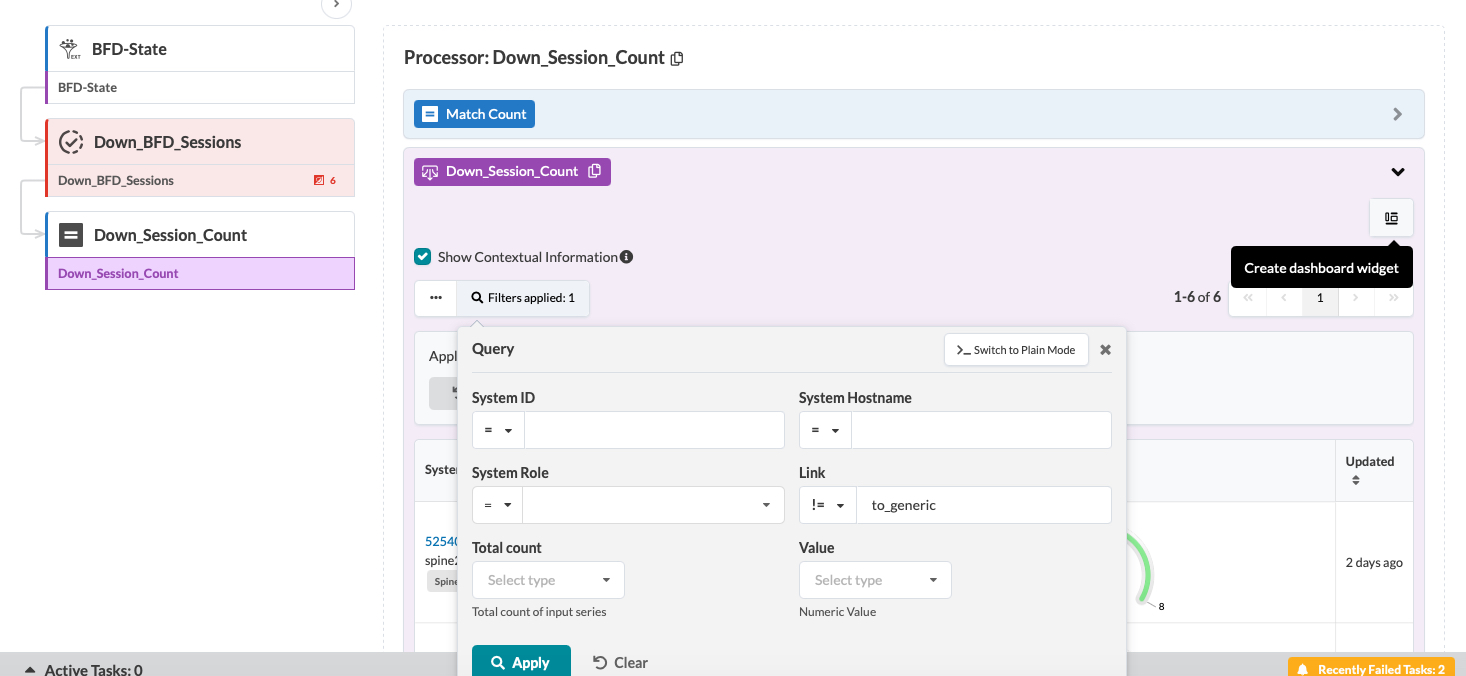
Click the Create dashboard widgetin the upper right
corner.
-
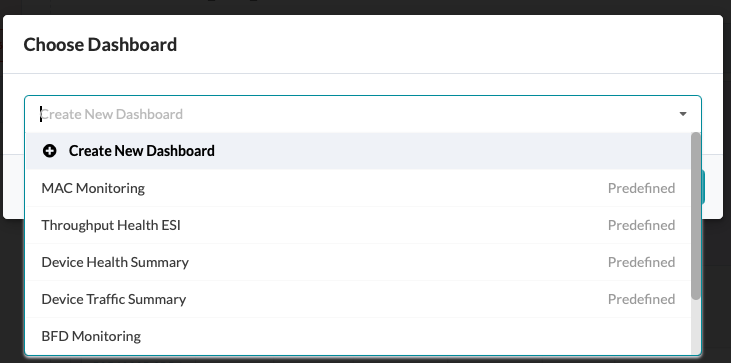
Select a dashboard from the Create New Dashboard
drop-down list and click Proceed. You can
select one from the list our create your own. For our example, we chose
BFD_Sessions-Monitoring.
-
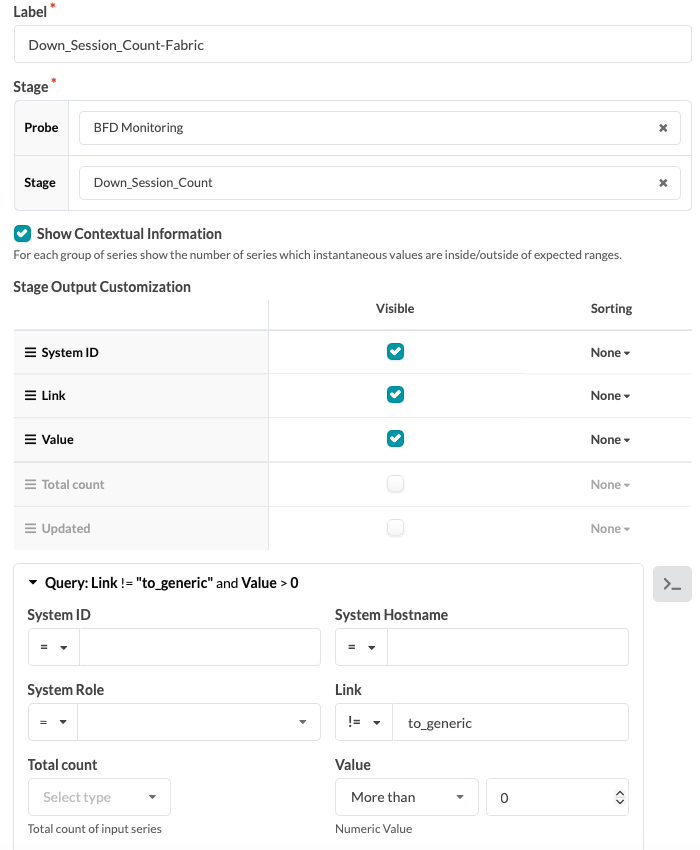
From the Create Widget page, assign a
Label to the widget. We'll call it
Down_BFD_Sessions-Fabric.
Check the Anomalies Only box to display anomalies. Then select the output-stage columns you want visible in the widget.
Under Query, from the Link drop-down list, select the equals (
=) filter and enterto-generic. This step ensures that only fabric-facing interfaces appear in the dashboard columns.Click Create to finish creating the widget.
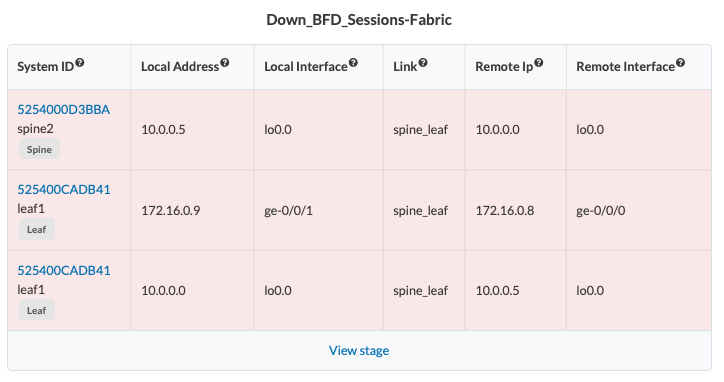
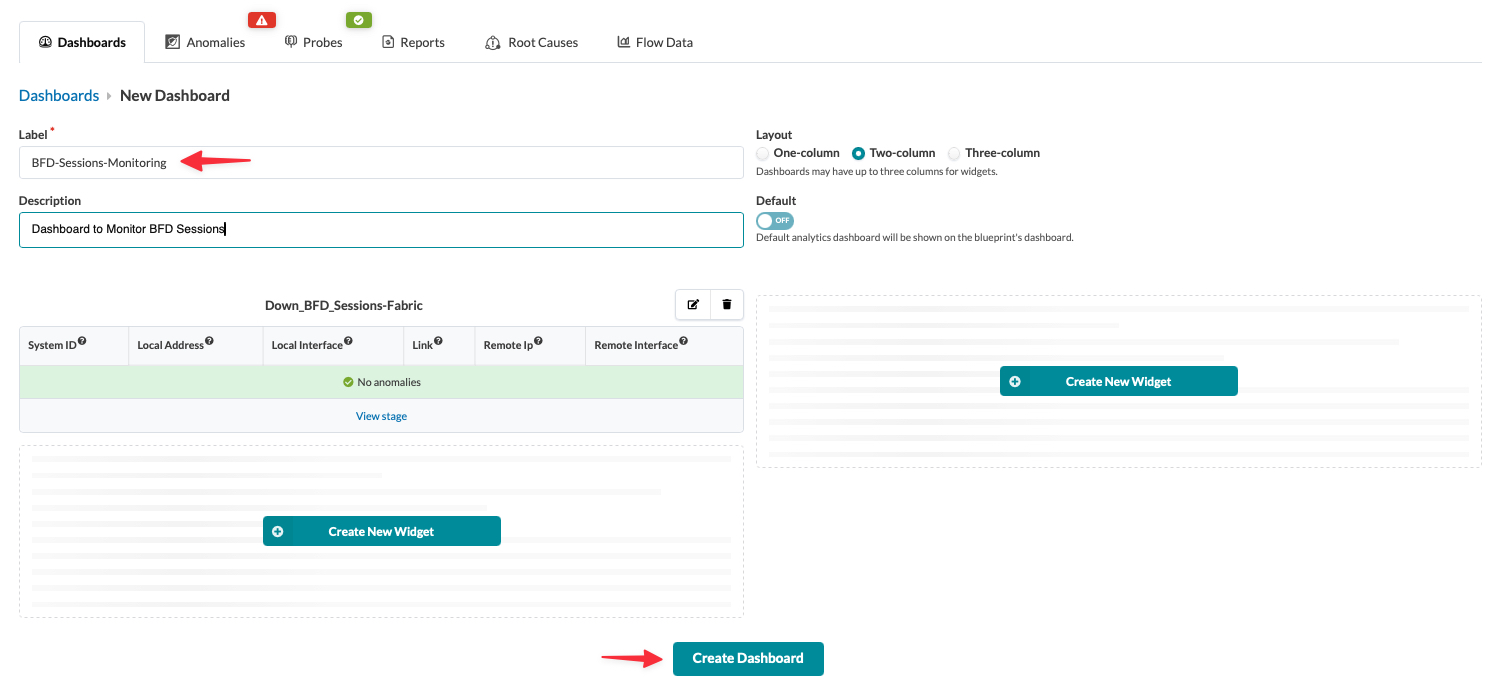
The image below shows the output of the above created widget. Some anomalies are present because certain fabric-facing BFD sessions are down.
-
Select the number of columns to display for the widgets. For this
dashboard, we're using a Two-column layout.
-
Now, let's create another widget that shows the total count of the BFD
sessions that are down. We'll follow the same steps as
From the Processor: Down_Session_Count page, select the Create dashboard widget icon in the upper right corner.
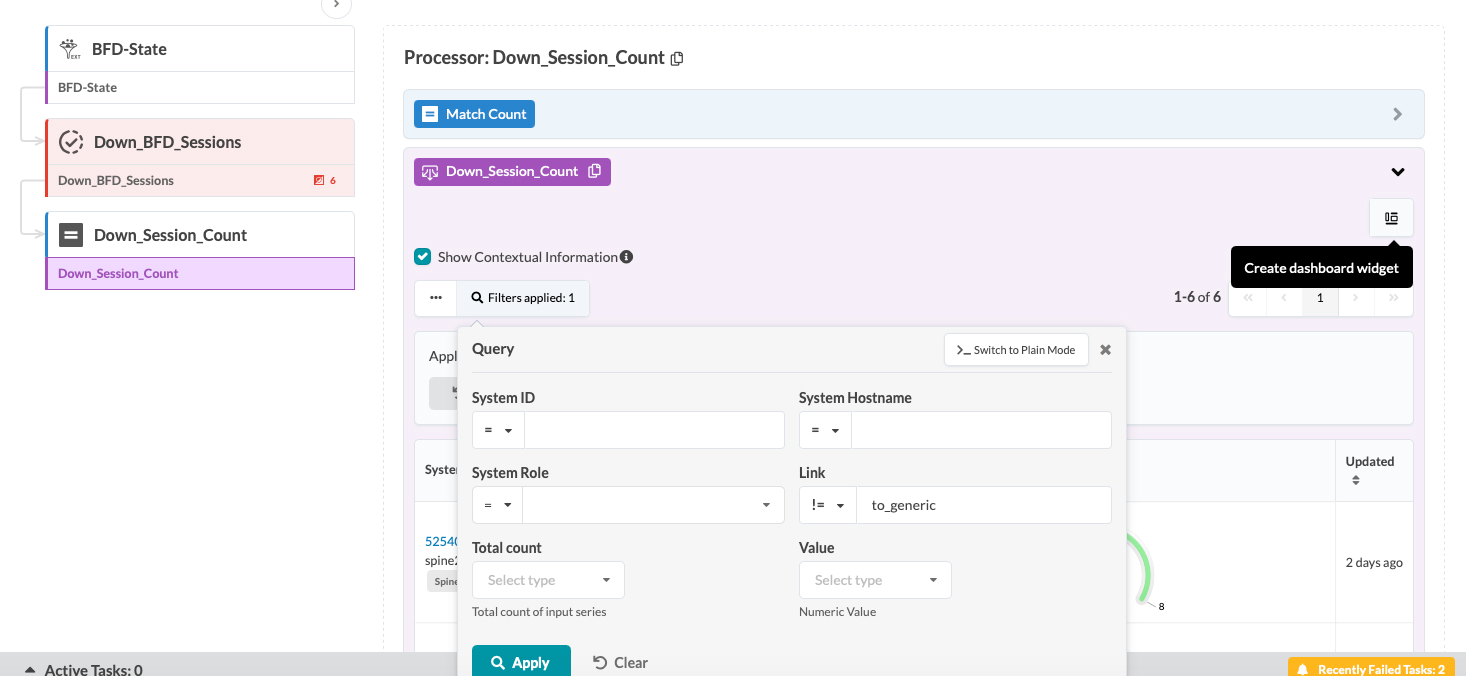
Select the existing dashboard BFD-Session-Monitoring to add the widget to the layout.
Name the widget. We'll call it Down_BFD_Sessions_Count_Fabric.
Check the Anomalies Only box. Then select the output-stage columns you want visible in the widget.
Click Create to finish creating the widget.
Click Update Dashboard to add the second widget to the layout.
Note: Updating the dashboard is required whenever a new widget is added to the layout.
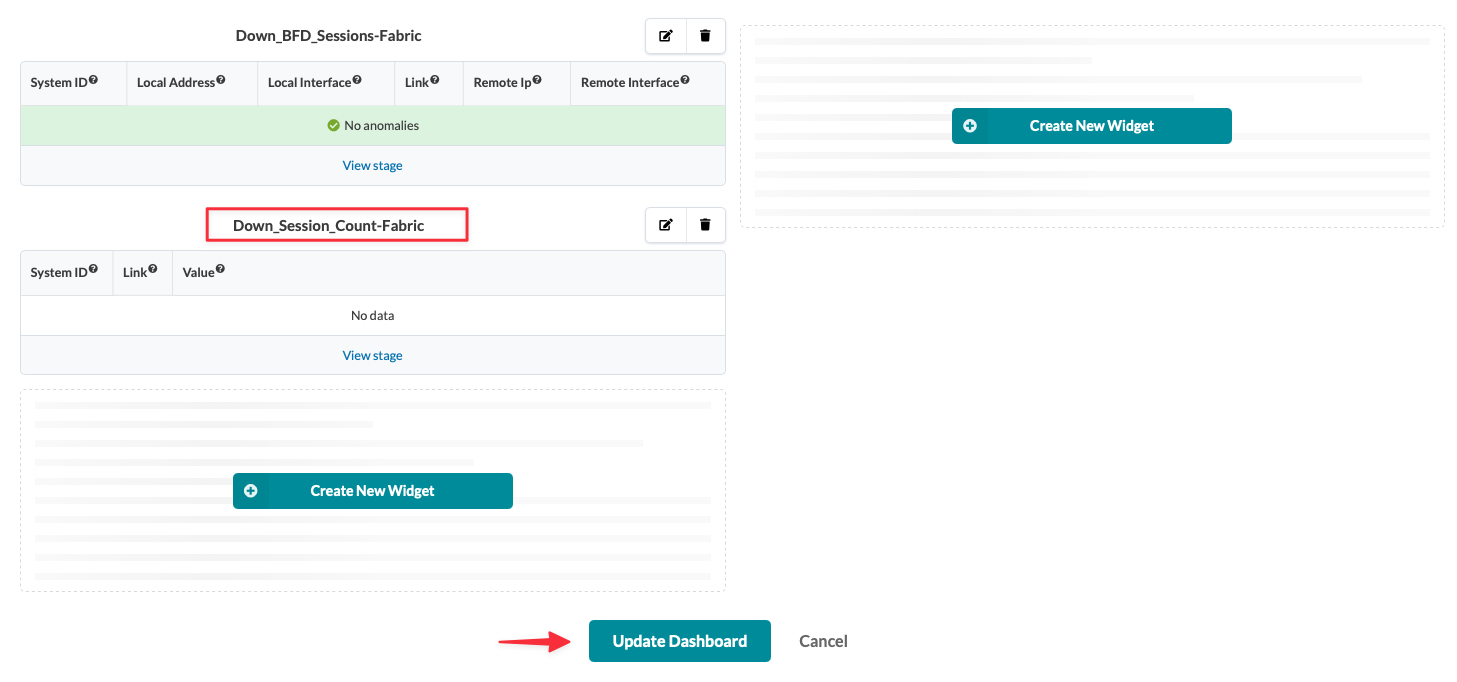 You successfully created widgets for fabric-side BFD sessions.
Create External BFD Session Widgets
To create an external BFD Session, we'll follow the the same steps as fabric-side BFD
sessions widgets. The only difference is the filter configuration. For this
configuration, we'll apply the filter link = to_generic at the
output stage of both the State and Match Count processors to include only external
links in the widget.
View the Dashboard Status
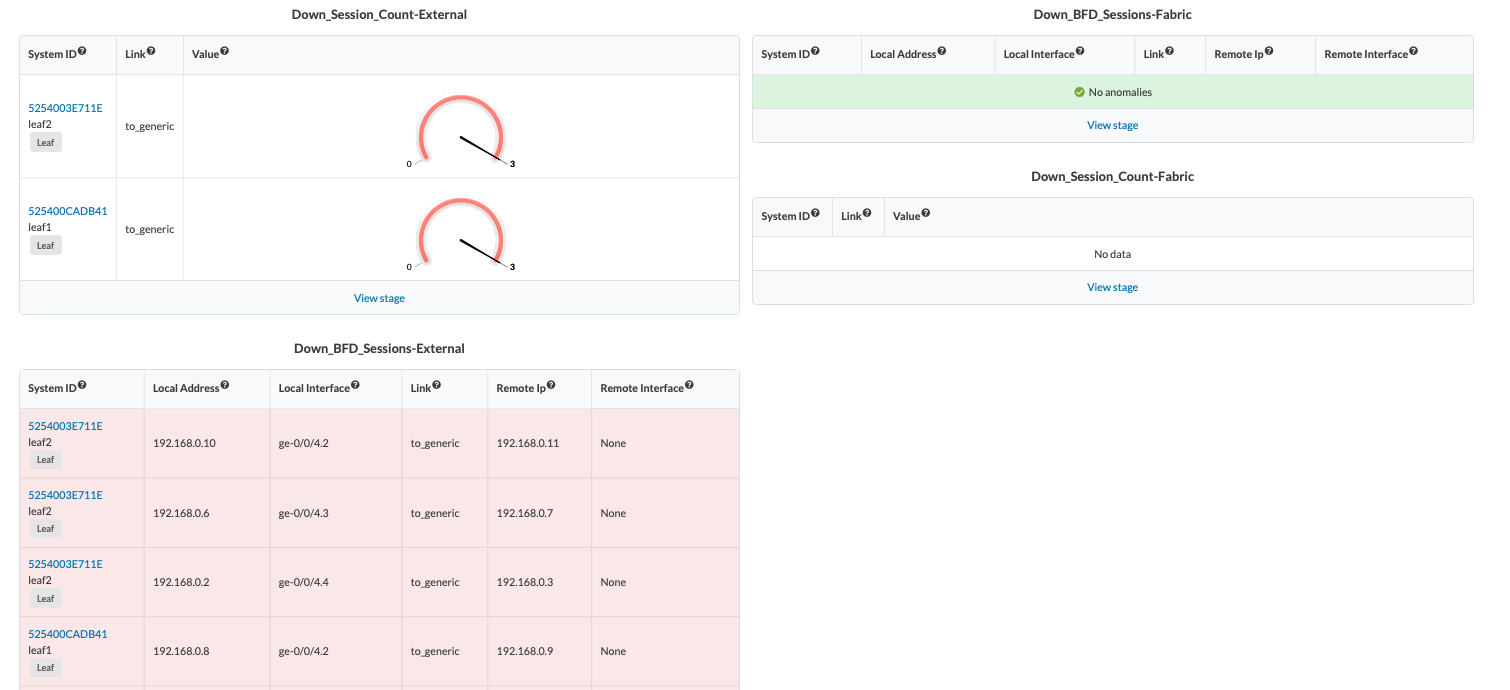
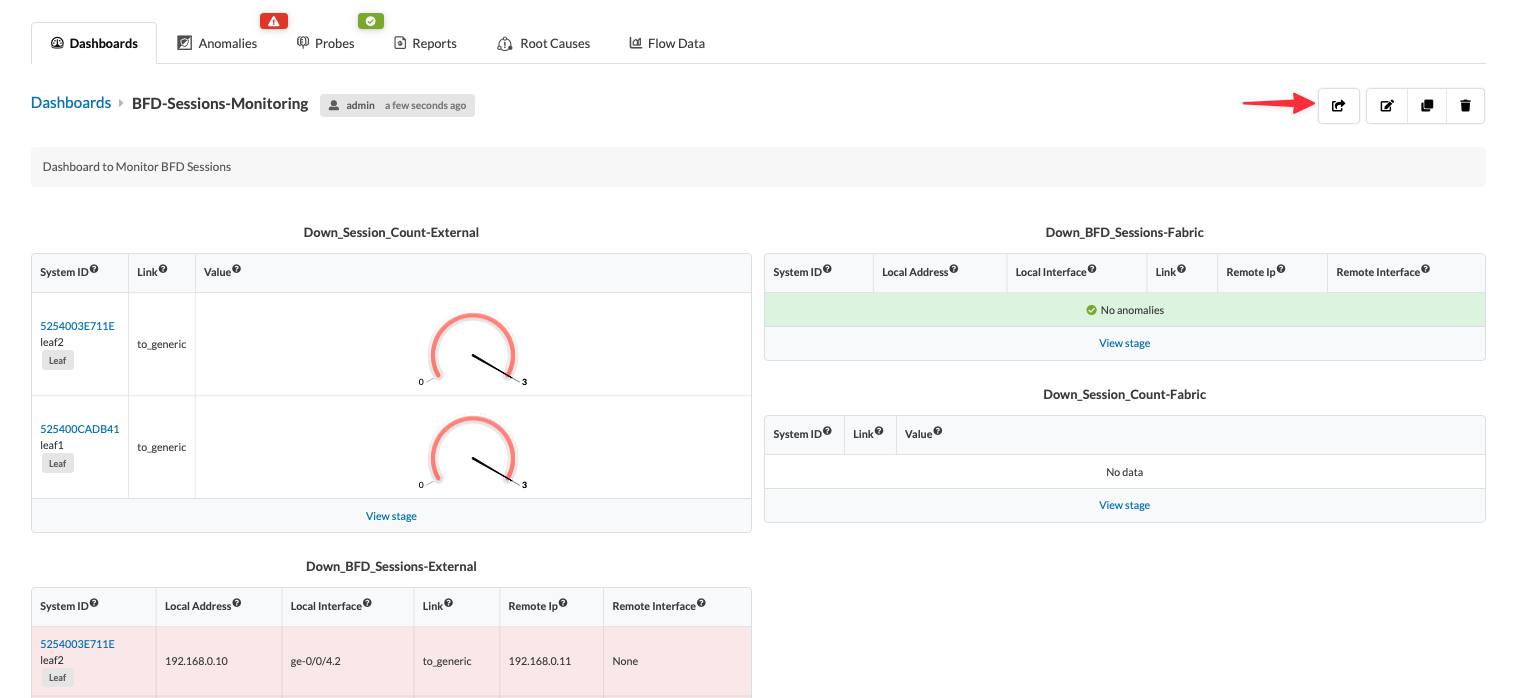
We created dashboard widgets for Down Fabric sessions, Down External BFD sessions and BFD session counts that are down (for both Fabric side sessions and external sessions). . The image below displays the dashboard status, showing downtime in all four quadrants.
Exporting and Importing a Service from the Analytics Dashboard (Recommended)
To export a service from the dashboard:
-
Click the Export icon to open the power monitoring
dashboard,
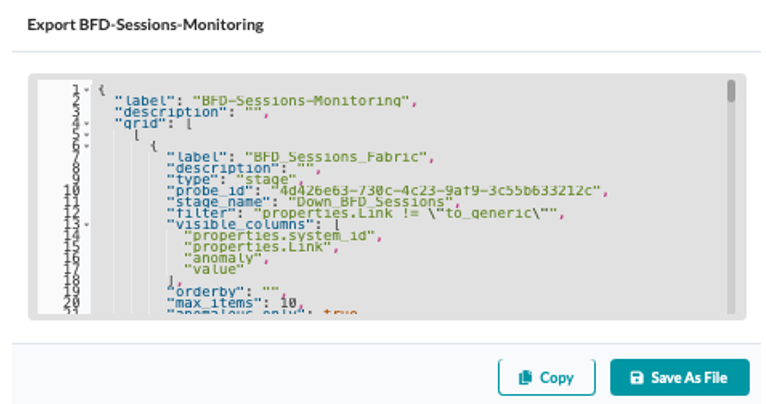
Exporting your dashboard generates a schema with the probe information as shown below.You can import this file to a different instance, if needed.
Continue to the next section Apstra Rest API Explorer to learn how to easily test REST API endpoints.