
Apstra Rest API Explorer
Juniper Apstra REST API Explorer provides a GUI for testing REST API endpoints, eliminating the need for coding expertise. While Apstra IBA probes collect fabric signals, some users might not have GUI access. Developers can retrieve probe results programmatically and integrate these results into:
-
Dashboards
-
Ticketing systems
-
Configuration management databases (CMDBs)
-
Chat platforms
-
Reports
REST API Explorer helps discover and test endpoints live within a blueprint without disrupting the network. This tool acts as a live playbook for executing requests and receiving responses.
To launch Apstra REST API Explorer:
-
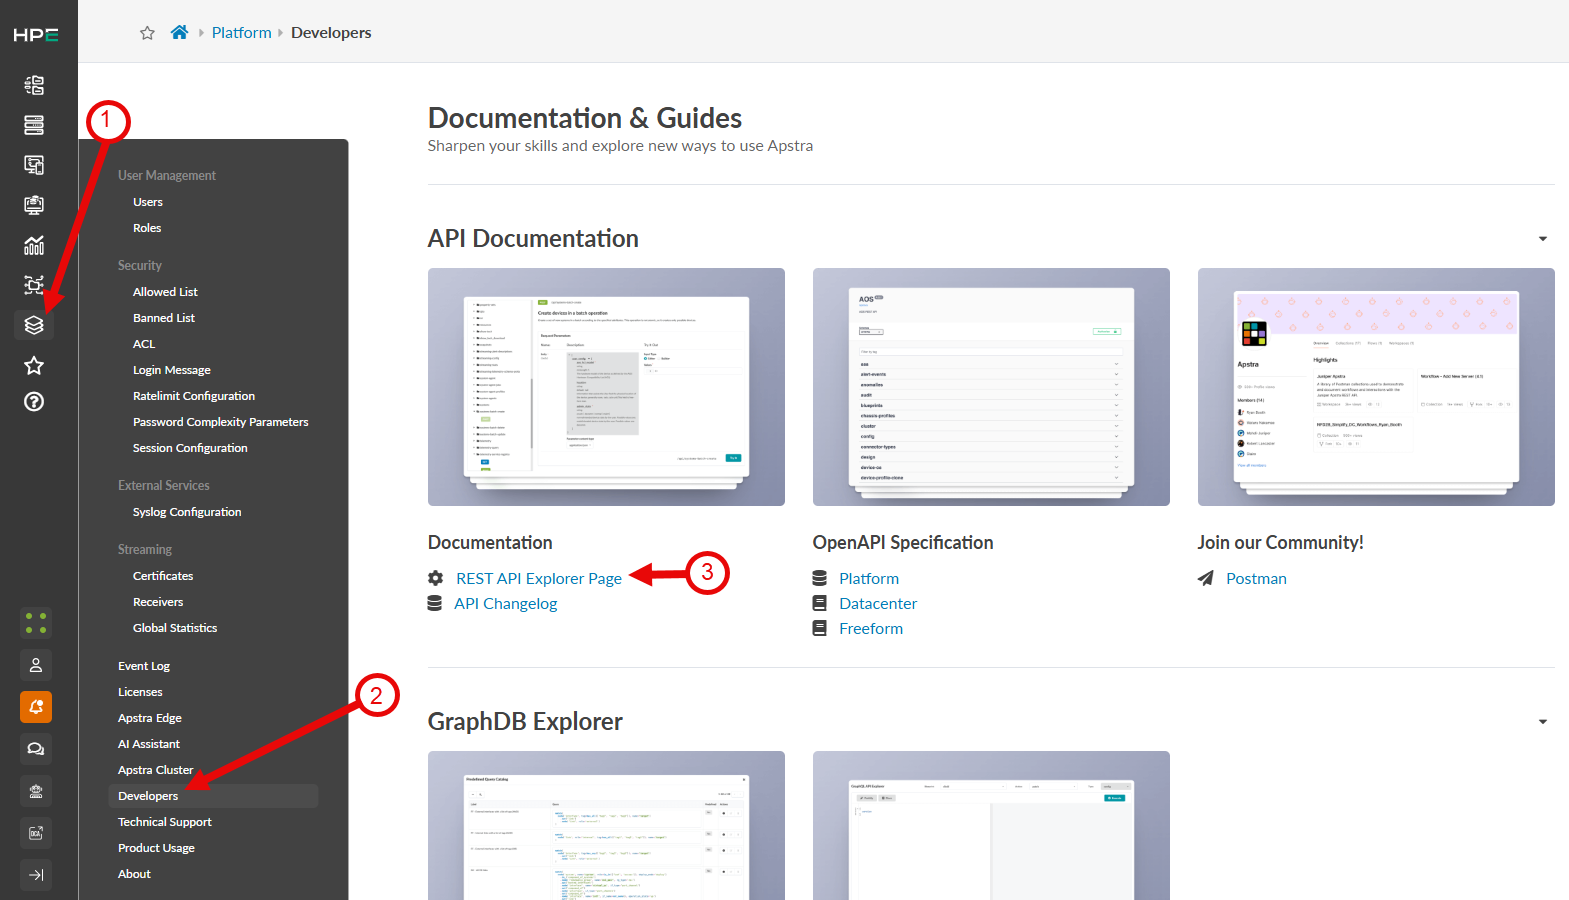
From the Apstra GUI, navigate to Platform > Developers and
click the REST API Explorer Page link.
-
Enter the keyword
queryto filter the API endpoints.The query API is a POST endpoint that retrieves the status of any probe stage. The query API functions as a POST endpoint that retrieves the status of any probe stage. Entering "query" displays multiple API endpoints in across folders, which makes it unclear to users which one to select. The "query" API supports audit events, probes, and metricdb. Because endpoints span multiple folders, we need to apply a filter to retrieve the results for the analytic processors we created in the Probe section for BFD running on our blueprint. See: Create an IBA Probe and Processor.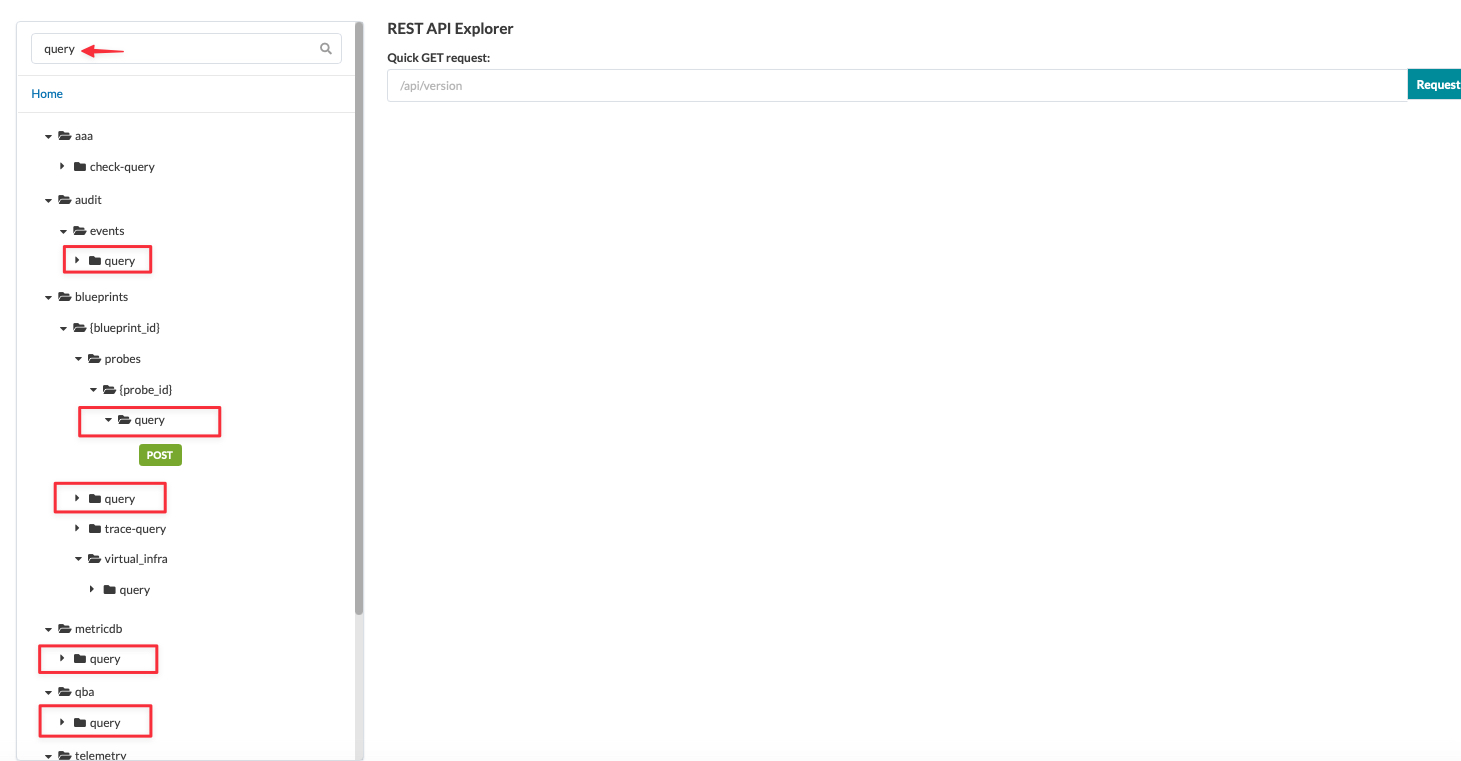
-
Enter the keyword probe in the search field.
The "probe" keyword filter generates results across multiple API endpoints. We are focusing on "query" endpoints under the blueprint level to locate an endpoint. This specific endpoint functions as the "query" API for all probes. Use this hierarchy to find the endpoint: blueprints > {blueprint_id} > probes {probe_id} > query (POST)
The "query" API POST endpoint retrieves a probe stage's status. This endpoint includes two parameters: Request Parameters and Response Parameters. The Request Parameter defines the request schema and consists of the URI (URL path) and body. Note that not all endpoints have a body, but this POST endpoint does.
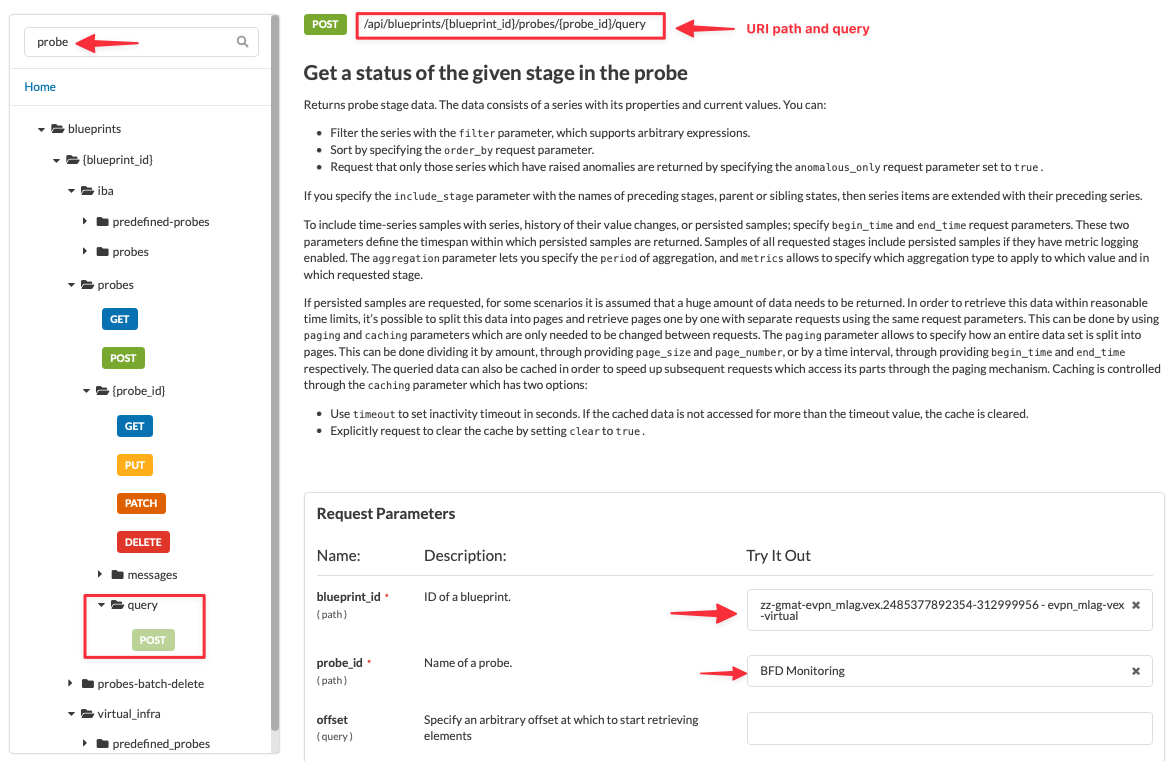
The following table describes the Request Parameters.
Table 1: Request Parameters Descriptions Request Parameter Description URI Contains the path and query. The path specifies the host URL and identifies the resource, using blueprint_IDandprobe_id.blueprint_IDAutomatically resolves the blueprint_idlabel to an ID. This field is mandatory.probe_IDAutomatically resolves the probe_idlabel to an ID. This field is mandatory.offset,page,per-page(Optional) Query parameters included in the URI text. body Second part of the request parameter in the POST API. Includes the "stage"(mandatory) and optional fields. The"stage"field specifies the status of a stage in a probe. -
Navigate back to Blueprints > Analytics > Probes and select
your probe. From the output stage Down_BFD_Sessions, check the
Anomalies Only box to generate the output for
Down_BFD_Sessions.
The image below shows six entries. The Value column indicates that the Anomaly value is set to
true. In REST API explorer, we entered the same query by setting the body value toAnomalous_only: true.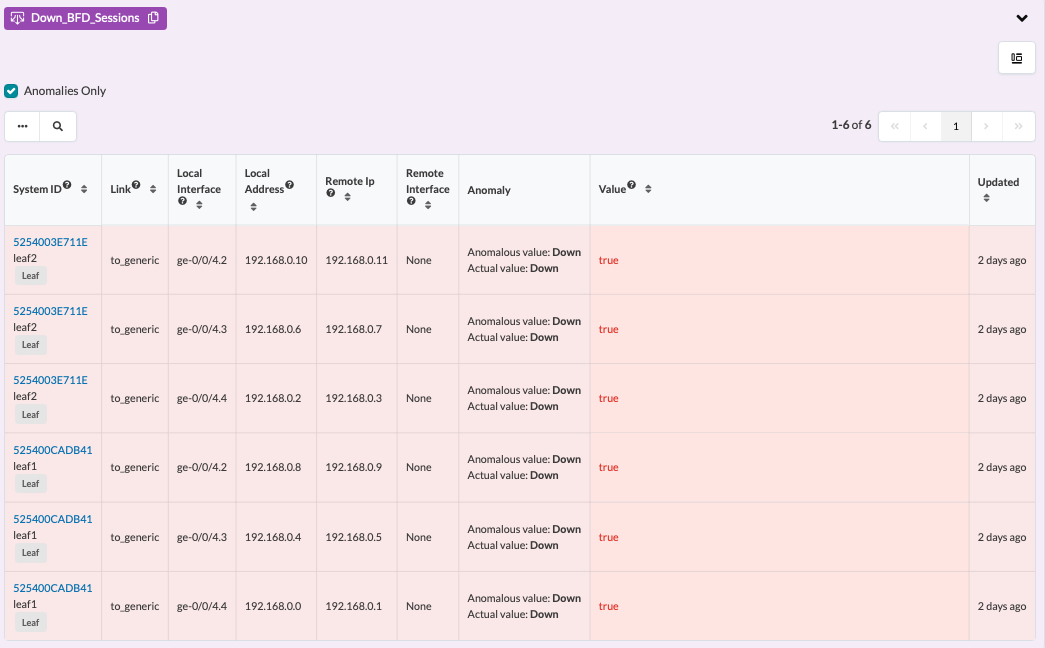
The API query response includes a code 200, confirming that the system accepted the request and provided a response. The image below summarizes the response, structuring it as a dictionary containing seven items, including description and type.
This dictionary contains a list of six items and details six neighbors that are down. Each item includes another dictionary with four items that describe the timestamp, value, and ID. The anomaly status is set totrue, matching with the filter applied in the API query(anomalous_only: true). These four items contain a nested dictionary with six properties:system_id,Remote_IP,Link,Local_address,Local_Interface, andRemote_Interface, along with their respective values.The response provides details about the six BFD sessions where the anomaly value is
true, confirming that these six neighbors are down.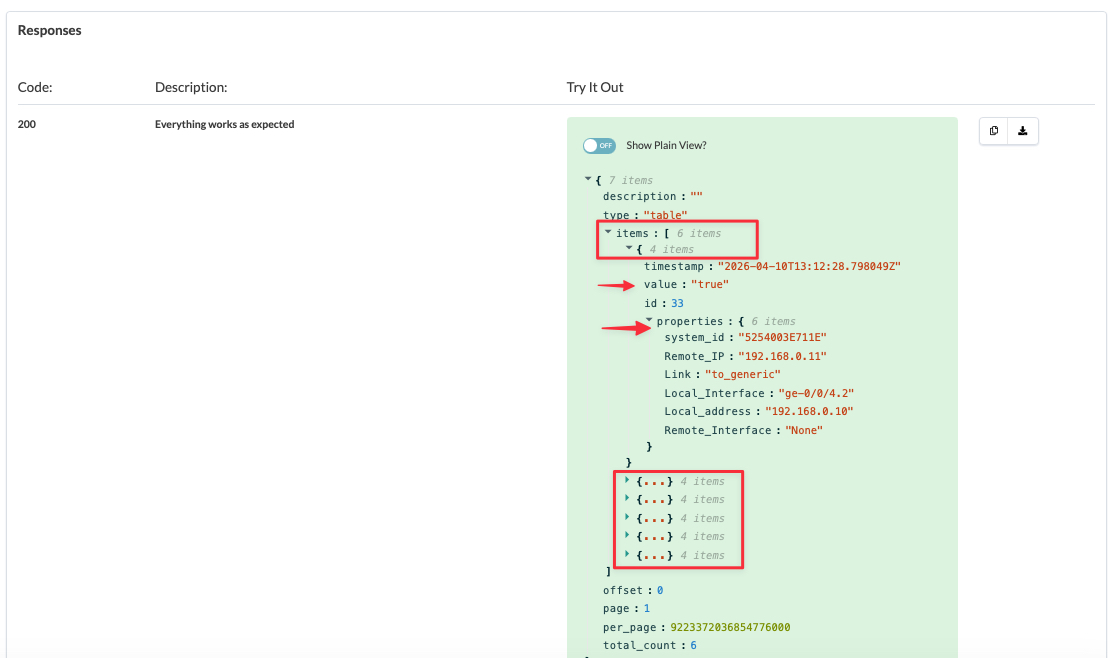
The API query response lists the "value" key. The "value"
key holds the Boolean value "true" in six occurrences. The properties
provide details on all six BFD sessions that are down.
{
  "description": "",
  "type": "table",
  "items": [
    {
      "timestamp": "2026-03-23T06:52:29.309211Z",
      "value": "true",
      "id": 33,
      "properties": {
        "system_id": "5254003E711E",
        "Remote_IP": "192.168.0.11",
        "Link": "to_generic",
        "Local_Address": "192.168.0.10",
        "Local_interface": "ge-0/0/4.2",
        "Remote_interface": "None"
      }
    },
    {
      "timestamp": "2026-03-23T06:52:29.309241Z",
      "value": "true",
      "id": 34,
      "properties": {
        "system_id": "525400CADB41",
        "Remote_IP": "192.168.0.9",
        "Link": "to_generic",
        "Local_Address": "192.168.0.8",
        "Local_interface": "ge-0/0/4.2",
        "Remote_interface": "None"
      }
    },
    {
      "timestamp": "2026-03-23T06:52:29.309264Z",
      "value": "true",
      "id": 35,
      "properties": {
        "system_id": "525400CADB41",
        "Remote_IP": "192.168.0.5",
        "Link": "to_generic",
        "Local_Address": "192.168.0.4",
        "Local_interface": "ge-0/0/4.3",
        "Remote_interface": "None"
      }
    },
    {
      "timestamp": "2026-03-23T06:52:29.309284Z",
      "value": "true",
      "id": 36,
      "properties": {
        "system_id": "5254003E711E",
        "Remote_IP": "192.168.0.7",
        "Link": "to_generic",
        "Local_Address": "192.168.0.6",
        "Local_interface": "ge-0/0/4.3",
        "Remote_interface": "None"
      }
    },
    {
      "timestamp": "2026-03-23T06:52:29.309305Z",
      "value": "true",
      "id": 37,
      "properties": {
        "system_id": "5254003E711E",
        "Remote_IP": "192.168.0.3",
        "Link": "to_generic",
        "Local_Address": "192.168.0.2",
        "Local_interface": "ge-0/0/4.4",
        "Remote_interface": "None"
      }
    },
    {
      "timestamp": "2026-03-23T06:52:29.309341Z",
      "value": "true",
      "id": 38,
      "properties": {
        "system_id": "525400CADB41",
        "Remote_IP": "192.168.0.1",
        "Link": "to_generic",
        "Local_Address": "192.168.0.0",
        "Local_interface": "ge-0/0/4.4",
        "Remote_interface": "None"
      }
    }
  ],
  "offset": 0,
  "page": 1,
  "per_page": 9223372036854776000,
  "total_count": 6
}
With this example, we showed how to use the Apstra REST API to retrieve probe output, interpret the response payload, and translate it into an actionable summary. This summary identifies six BFD sessions with a Down ("true") status and their associated properties. The pattern enables teams to automate scheduled reports, integrate the data into ticketing or observability tools, and adopt a repeatable, UI-independent approach to present fabric status to stakeholders.