
Apstra Telemetry and Intent-Based Analytics
Intent-Based Analytics (IBA) extracts knowledge from raw telemetry data, assisting you in monitoring operational status changes in your infrastructure.
IBA Probes
An IBA probe is a real-time analytics pipeline that enables you to set up conditions of interest (situations to monitor). An IBA probe retrieves, processes, and compares data against expectations.
IBA probes:
- Collect telemetry data from managed devices.
- Enrich data with contextual information from the blueprint.
- Process raw data into more meaningful metrics, like averages, state in time, or standard deviation,.
- Raise anomalies when the network deviates from an intended state and streams anomalies as alerts to external systems.
Probes can be predefined or user-defined (custom). Predefined probes are automatically enabled during blueprint deployment, while others can be enabled on-demand from a catalog, as described in the Predefined Probes Catalog.
Telemetry Services
You can view a list of telemetry services that Apstra currently activated in your deployment. Each service represents a unique category of information that Apstra collects from your managed devices. For each telemetry service, Apstra issues various CLI show commands over the device API to ingest data that IBA uses.
To view the available telemetry services, select Analytics > Services.
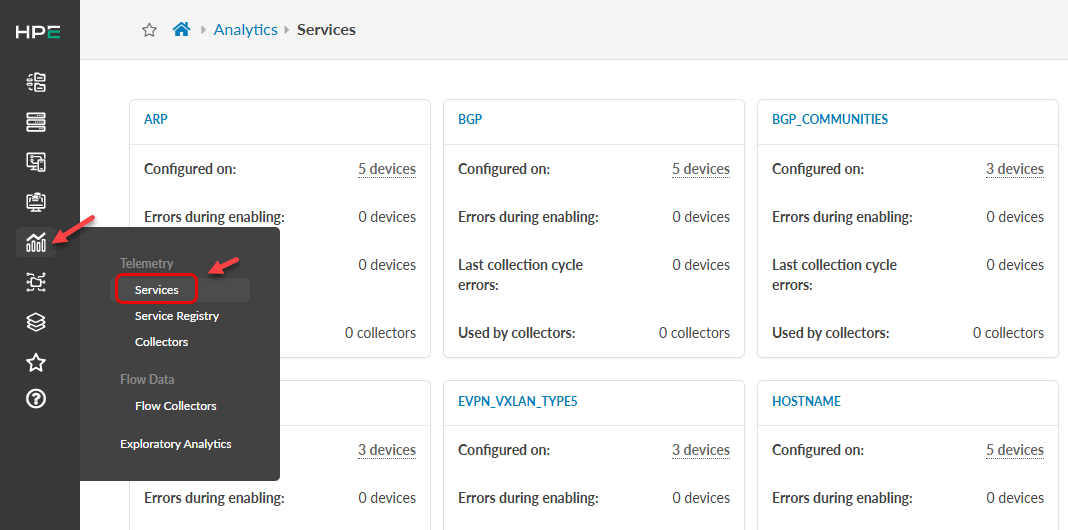
The raw data that Apstra collects are not visible on the Telemetry Services page. The raw data is only shown and visualized in IBA probes.
Auto-Enabled Probes
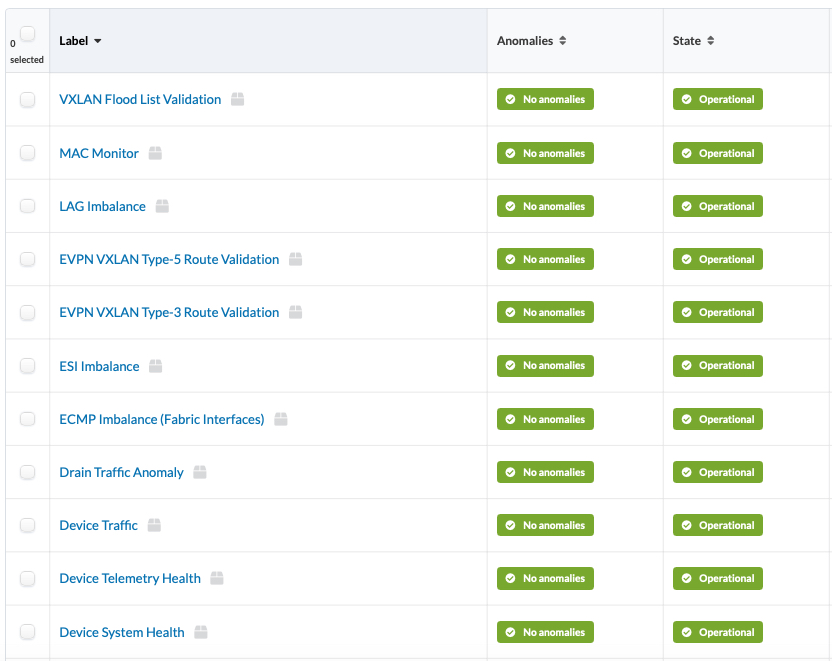
When you deploy a blueprint, several IBA probes are automatically enabled. These probes monitor key fabric information and generate anomalies when the probes detect device health or fabric performance issues.
To view existing probes for your blueprint, click the Probes tab in the Analytics dashboard.
Predefined Probes Catalog
In addition to auto-enabled probes, you can enable predefined probes from a built-in catalog based on your monitoring needs. Some predefined probes, like EVPN or Optical Transceivers, activate additional services to collect and analyze device data.
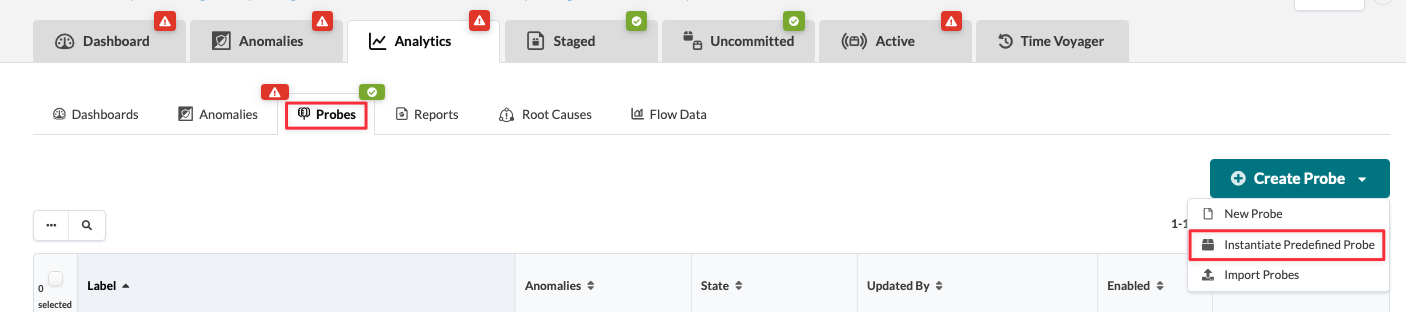
Select Probes in the Analytics dashboard to view the predefined probe types.
From the Create Probe drop-menu, select Instantiate Predefined Probe.
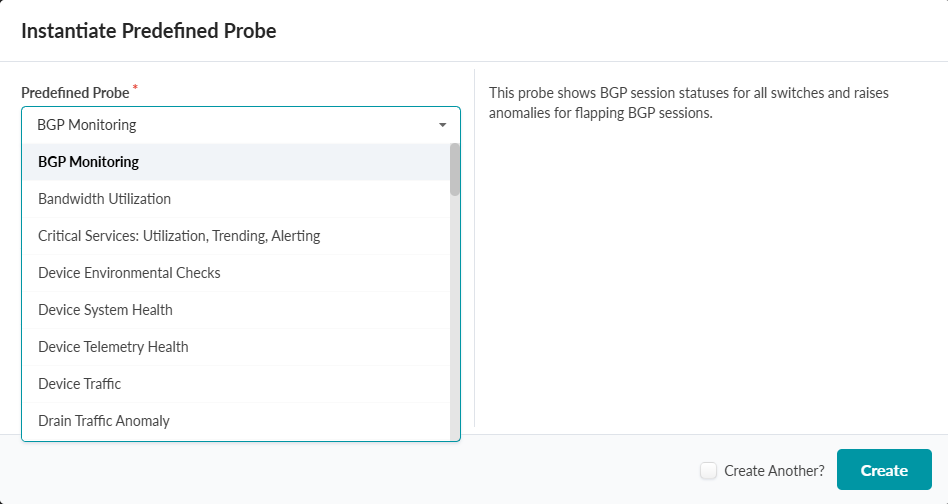
Select a probe and click Create.
For more information about predefined probes, see Predefined Probes in the Juniper Apstra User Guide.
Custom Probes
If the default, predefined, or built-in probes don't meet your monitoring requirements, you can create a custom probe configuration. See Create a Probe for details.
For the probe to be functional, you'll need to add at least one processor. A processor adds data to your probe from an existing telemetry service. A pipeline starts when a processor injects raw data into it. The pipeline then sends the raw data to the processor. For descriptions of the various processors, see Types of Processors.
Custom probes are explained in detail in the Create an IBA Probe and Processor and Create the Dashboards and Widgets sections in this guide.
What If Apstra Doesn’t Collect the Data You're Looking For?
Juniper recommends using the its Apstra Custom Telemetry Collection feature when Apstra lacks the data you need. Continue to Custom Telemetry Collection Overview to start.