Application Discovery
The SSR routing software's value grows to an organization as administrators create and refine application-specific policy for traffic steering and prioritization. The more detail included in the SSR's configuration, the more fine-grained the policies can be, which allows for precision treatment of traffic through the SSR's forwarding plane.
It is very common for network administrators to be largely unaware of the traffic that is traversing their infrastructure, and thus it is important to perform an application discovery process to identify the various types of traffic. Once identified and modeled within the SSR data model, administrators can apply network policy to give that traffic specific treatment.
This document discusses the discovery process, to inform network architects, network engineers, and operational support teams on the best practices for isolating and categorizing network traffic flows.
Discovery Process
The basic workflow for application discovery is typically done as an iterative process, using the following three steps:
- Create coarse configuration for routing large swaths of traffic
- Identify key applications within the coarse configuration
- Create more specific configuration treatment and test
Steps 2 and 3 then repeat themselves in perpetuity throughout the lifecycle of the deployment, as new applications are introduced, retired, or go through their own lifecycle adaptations.
The sections that follow will outline the techniques, tools, and strategies for successfully managing application discovery with the SSR.
Create Coarse Routes
The notion of creating "coarse routes" – that is, broad routes that knowingly convey many different bundled applications – is to set up the SSR to allow for communication between clients and the applications, to have a platform for subsequent analysis. Said another way: if you don't give clients the ability to talk to applications – even before you understand the traffic flows, traffic patterns, and application dependencies – then you will have no traffic to analyze. While this does philosophically subvert the SSR notion of "deny by default," it does establish a structural framework for experimentation.
Initial Bootstrapping
The term initial bootstrapping refers to the basic configuration applied to the SSR to allow it to forward traffic. Generally speaking this entails creating a "default route" (i.e., a service with an address of 0.0.0.0/0, representing all possible IP destinations). The default route is the most primitive of bootstrapping, and is the starting point for virtually every SSR deployment.
The 0.0.0.0/0 service can be removed from configurations once application discovery is "complete," at least to the point where all business-critical applications are accounted for and modeled in the SSR configuration. But it is more customary that this default route remains in place, for "local internet breakout" at branch locations, or is sent to a third party security stack (such as ZScaler or Palo Alto's Prisma) for IDS/IPS, Anti-virus scanning, etc.
Conceptually, it is convenient to think of the traffic traversing the SSR as a pie chart; the 0.0.0.0/0 route represents the "other" (unspecified) category. Our job is to break that category into a series of more specific definitions.
In most deployments there will be various applications that are known a priori, especially if those applications are delivered as part of a managed service offering driving the network transformation. For example, an SD-WAN deployment with a Managed Service Provider that is delivering voice service will know the details of the voice application. Thus, instead of starting with a single 0.0.0.0/0 service, we can add a voice service.
When deploying voice and data SD-WAN solutions, it is commonly the case to have a very simple initial bootstrapping design with two services.
Some companies have compiled application lists without explicitly realizing it; firewall or router ACLs that mark packets for placement onto an MPLS network is not only a great starting point for which applications are in use, but also which ones need prioritization.
Identify Key Applications
The most fruitful approach to application discovery is to begin with the key applications – the mission-critical traffic that traverses the network. Sometimes a customer will know their key applications by name: "we use Citrix for VDI between our branch office and data center." Sometimes, they'll describe their key applications with no technical underpinning ("it's crucial for our retail store to be able to process credit card transactions, look up inventory, and make phone calls").
No matter how it is described, the process is the same: we need to piece together the information on what those applications do on a network, with as much specificity as possible.
Proactive vs. Reactive Discovery
Working with a customer at the outset of the project to define their applications is proactive discovery. The more upfront work that can be done during a lab evaluation, proof-of-concept deployment, or pilot rollout, the higher the likelihood for success. Proactive application discovery is generally a learning process for the network architect, to see firsthand (in many cases for the first time) the sheer number of different flows traversing their network.
Reactive discovery, performed once the SSR deployment is live, occurs as a response to end-user criticism. Comments such as "the intranet site is slow," or "I can't complete a point of sale transaction while I'm running inventory reports" are breadcrumbs into the aspects of the service definitions and service policies that need refinement.
In most SSR deployments, the lion's share of the discovery is reactive; this is not by design, but usually by circumstance. Because the proactive discovery process is typically done in antiseptic lab environments, or when traffic is isolated to a small number of devices under test, the interactions between applications are not easily identified.
(And we all know that end users are always able to find configuration bugs that no amount of lab testing ever could.)
Exit the lab evaluation/POC with a firm understanding of the top five key applications in use at the customer site, and have them modeled.
Establishing a Lab Environment
Whether doing proactive or reactive discovery, a lab where traffic can be analyzed is critical. The closer your lab gets to faithfully reproducing your production environment, the more efficient the discovery process will be.
Beyond just having a representative facsimile of your production network, there are some important tips for positioning yourself for success:
- For each network tenant at your branch location, create a subtenant with prefix
lab. For example, if you have tenants for point-of-sale (pos), voice (voip), and guest wi-fi (guest), create tenants namedlab.pos,lab.voip, andlab.guest. Specify these tenants on your lab system in place of where you'd typically specify the top-level versions (i.e., putlab.poson the VLAN you'd normally putposon, etc.). This will allow your lab system to behave identically to a pilot/production system, since access-policy will be "inherited" from parent to child. But it will make it significantly easier to sift through the data to find sessions created by thelab.children. - During application discovery, it is advantageous to limit your egress WAN options to as few as possible (ideally one). One of the primary tools during application discovery is PCAP traces. With only one WAN option it will reduce the amount of time searching for the egress packet flow toward the application server(s).
Establish a lab that lets you isolate traffic as best as is practical, so that individual transactions can be scrutinized.
Pertinent Application Data
With an end goal of creating specific service configuration elements for the various applications, we will need to identify the relevant attributes of the traffic to build that data model. For each application (service), we will want to collect the following information:
- A name (identifier) for the service. This should be chosen so as to be easily identifiable by the network operations team, systems integrator, and the end customer.
- Protocol. Typically either TCP or UDP (and sometimes both).
- Address(es). Represented as an IPv4 CIDR (up to and including a /32), an IPv6 CIDR, or an FQDN.
- Destination port(s). Ranges are acceptable.
Try to define the service as concisely as possible, but always bear in mind that there will be opportunities for refinement in the future. It is better to be more broad with IP addresses and port ranges than it is to miss some. (Things can get weird and difficult to troubleshoot if some but not all of your application traffic hits a service, but other flows use the default route.)
Tools of the Trade
The SSR software has a number of built-in tools to help faciliate the application discovery workflow. In general, these are used in conjunction to provide multiple proof points.
SSR's Session Table
The SSR maintains a list of all active sessions for all traffic it is forwarding, and makes that available to administrators via the PCLI command show sessions and in the GUI in the Sessions view. Much of the data identified in the Pertinent Application Data section is available in the Session Table.
If you have set the tenancy of your lab system using the technique mentioned in the Establishing a Lab Environment section, it becomes easy to filter the session table using grep, as in:
admin@labsystem1.fiedler# show sessions router newton | grep lab.guest
This shows the active sessions for the lab.guest tenant. Each of the session table entries will include the destination IP address, port, and protocol. This is quick and easy when dealing with long-lived sessions. However, if you have very short-lived sessions (particularly if there are short-lived application dependencies like DNS transactions) then it is easy to miss them by only monitoring the show sessions table, since the session table entries are torn down after observing a TCP socket close or based on protocol-specific timers. While this is a good initial port of call, it should not be the only tool used for this reason.
Packet Capture
Each device-interface within the SSR allows for packet capture using the Berkeley Packet Filter (BPF) syntax familiar to users of the Wireshark application. During discovery, and particularly if you've limited your egress route to one specific interface, applying a packet capture filter to that egress device-interface (even a broad filter such as len>0) lets you capture the traffic for postmortem analysis. Unlike session table entries, which are transient and will be created and destroyed as traffic flows through the system, this provides a permanent record for the traffic sent from that system. The PCAP file, located on the SSR's filesystem within /var/log/128technology/128T_interfaceName.pcap, can be copied off and dissected using Wireshark, tcpdump, etc.
Working through packet captures is an involved process, but will provide unequivocal evidence of the applications your devices are consuming, as well as all dependencies. Filtering the PCAP file to a single Device Under Test (DUT) will show all traffic to and from that device.
Copy off capture files periodically and label them with the tests performed. This can become a sort of permanent record of the sunny day behavior of the applications, as tested.
DNS-based Packet Capture
A variant on the packet-capture technique described previously is to apply a filter on the SSR to only capture DNS transactions. Since DNS is generally a prerequisite for all network transactions, capturing DNS will typically give a deep insight into the locations that LAN-side clients are accessing, with the added benefit that the names are human readable.
Apply a capture-filter on the LAN-side device-interface, and set the filter to udp port 53. Because DNS transactions are small (two packets), and because they are infrequent, this filter can be left in place for a long time before the capture file is harvested.
After running tests, retrieve the file from the system for post-processing. We have had success using the dnsanon tool to extract the contents of a PCAP file into a text file containing the DNS queries. The dnsanon tool can be found at https://ant.isi.edu/software/dnsanon/.
The dnsanon tool is open source software and is not supported. Use at your own risk.
Install dnsanon onto a SSR using the following commands:
sudo dnf copr enable johnh/dnsanon
sudo dnf copr enable johnh/libtrace
sudo dnf install dnsanon
Once installed, you can invoke the dnsanon application passing your capture file as an argument (in this example, the capture file is named 128T_LAN.pcap):
dnsanon -i 128T_LAN.pcap -c none -f 128T -p q
This will create a file named 128T.question.fsdb, which contains all of the hostnames that clients requested during the capture period.
SSR's Built-in Application Identification
The SSR networking platform can passively observe information exchanged during TLS connections and scrape application information from server-side X.509 certificates. This is done by setting the application-identification on a given router to use mode tls. Below is a configuration excerpt:
admin@labsystem1.fiedler# show config running auth router newton application-identification

config

    authority

        router  newton
            name                        newton

            application-identification
                mode  tls
            exit
        exit
    exit
exit
With this configuration in place, the router will harvest the Common Name information from X.509 certificates as they traverse the SSR, and provide access to them via the show application names PCLI command as well as within the GUI.
While this is the easiest technique to employ for application identification, it is limited to only work with services that leverage TLS.
IPFIX
Internet Protocol Flow Information Export, or IPFIX, is an IETF protocol for that standardizes the way networking equipment reports on the flows it processes, for billing, management, accounting, etc. The SSR supports IPFIX, and it is possible to leverage IPFIX records to investigate traffic traversing an SSR.
Below is a configuration fragment that shows a representative sample on how to set up an IPFIX collector. (Consult with your IPFIX collector documentation to understand which ports and protocols it uses, as these can vary from vendor to vendor.)
admin@labsystem1.fiedler# show config running authority ipfix-collector lab

config

    authority

        ipfix-collector  lab
            name                 lab
            ip-address           192.168.1.200
            port                 4739
            protocol             tcp
            sampling-percentage  100
            tenant               lab.pos
        exit
    exit
exit
The sampling-percentage of 100 should only be used when dealing with small traffic volumes. The impact of IPFIX traffic processing at scale can overwhelm the SSR as well as your IPFIX infrastructure. This is a key reason why the lab.pos (etc.) tenancy structure is critical for success, as it will limit your collection to the specific DUT.
Once the IPFIX collector is confirmed up and operational and harvesting records supplied by the SSR, run through lab testing to collect information. Like packet captures, this provides conclusive evidence of all traffic flows observed by the SSR.
Filter the traffic to the lab. tenant to avoid a deluge of unnecessary traffic, and to be able to ratchet the sampling-percentage to 100.
IPFIX Field Formats
The Juniper IPFIX PEN (Private Enterprise Number) is 45956.
Standard Fields
| Field | ID |
|---|---|
| Octet Delta | 1 |
| Packet Delta | 2 |
| Protocol | 4 |
| Source Port | 7 |
| Source IPV4 | 8 |
| Ingress Interface | 10 |
| Destination Port | 11 |
| Destination IPV4 | 12 |
| Egress Interface | 14 |
| Ingress Interface VLAN ID | 58 |
| Egress Interface VLAN ID | 59 |
| Interface Name (Ingress) | 82 |
| First Packet Flow Timestamp | 152 |
| Last Packet Flow Timestamp | 153 |
| Selector Name | 335 |
The standard fields for Ingress Interface VLAN ID, Egress Interface VLAN ID, First Packet Flow Timestamp, and Last Packet Flow Timestamp have been added to the following software streams:
- 5.6.x: Beginning with 5.6.8
- 6.1.x: Beginning with 6.1.2
Vendor Specific Fields
| Field | ID | Type | Description |
|---|---|---|---|
| Record Type | 1 | uint16 | Whether this is an End or Interim record |
| Session Type | 6 | string | The type of session |
| Start Time | 7 | uint32 | The time when the session was initiated (seconds since epoch) |
| End Time | 8 | uint32 | The time when the session was exported (seconds since epoch) |
| Total Bytes | 9 | uint64 | Total bytes sent |
| Total Packets | 10 | uint64 | Total packets sent |
| TCP Retransmissions | 11 | uint64 | Total TCP retransmissions (0 if UDP) |
| Service Name | 12 | string | The name of the associated service |
| Service Class | 13 | string | The name of the associated service class |
| Session ID | 14 | string | The ID of the session as bytes (substitute for uint128) |
| Service Group | 15 | string | The service group being consumed |
| Tenant | 16 | string | The name of the associated tenant |
| Router Name | 17 | string | The name of the exporting router |
Audit Logging
The SSR also has a facility for recording all traffic flows as part of its audit log functionality. Enabled on a per-router basis, the traffic logs will show all connections that are established and rejected for every source address.
To configure the audit logging on a router:
admin@labsystem1.fiedler# conf auth router newton system audit traffic enabled true
*admin@labsystem1.fiedler# show config candidate auth router newton system audit traffic

config

    authority

        router  newton
            name    newton

            system

                audit

                    traffic
                        enabled  true
                    exit
                exit
            exit
        exit
    exit
exit
On busy systems, this will generate a lot of logging. Be advised that turning this feature on for busy production sites may have a performance impact.
To retrieve the logs, connect to the SSR's GUI (either the conductor or directly on the router), navigate to the router's page and click Event History. At the top of the page, click the Export button, which will prompt you to save the file to your local machine as either text or JSON.
The file will contain entries similar to the following:
2020-01-22T15:44:37.958Z router="newton" node="labsystem2" type="TRAFFIC" source_port="4506" source_address="192.168.1.249" permitted="true" collector_id="highway" node="labsystem2" destination_address="86.240.200.128" destination_port="16424" ip_protocol="tcp"
2020-01-22T15:44:36.616Z router="newton" node="labsystem2" type="TRAFFIC" source_port="14767" source_address="192.168.1.241" permitted="true" collector_id="highway" node="labsystem2" destination_address="1.0.0.1" destination_port="53" ip_protocol="udp"
2020-01-22T15:44:36.615Z router="newton" node="labsystem2" type="TRAFFIC" source_port="55548" source_address="192.168.1.204" permitted="true" collector_id="highway" node="labsystem2" destination_address="14.37.99.12" destination_port="443" ip_protocol="tcp"
2020-01-22T15:44:35.492Z router="newton" node="labsystem2" type="TRAFFIC" source_port="5353" source_address="192.168.1.88" permitted="false" denied_reason="access" ip_protocol="udp" collector_id="highway" node="labsystem2" destination_address="224.0.0.251" destination_port="5353"
This can be scripted, filtered, imported into Excel, etc. to glean information pertinent to the DUT.
Run iterations of tests, pull down the audit logs, and label the files to indicate which activities are captured within the logs.
Dropped Packets
Akin to the audit logging capabilities of the SSR, Dropped Packets, a GUI only feature, can be helpful to identify those sessions that are not established due to the current policy configured on the SSR. After logging into the SSR platform, navigate to the router under discovery. From there, navigate to the Debug page which can be found on the right hand side of the page. The debug page provides access to some of the same information available in the PCLI - show fib, show sessions, etc. Select the right-most tab for Dropped Packets.
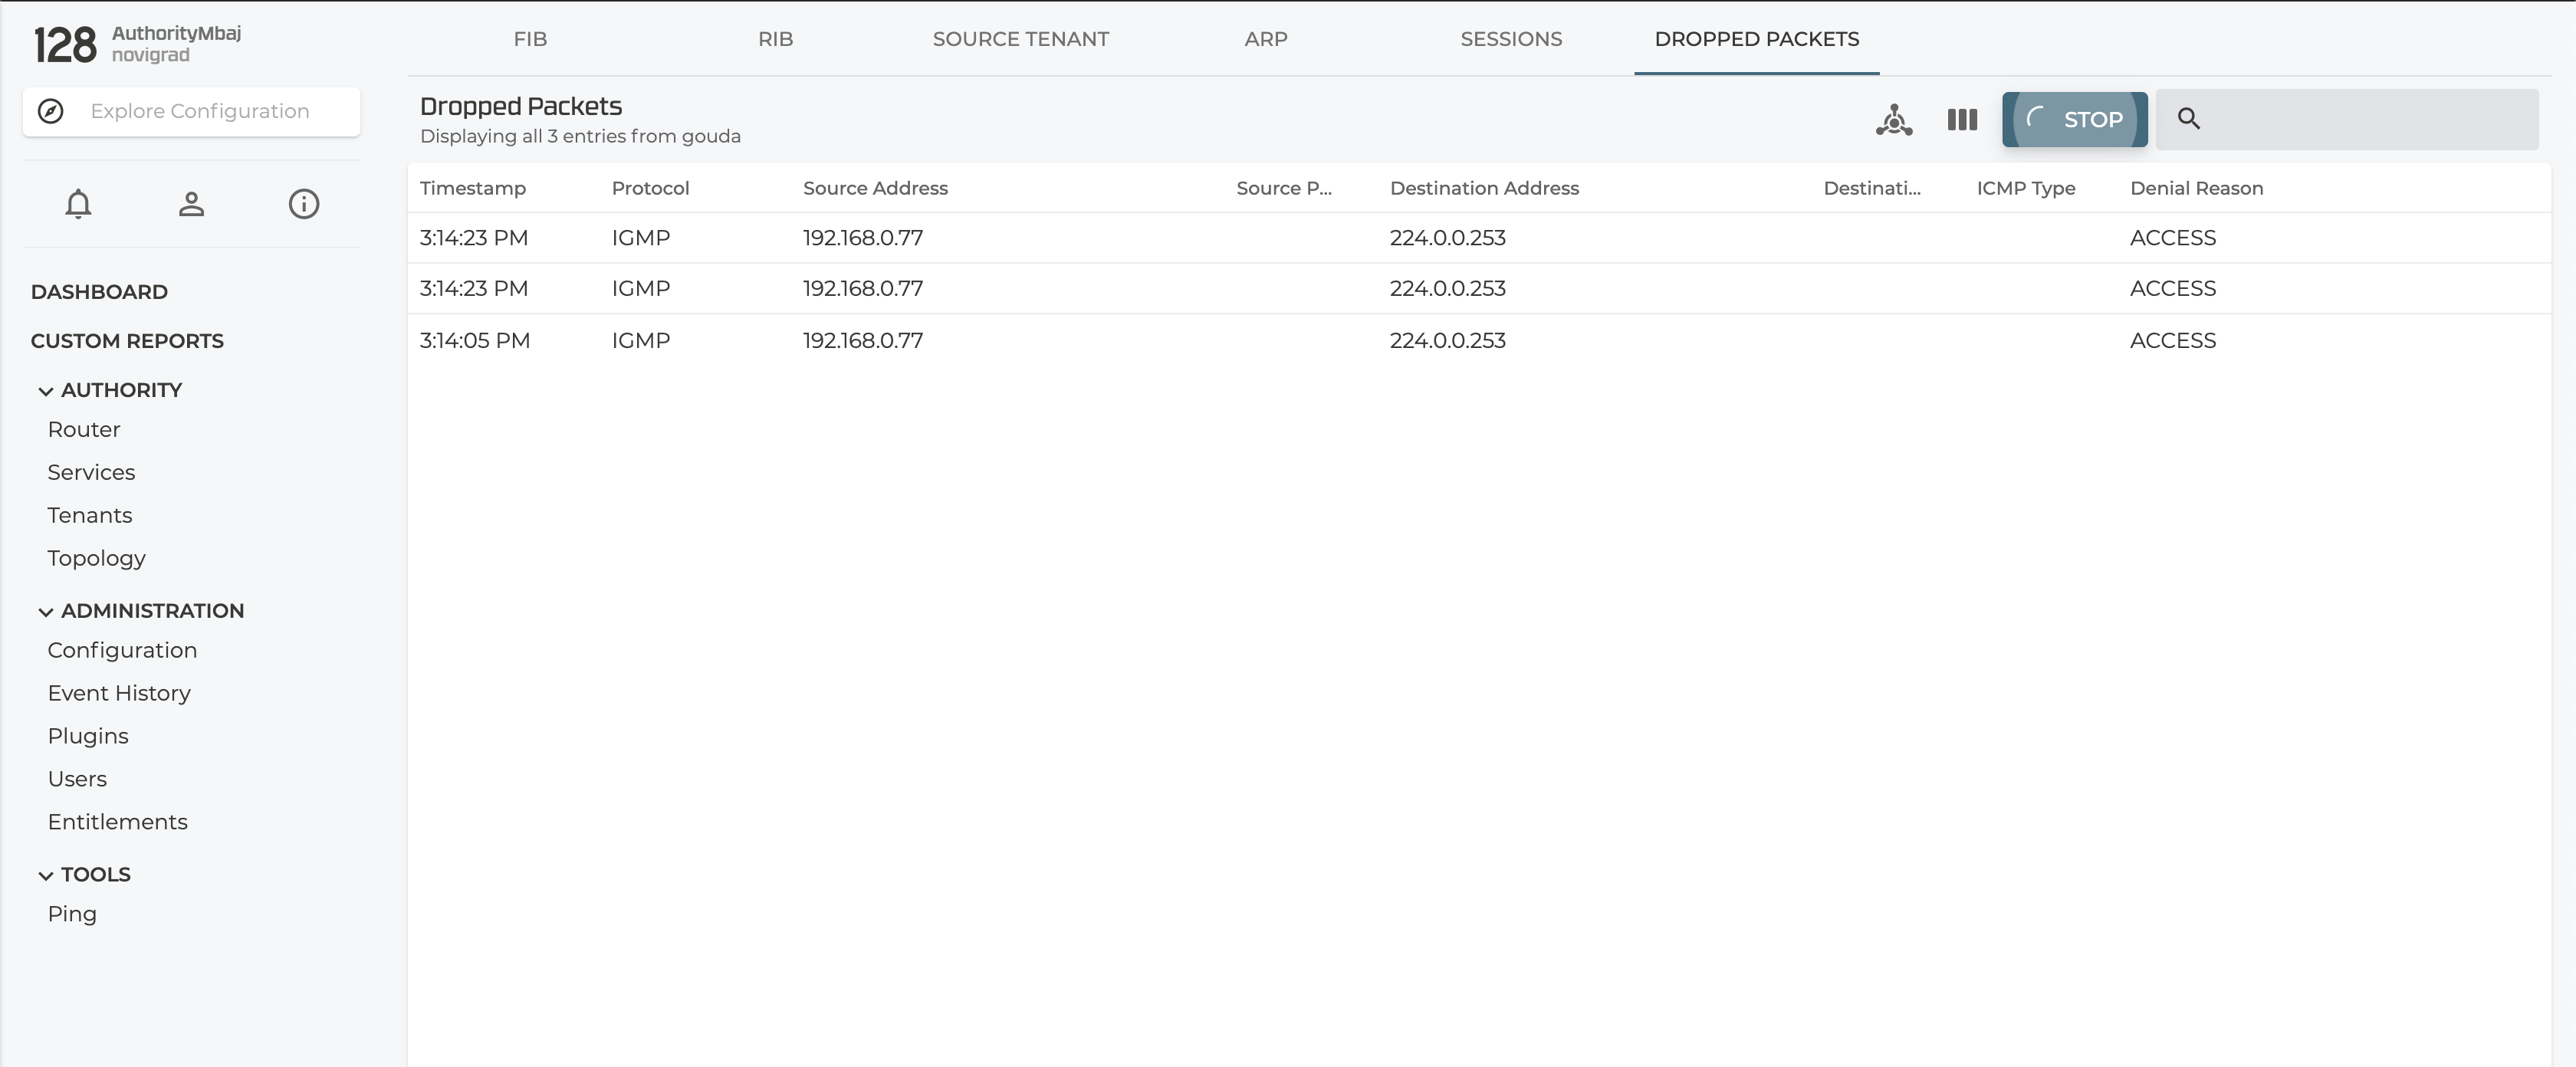
Any session that fails to be established, that is, it ingresses on an interface but never egresses, will be shown in this table. The tool will indicate the reasons for why the session was not established. Most of the time this is due to a service that is too restrictive.
Much like the other features, enabling the discovery of dropped packets comes at a cost to packet processing performance, so use it in a controlled fashion. In order to start discovering if any sessions are failing to be established, click the CAPTURE button to start. Navigating away from this page or clicking STOP will end the troubleshooting session, while leaving the captured packets on the screen.
Expand your current policies or service definitions to include IP destinations or ports that may have been excluded from your service configuration after identifying them with this tool.
Application Dependencies
Application dependencies are prerequisites that must be satisfied before an application transaction is successful. Most applications are dependent on DNS, for example – successfully resolving a domain name is a prerequisite for sending a HTTPS request to a web site on the internet. But application dependencies can take all forms; some applications require a separate authentication transaction to a AAA server, some web sites need to transact to back end database servers, etc.
While much of the application discovery process is focused on a client in a branch location accessing applications at a corporate data center or on the internet, creating a dependency map will not only help design the SSR configuration in an effective manner, it will greatly benefit post-deployment troubleshooting when the application is not performant or functioning properly. (E.g., if a point of sale device needs to authenticate to an LDAP server in one data center, but transact with back-end inventory management servers in another data center, it will be vital knowledge when troubleshooting a customer report with the POS.)
Create Specific Configuration and Test
Once you've identified candidates to peel out of the broader service definition, create more specific services for each of them. During discovery, set the access-policy on the service to specify the lab. versions of your tenants, to avoid any impact to production traffic until your discovery process is complete. Because service definitions are global within an authority by default, it may also be important to specifically isolate the service to the lab device under test and whichever head end system(s) that service needs to traverse. This is done through the applies-to field within the service definition. Doing this mitigates the risk of the new service definition hijacking production traffic on other devices managed by the same conductor.
Once the service definitions have been committed, re-execute the same tests and validate that the new service is being leveraged; you can follow the same methodology during verification as you did during discovery, but this time the exercise should be simpler (typically just looking at the output of show sessions is enough, since you can quickly identify the appearance of any new services in the list using grep).
Documenting the Results
Now that the service has been identified properly, we can assign the appropriate policy to it. While design of service policy is beyond the scope of this guide, it is important to document the policy to assist in troubleshooting and knowledge transfer.
We recommend documenting services with the following attributes, at a minimum:
- Name
- Address range
- Protocol and port(s)
- DSCP markings
- Interface prioritization
- Associated
service-policy - Dependencies (related services or protocols)
- Notes, including references to packet captures or audit logs, lessons learned, etc.
Pushing the Services into Production
Once you're satisfied with your changes, schedule time to push the changes into production using your change control process. The recommended best practice is to:
- Make a backup of your current configuration. (You always start with that step, right?)
- Augment the existing
lab.access-policy statements with their non-lab counterparts. E.g., if you tested your guest network services usinglab.guest, addguestto the access-policy list. We recommend keeping both thelab.and "vanilla" versions of the tenants in place for some time, to facilitate rollback. - Remove/replace the
applies-tolist on the service, to expand the scope to include non-lab sites. This can be to roll the change out to the entire authority, to a select set of pilot sites, etc. - Commit the change, and test/monitor to ensure everything is working satisfactorily.
- Schedule a follow-up maintenance event to remove the
lab.policy statements once everything is confirmed to be working as expected. (For minor changes this can be done during the same maintenance window as item 1, for more involved sets of changes this should be done after the new changes have soaked.) - Ensure service documentation is updated and distributed to all stakeholders.