Monitor SRX Series Firewalls in CSDS Groups
Monitor the performance of your SRX Series Firewalls and customize the Monitor page to track various device parameters.
After the Connected Security Distributed Services (CSDS) groups are created, you can monitor the performance statistics of your SRX Series Firewalls. The Monitor page is designed to be highly customizable, allowing you to tailor it to your specific needs by adding various tabs and widgets that can track a range of metrics and parameters.
To access this page, click .
The Monitor page comes with default tabs for Dashboard, Resources, Device Interfaces, IPsec Tunnels, NAT Rules, NAT Pools, and Security Policies. These tabs have fixed widgets that cannot be modified. However, you can create additional tabs and add specific widgets to suit your monitoring requirements. For more information about managing tabs and widgets, see Manage Tabs and Widgets. The Dashboard tab cannot be deleted, while other default tabs can be deleted but cannot be restored once removed.
Use the manual refresh icon ![]() at the top-right corner of the page to update the widget data
for the tabs.
at the top-right corner of the page to update the widget data
for the tabs.
Dashboard
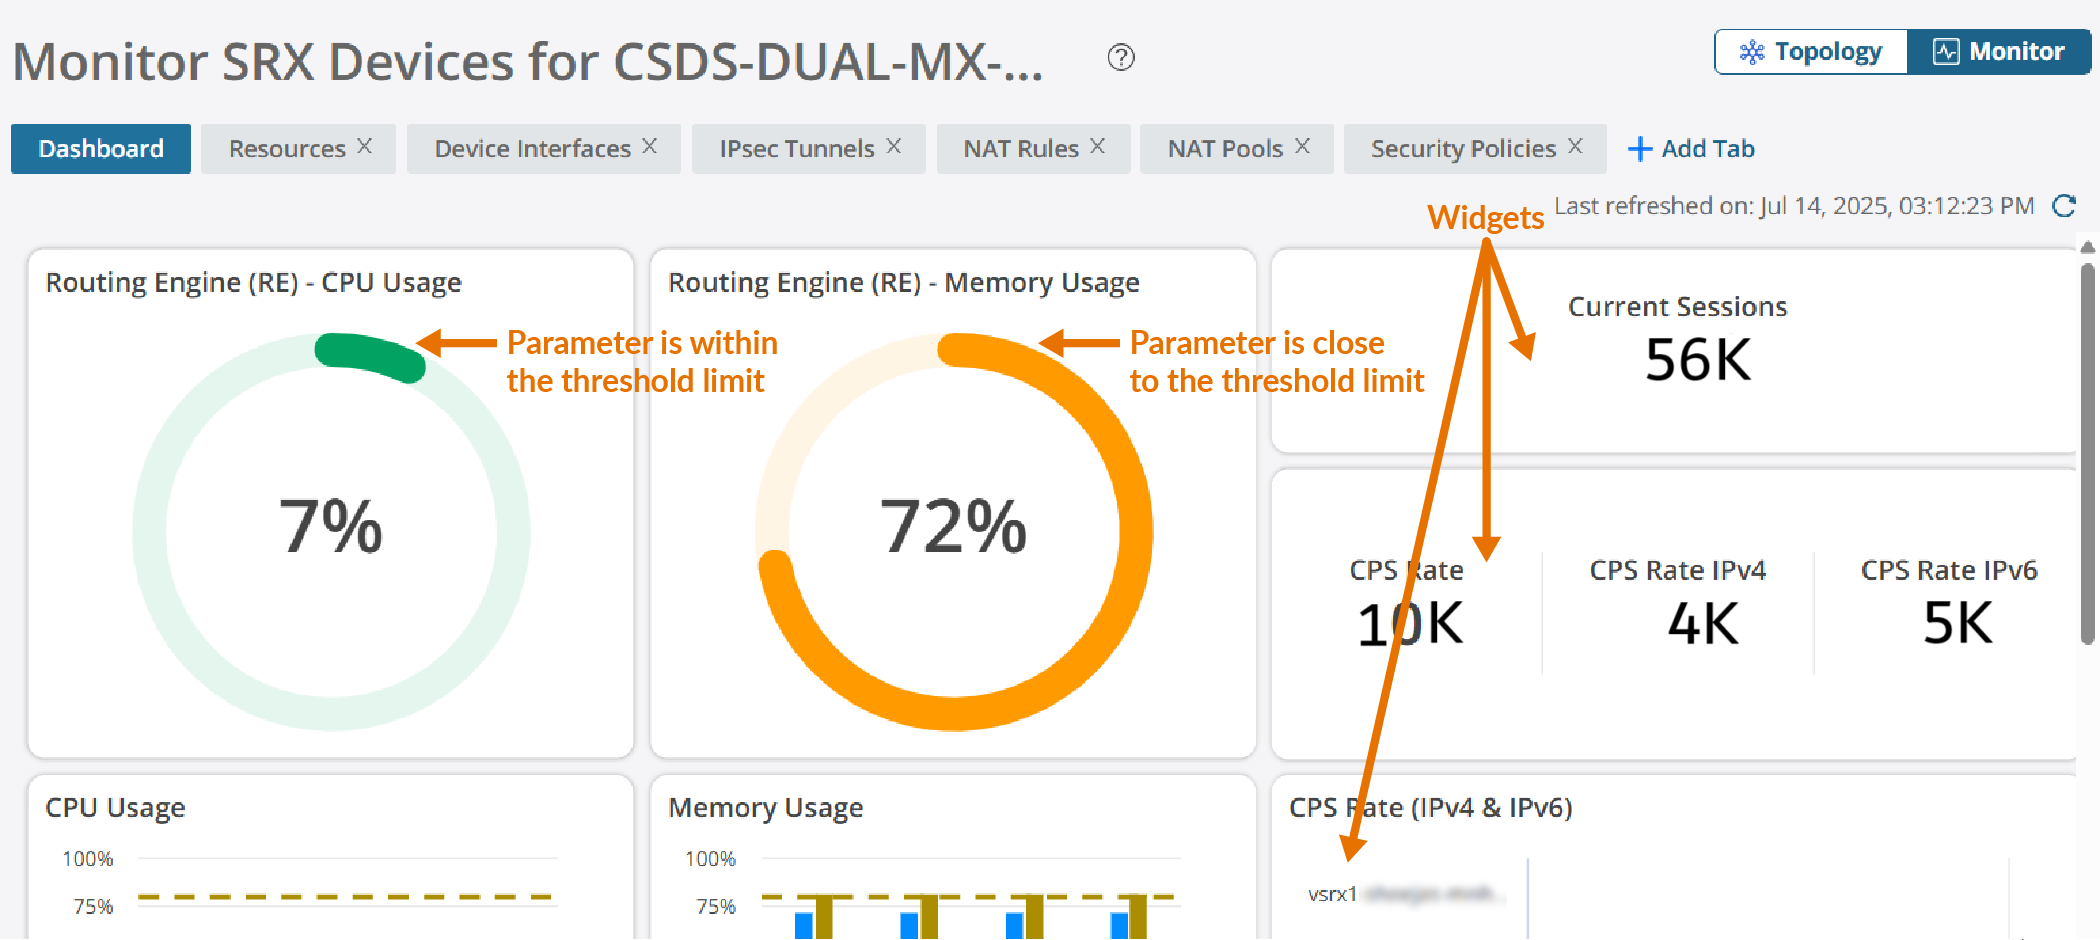
Dashboard tab offers a comprehensive overview of the performance metrics for the devices within the group. The tab shows widgets for Routing Engine (RE), Service Processing Unit (SPU), current flow sessions, connections, packets, bits, and other device statistics.
Table 1 describes widgets under the Dashboard tab.
| Widgets | Description |
|---|---|
| Routing Engine (RE) - CPU Usage | The average CPU usage of RE for all SRX Series Firewalls in a CSDS
group. By default, the threshold value is set to 80 percent. The widget displays different colors based on the parameter value:
|
| Routing Engine (RE) - Memory Usage | The average memory usage of RE for all SRX Series Firewalls in a CSDS
group. By default, the threshold value is set to 80 percent. The widget displays different colors based on the parameter value:
|
| Current Sessions | The total number of current flow sessions for all SRX Series Firewalls in a CSDS group |
| CPS Rate | The total number of CPS for all SRX Series Firewalls in a CSDS group |
| CPS Rate IPv4 | The total number of IPv4 CPS for all SRX Series Firewalls in a CSDS group |
| CPS Rate IPv6 | The total number of IPv6 CPS for all SRX Series Firewalls in a CSDS group |
| CPU Usage | Percentage of RE and SPU CPU used by each SRX Series Firewall |
| Memory Usage | Percentage of RE and SPU memory resources used by each SRX Series Firewall |
| CPS Rate (IPv4 & IPv6) | The total number of IPv4 and IPv6 CPS for each SRX Series Firewall |
| Packets Per Second (PPS) | The total number of packets received and transmitted by the SRX Series Firewalls in a second |
| Bits Per Second (bps) | The speed at which data is received and transmitted by the SRX Series Firewall interfaces |
| Device Statistics | Summary of device level statistics |
If more than ten devices are added to the CSDS group, the widgets will display statistics for only the top ten devices based on the RE CPU utilization. To view statistics for all the devices, click View all at the bottom of the widgets.
Resources
Resources tab displays indicators relevant to the devices within the group. You can track the performance of SRX Series Firewalls against the predefined values of parameters. The resources metrics measure and evaluate the network's performance, quality, and reliability. These metrics help identify potential issues, enabling proactive management and optimization of network performance.
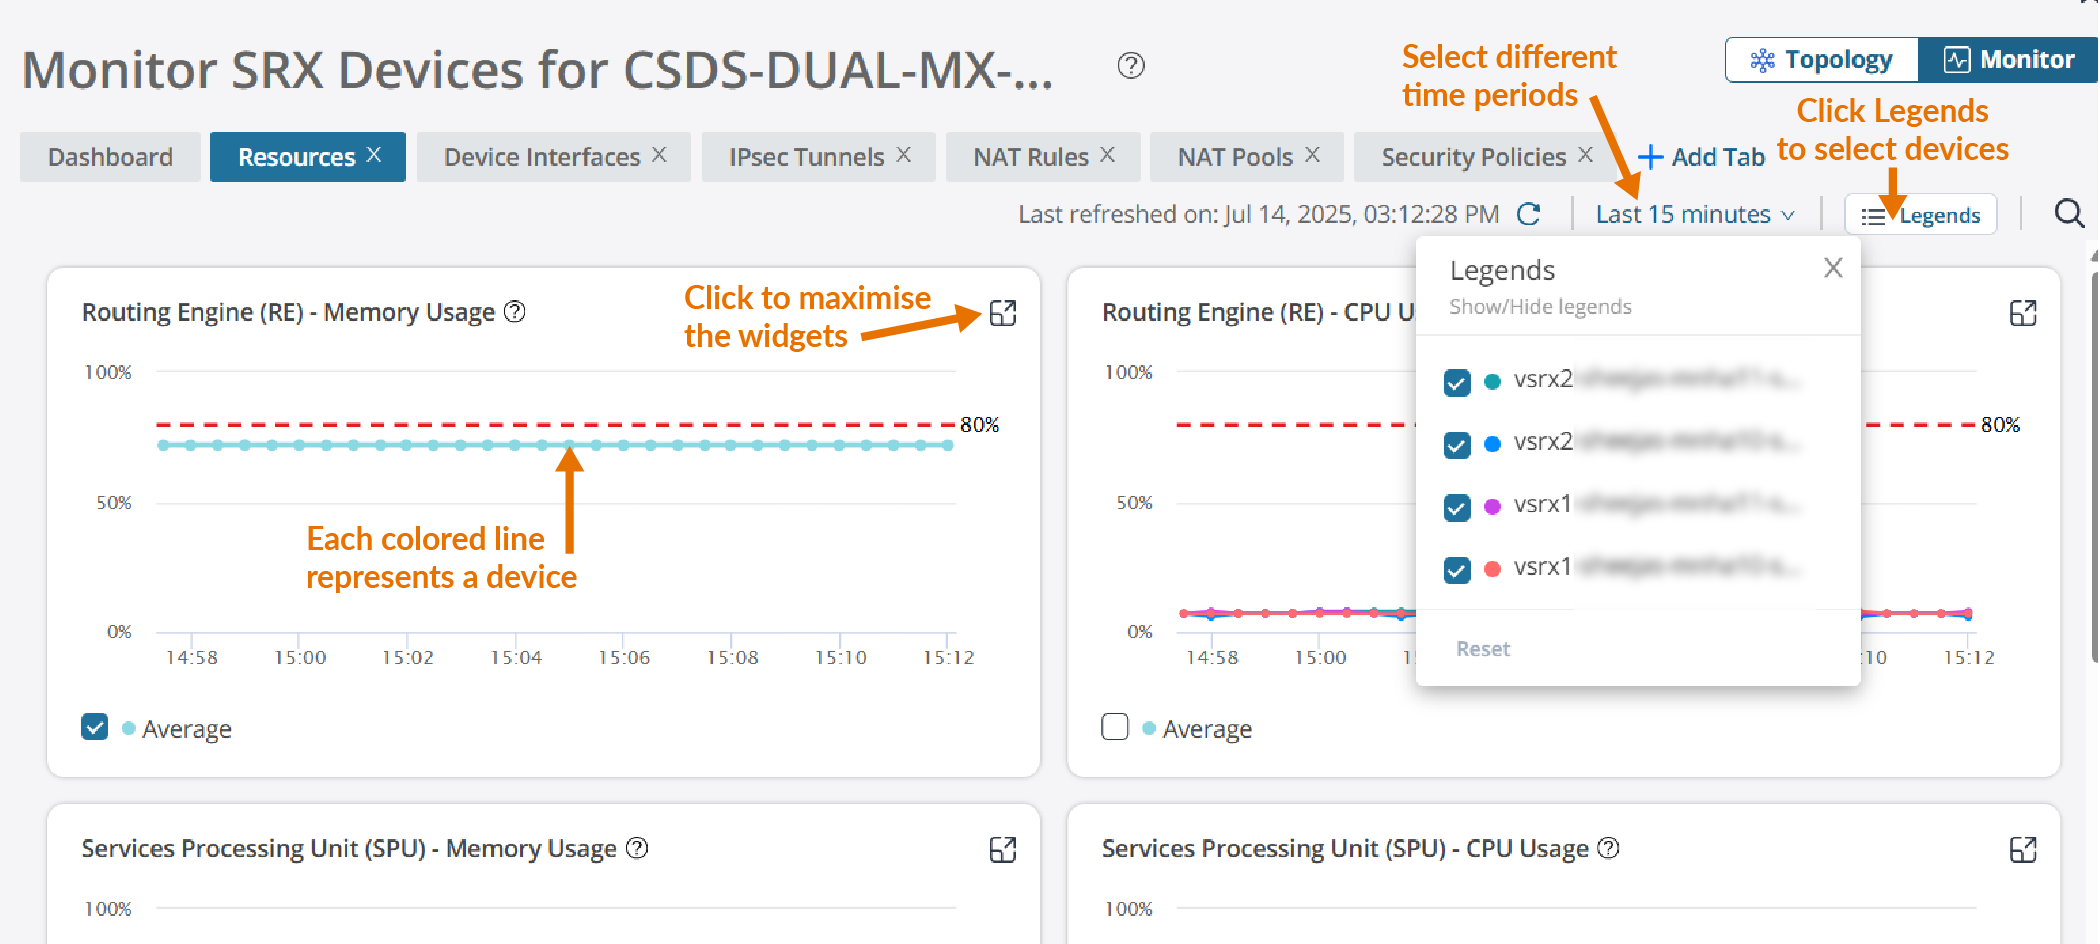
You can view widgets for different time periods by selecting one of the following options:
-
Last 15 minutes
-
Last 1 hour
-
Last 4 hours
-
Last 12 hours
-
Last 1 day
-
Last 1 week
-
Last 2 weeks
-
Custom—Select a specific time range that suits your needs Click Ok.
Table 2 describes widgets under the Resources tab.
| Widget | Description |
|---|---|
| Routing Engine (RE) - Memory Usage | The average and per-device memory usage of RE across all SRX Series
Firewalls. To view the average value, select Average check box. |
| Routing Engine (RE) - CPU Usage | The average and per-device CPU usage of RE across all SRX Series
Firewalls. To view the average value, select Average check box. |
| Service Processing Unit (SPU) - Memory Usage | The average and per-device memory usage of SPU across all SRX Series
Firewalls. To view the average value, select Average check box. |
| Service Processing Unit (SPU) - CPU Usage | The average and per-device CPU usage of SPU across all SRX Series
Firewalls. To view the average value, select Average check box. |
| CPS Rate | The total, average, and per-device CPS across all SRS Series
Firewalls. To view the total value, select Sum check box. To view the average value, select Average check box. |
| CPS Rate IPv4 | The total, average, and per-device IPv4 CPS across all SRS Series
Firewalls. To view the total value, select Sum check box. To view the average value, select Average check box. |
| CPS Rate IPv6 | The total, average, and per-device IPv6 CPS across all SRS Series
Firewalls. To view the total value, select Sum check box. To view the average value, select Average check box. |
| Current Sessions | The total, average, and per-device count of current flow sessions across
all SRX Series Firewalls. To view the total value, select Sum check box. To view the average value, select Average check box. |
| Current Sessions IPv4 | The total, average, and per-device count of current IPv4 sessions across
all SRX Series Firewalls To view the total value, select Sum check box. To view the average value, select Average check box. |
| Current Sessions IPv6 | The total, average, and per-device count of current IPv6 sessions across
all SRX Series Firewalls To view the total value, select Sum check box. To view the average value, select Average check box. |
Device Interfaces
The Device Interfaces tab provides comprehensive details about the interfaces of each device within the group. You can monitor the status, performance, and other relevant metrics of the device interfaces. The device interface widgets helps you to visualize and analyze the status and utilization of your network devices.
Table 3 describes widgets under the Device Interfaces tab.
| Widget | Description |
|---|---|
| Packets per second (PPS) In | The total, average, and per-device PPS received by the SRX Series Firewalls |
| Packets per second (PPS) Out | The total, average, and per-device PPS transmitted by the SRX Series Firewalls |
| Bits Per Second (bps) In | The total, average, and per-device bps received by the SRX Series Firewalls |
| Bits Per Second (bps) Out | The total, average, and per-device bps transmitted by the SRX Series Firewalls |
| Octets In | The total, average, and per-device count of octets received by the SRX Series Firewalls |
| Octets Out | The total, average, and per-device count of octets transmitted by the SRX Series Firewalls |
| Unicast packets In | The total, average, and per-device count of unicast packets received by the SRX Series Firewalls |
| Unicast packets Out | The total, average, and per-device count of unicast packets transmitted by the SRX Series Firewalls |
In the Device Interfaces tab, you can view widgets for different time periods by selecting one of the following options:
-
Last 15 minutes
-
Last 1 hour
-
Last 4 hours
-
Last 12 hours
-
Last 1 day
-
Last 1 week
-
Last 2 weeks
-
Custom—Select a specific time range that suits your needs Click Ok.
IPsec Tunnels
An IPsec tunnel is a secure communication channel established between two endpoints using the Internet Key Exchange (IKE) protocol along with either the Encapsulating Security Payload (ESP) or Authentication Header (AH) protocol. IPsec tunnels are configured to encrypt and decrypt traffic between the devices. IPsec Tunnels tab provides statistics about the status and performance of IPsec tunnels, which are crucial for secure communication between different network segments.
We recommend you install the Junos-IKE package on the SRX Series Firewall. Use CLI
command request system software add optional://junos-ike.tgz to install
the package.
Table 4 describes widgets under the IPsec Tunnels tab.
| Widget | Description |
|---|---|
| Number of IKE Tunnels | The total, average, and per-device count of IKE tunnels established across all SRX Series Firewalls |
| Number of IPsec Tunnels | The total, average, and per-device count of IPsec tunnels established across all SRX Series Firewalls |
| Number of Replay Errors | The total, average, and per-device count of replay errors across all SRX Series Firewalls |
| Number of Authentication Header Failures | The total, average, and per-device count of AH failures across all SRX Series Firewalls |
| Number of ESP Authentication Failures | The total, average, and per-device count of ESP authentication failures across all SRX Series Firewalls |
| Number of ESP Decryption Errors | The total, average, and per-device count of ESP decryption errors across all SRX Series Firewalls |
| Number of Bad Headers | The total, average, and per-device count of bad headers across all SRX Series Firewalls |
| Number of Bad Trailers | The total, average, and per-device count of bad trailers across all SRX Series Firewalls |
| Number of Invalid SPI Packets | The total, average, and per-device count of invalid Security Parameter Index (SPI) packets across all SRX Series Firewalls |
| Number of TS Check Failures | The total, average, and per-device count of Traffic Selector (TS) check failures across all SRX Series Firewalls. |
| Number of Discarded Packets | The total, average, and per-device count of discarded packets across all SRX Series Firewalls |
| Number of packets that exceeds the tunnel MTU | The total, average, and per-device count of packets that exceed the tunnel Maximum Transmission Unit (MTU) across all SRX Series Firewalls |
In the IPsec Tunnels tab, you can view widgets for different time periods by selecting one of the following options:
-
Last 1 hour
-
Last 4 hours
-
Last 12 hours
-
Last 1 day
-
Last 1 week
-
Last 2 weeks
-
Custom—Select a specific time range that suits your needs Click Ok.
NAT Rules
Network Address Translation (NAT) is a technique used to modify or translate network address information in packet headers. It can involve changing the source address, destination address, or both in a packet. NAT also allows for the translation of port numbers alongside IP addresses. NAT rules help manage and optimize network traffic by mapping one IP address to another, allowing multiple devices to share a single public IP address.
Table 5 describes widgets under the NAT Rules tab.
| Widget | Description |
|---|---|
| Total NAT Rule Sessions Across Devices | The total, average, and per-device count of NAT rule sessions across all
SRX Series Firewalls. This widget provides following information:
|
| NAT Rule Sessions for <NAT Rule Name> (<Type>) | The total, average, and per-device count of NAT rule sessions across
all SRX Series Firewalls for the selected rule. To view the total value, select Sum check box. To view the average value, select Average check box. |
In the NAT Rules tab, you can view widgets for different time periods by selecting one of the following options:
-
Last 1 hour
-
Last 4 hours
-
Last 12 hours
-
Last 1 day
-
Last 1 week
-
Last 2 weeks
-
Custom—Select a specific time range that suits your needs Click Ok.
NAT Pools
NAT pools are used to manage and allocate IP addresses for NAT operations. These pools are essential for configuring source and destination NAT, allowing multiple internal IP addresses to be mapped to a smaller set of external IP addresses
Table 6 describes widgets under the NAT Pools tab.
| Tab | Widget | Description |
|---|---|---|
| NAT Pool Hits | Total NAT Pool Hits Across Devices | The total, average, and per-device count of NAT pool hits across all SRX
Series Firewalls. This widget provides following information:
|
| NAT Pool Hits for <NAT pool name> (<Type>) | The total, average, and per-device count of NAT pool hits across all SRX
Series Firewalls for the selected pool To view the total value, select Sum check box. To view the average value, select Average check box. |
|
| NAT Source Pool Utilization | Total NAT Source Pool Utilization Across Devices | The average and per-device percentages of NAT source pool utilization
across all SRX Series Firewalls. This widget provides following information:
|
| NAT Source Pool Utilization for <NAT pool name> | The average and per-device percentages of NAT source pool utilization
across all SRX Series Firewalls for the selected pool. To view the average value, select Average check box. |
In the NAT Pools tab, you can view the widgets for different time periods by selecting one of the following options:
-
Last 1 hour
-
Last 4 hours
-
Last 12 hours
-
Last 1 day
-
Last 1 week
-
Last 2 weeks
-
Custom—Select a specific time range that suits your needs Click Ok.
Security Policies
Security policies are sets of statements that control network traffic between specified source and destination zones using specified services or applications. These policies determine whether traffic is permitted, denied, rejected, or otherwise handled as it passes through the SRX Series Firewall.
The Security Policies tab displays the total, average, and per-device count of security rule hits across all SRX Series Firewalls.
Table 7 describes widgets under the Security Policies tab.
| Widget | Description |
|---|---|
| Total Security Rule Hits Across Devices | Number of times security rules have been matched by traffic across
multiple devices. This widget provides following information:
|
| Security Rule Hits for <Rule Name> | The total, average, and per-device count of security rule hits across
all SRX Series Firewalls for the selected security rule. To view the total value, select Sum check box. To view the average value, select Average check box. |
In the Security Policies tab, you can view widgets for different time periods by selecting one of the following options:
-
Last 1 day
-
Last 1 week
-
Last 2 weeks
-
Custom—Select a specific time range that suits your needs Click Ok.
Manage Tabs and Widgets
To add a new tab:
Click . The Monitor page is displayed.
Click + Add tab.
Enter a name for the new tab.
The name should be a string of maximum 20 characters. The string can contain alphanumeric characters, spaces, and special characters such as colons, hyphens, periods, and underscores.
Press Enter
A new tab is created.
To add widgets to a tab:
Click Add Widgets.
The list of widgets is displayed.
Select widgets for the tab. You can also search for the widgets you need from the widgets list.
You can select widgets from the following combination of sections:
Resources and Device Interfaces
IPsec Tunnels and NAT
Security Policies
Click OK.
The selected widgets are added to the tab to monitor the SRX Series Firewalls.
To delete a tab:
Click X next to the tab name.
A pop-up window is displayed to confirm the deletion.
Click Yes.
The tab is deleted.
To remove a widget from a custom tab:
Click Widgets at the top-right corner of the page.
The list of widgets is displayed.
Clear the widgets for the tab from the widgets list.
Click OK.
The widgets are removed from the tab.
You can switch between the Monitor and Topology pages. Click Topology at the top-right corner of the page to view the topology of the CSDS group. For more information about topology, see View CSDS Groups Topology.