ON THIS PAGE
View CSDS Groups Topology
View the topology of your CSDS groups and the connection between the devices within the groups.
The View Topology page provides a comprehensive visual representation and detailed information about the topology and characteristics of the Connected Security Distributed Services (CSDS) groups that you have configured. This page is designed to help you monitor and manage the various components of your network by offering insights into several key aspects.
You can access specific details regarding the devices and device interfaces within your network. You can see whether any parameters have exceeded the threshold limits, which could indicate potential issues or areas that require attention. The status of each device and device interface is clearly displayed, allowing you to quickly determine the operational health of your network components.
The device interface link and the device will be displayed in red if their status is down or any of their parameters have exceed the threshold limits. This visual representation is designed to help you promptly identify and address any problems, ensuring that your network maintains optimal performance and security.
To access this page and view details about the devices and the device interfaces, click .
Device
You can view the device details such as the model name, management status, Routing Engine (RE) parameters, and Service Processing Unit (SPU) parameters. See Figure 1 for basic information about the device.
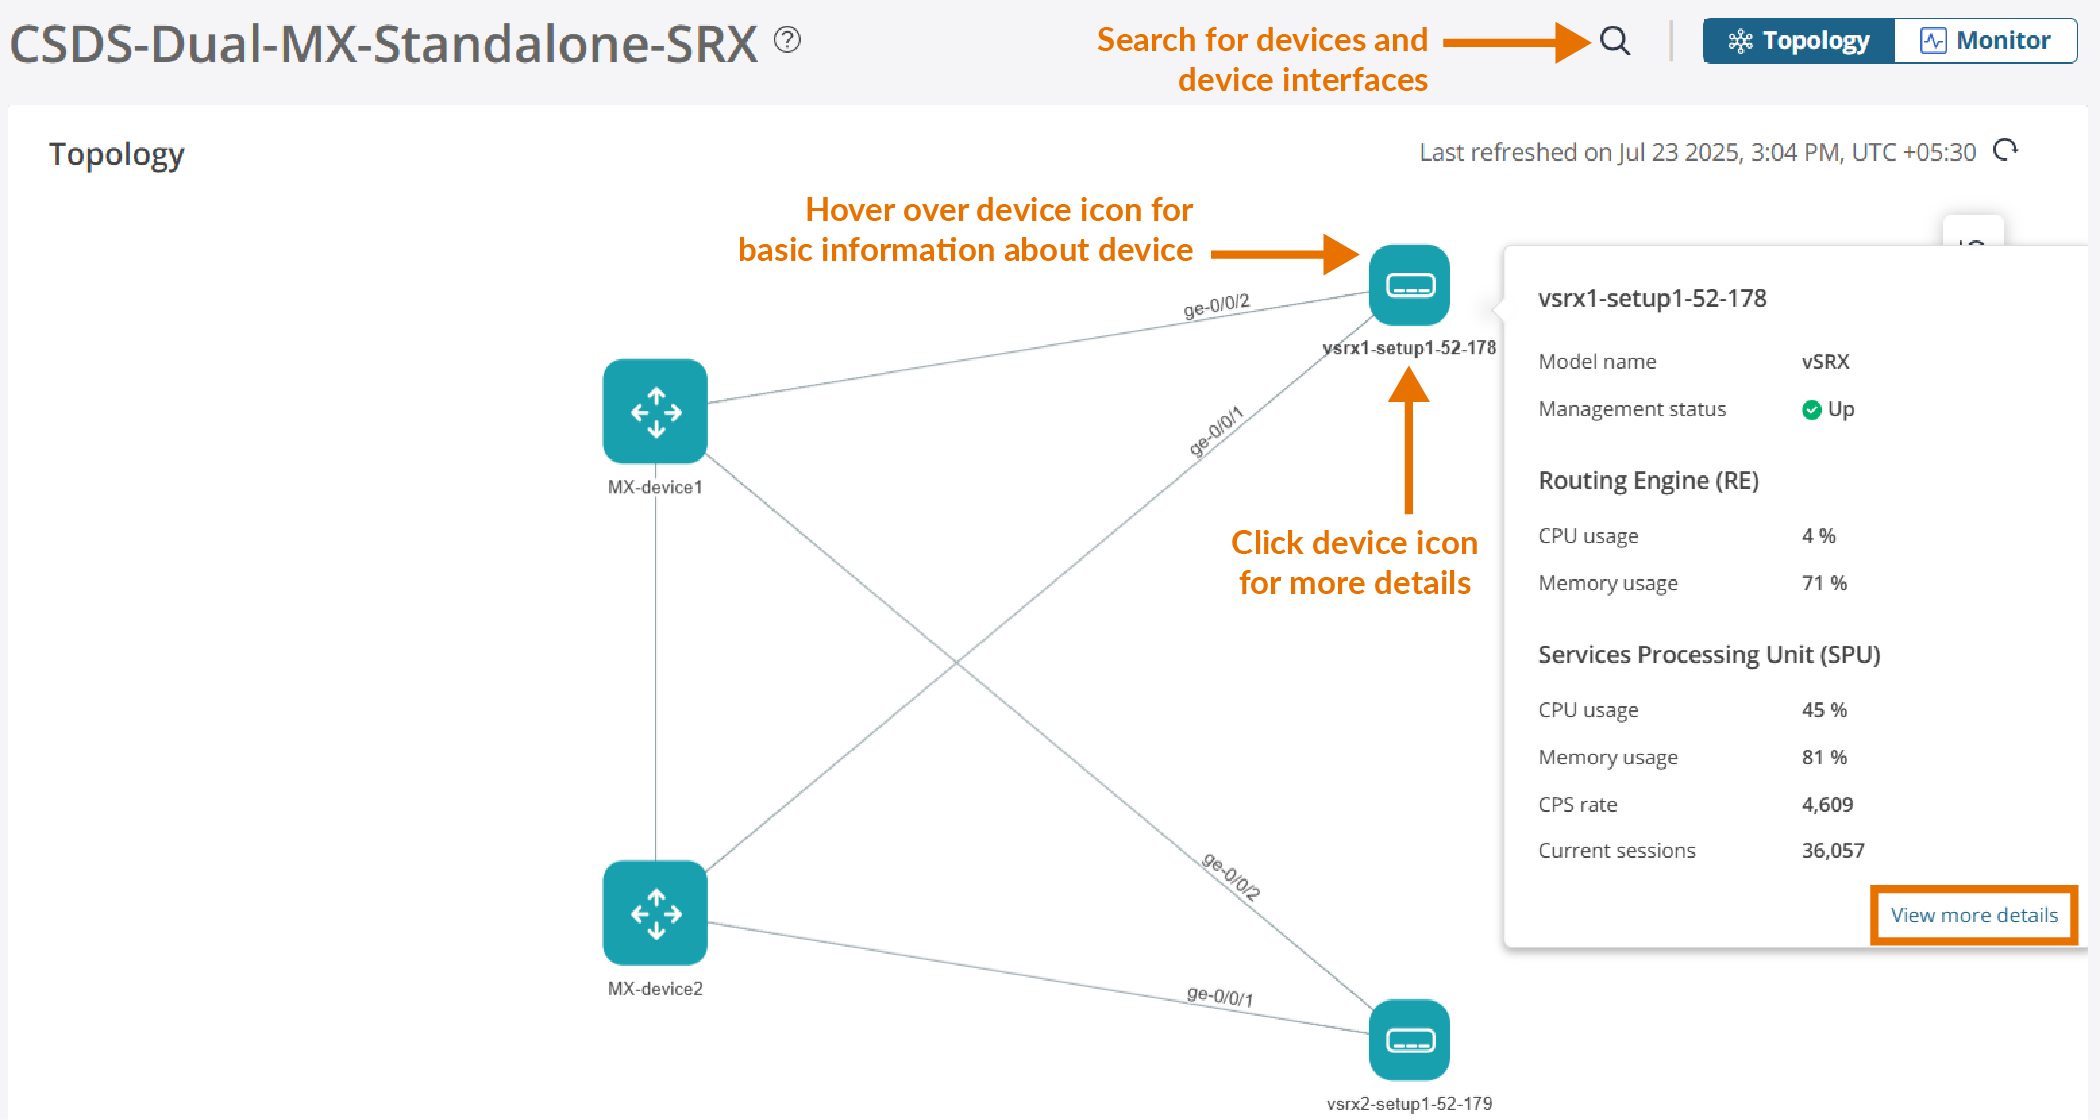
Click View more details or the device icon for more information about the device.
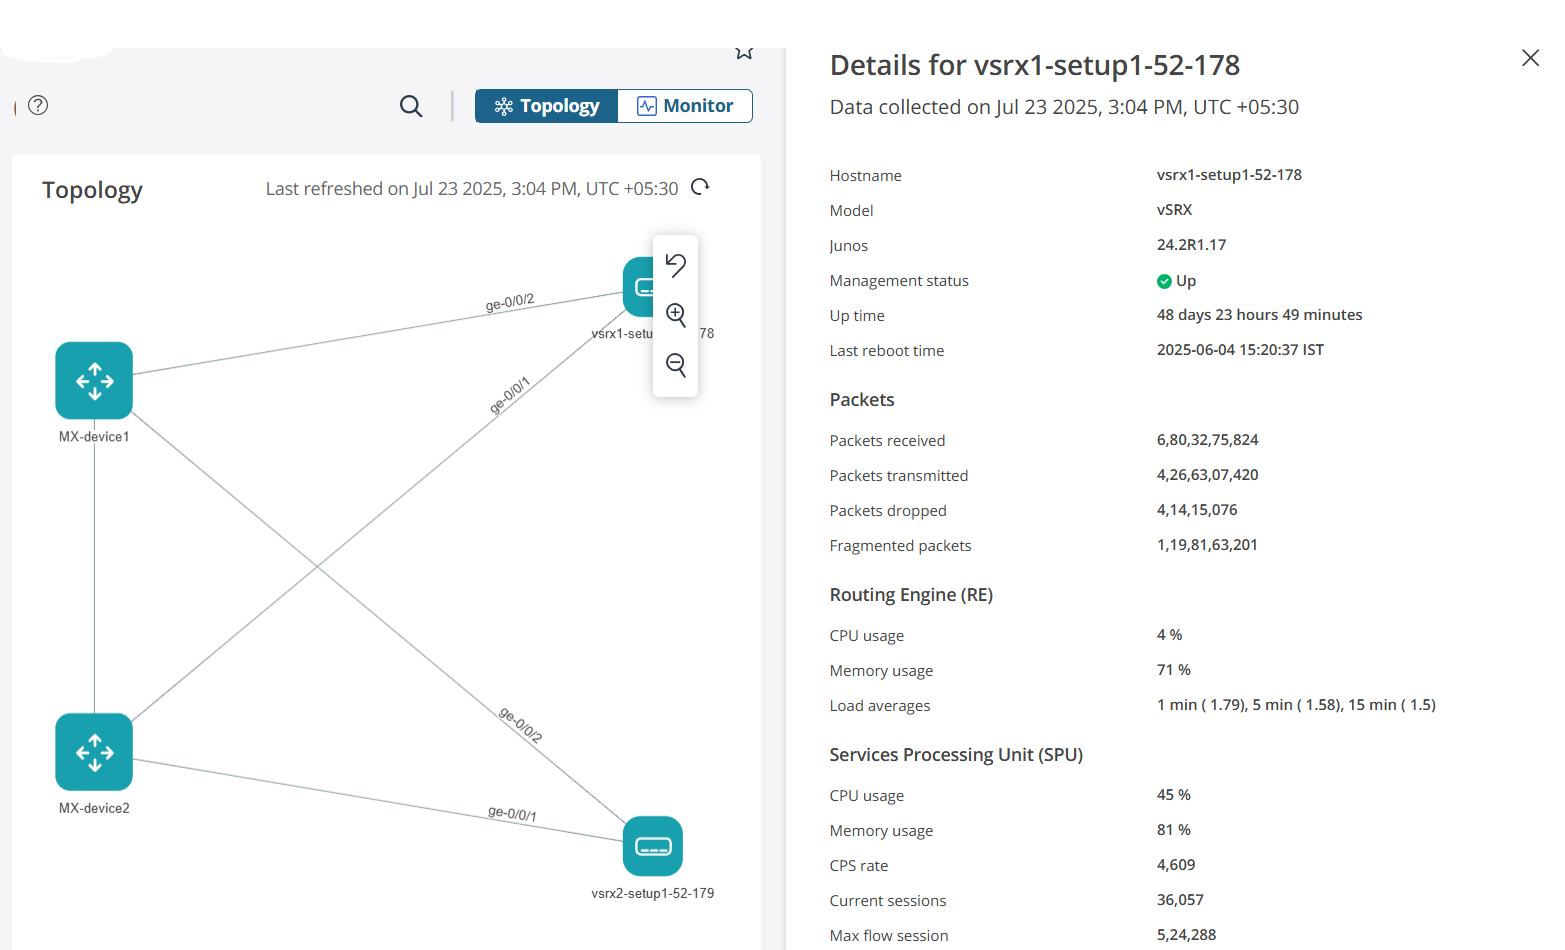
Table 1 describes the device parameters.
| Parameter | Description |
|---|---|
| Hostname | Device hostname |
| Model | Device model |
| Junos | Version of Junos OS installed in the device |
| Management status | Management status of the device |
| Up time | Duration of device operation without any interruptions or reboots |
| Last reboot time | Time and date of the most recent reboot of the device |
| Packets | |
| Packets received | Number of packets received by the device |
| Packets transmitted | Number of packets transmitted by the device |
| Packets dropped | Number of packets dropped by the device |
| Fragmented packets | Number of fragmented packets received in a flow on the SPU. |
| Routing Engine (RE) | |
| CPU usage | Percentage of CPU used by the RE |
| Memory usage | Percentage of memory resources used by the RE |
| Load averages | Average RE load time for the last 1, 5, and 15 minutes |
| Services Processing Unit (SPU) | |
| CPU usage | Percentage of CPU used by the SPU |
| Memory usage | Percentage of memory resources used by the SPU |
| CPS rate | Number of connections created by the SPU in a second |
| Current session | Number of sessions in a flow on the SPU |
| Max flow session | The maximum number of flow sessions that the device can support |
Device Interface
You can view details about the device interface, including the admin status, link status, last flap time and date, and number of packets and bits received and transmitted by the device. See Figure 3 for basic information about the interface.
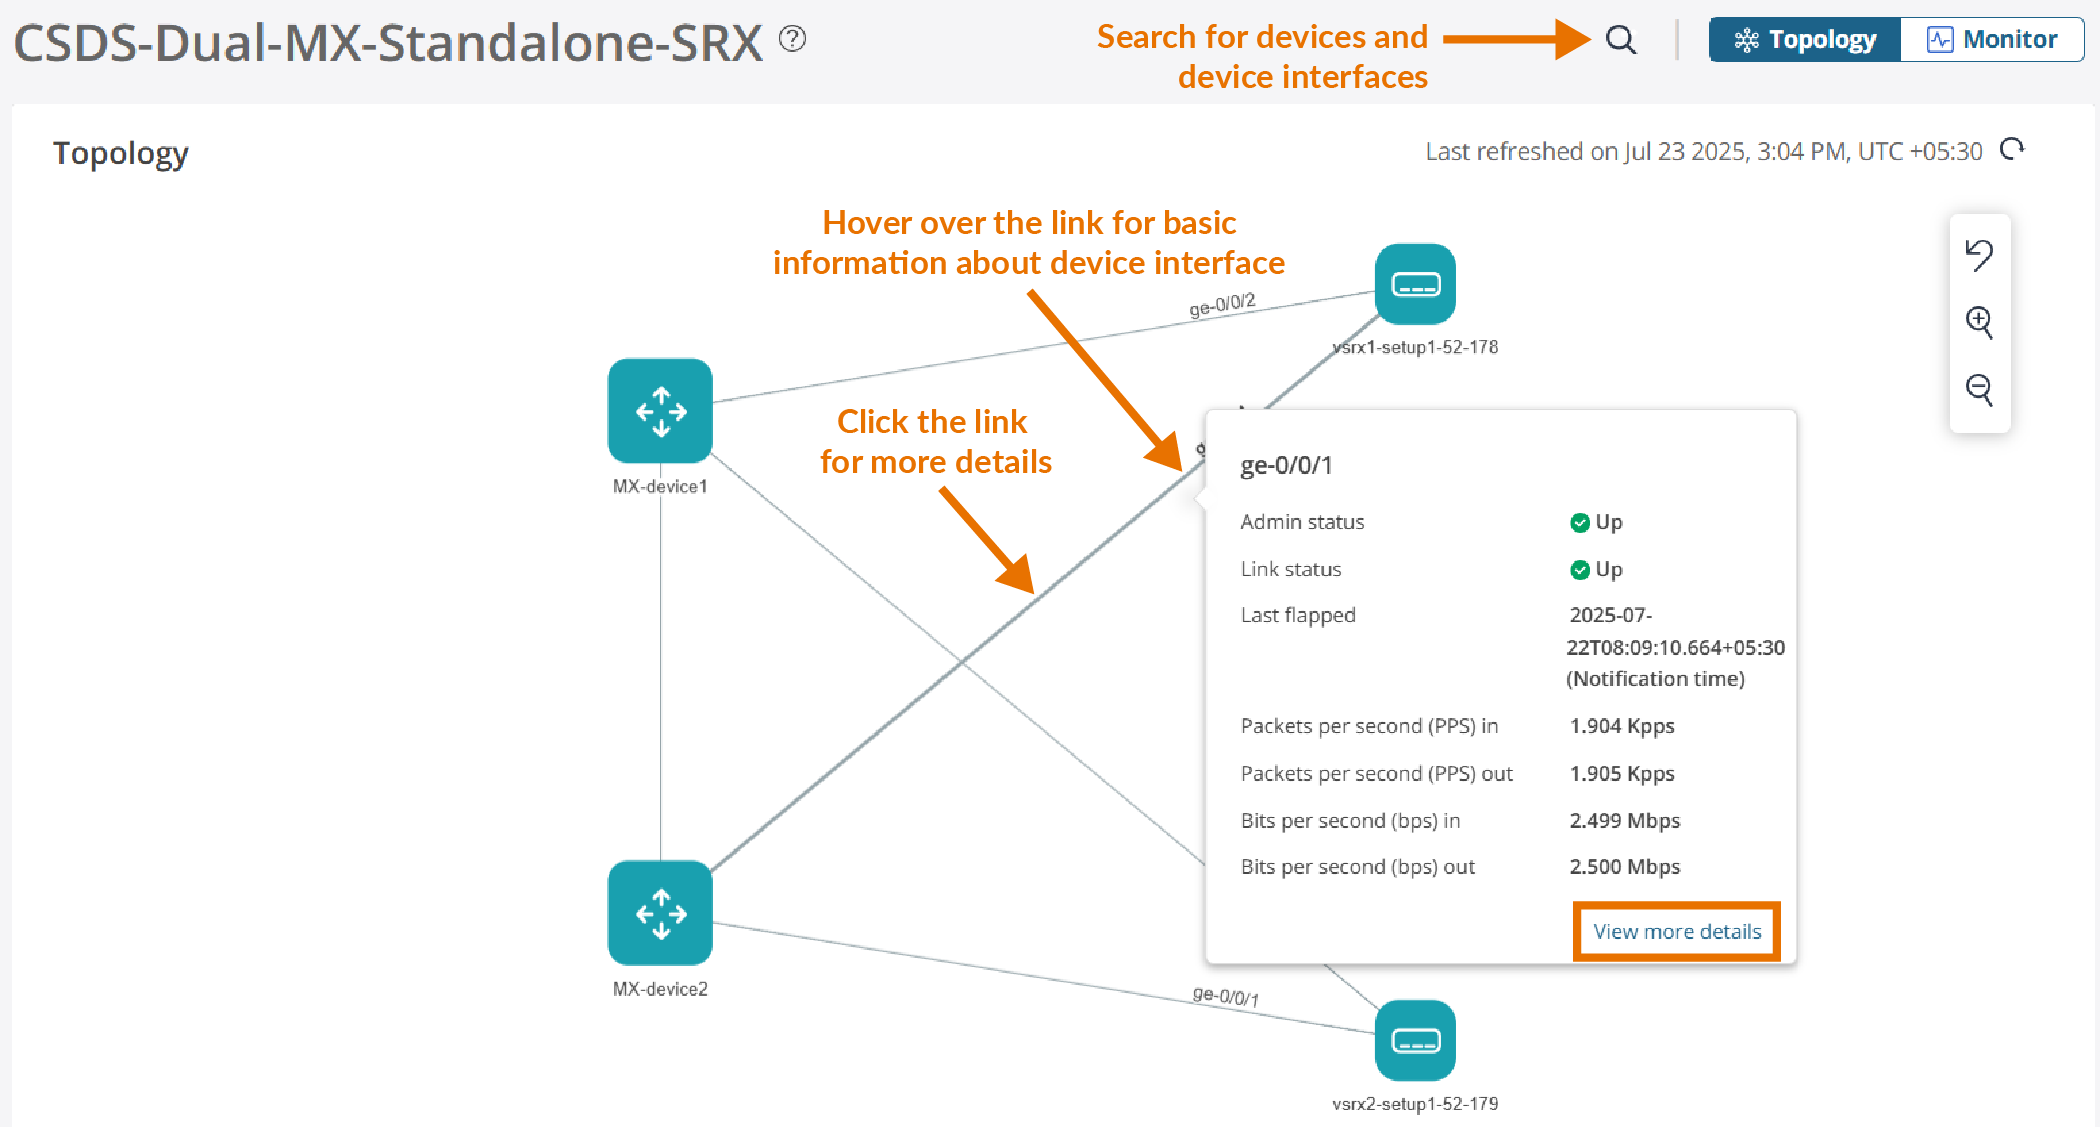
Click View more details or the interface link for more information about the interface.
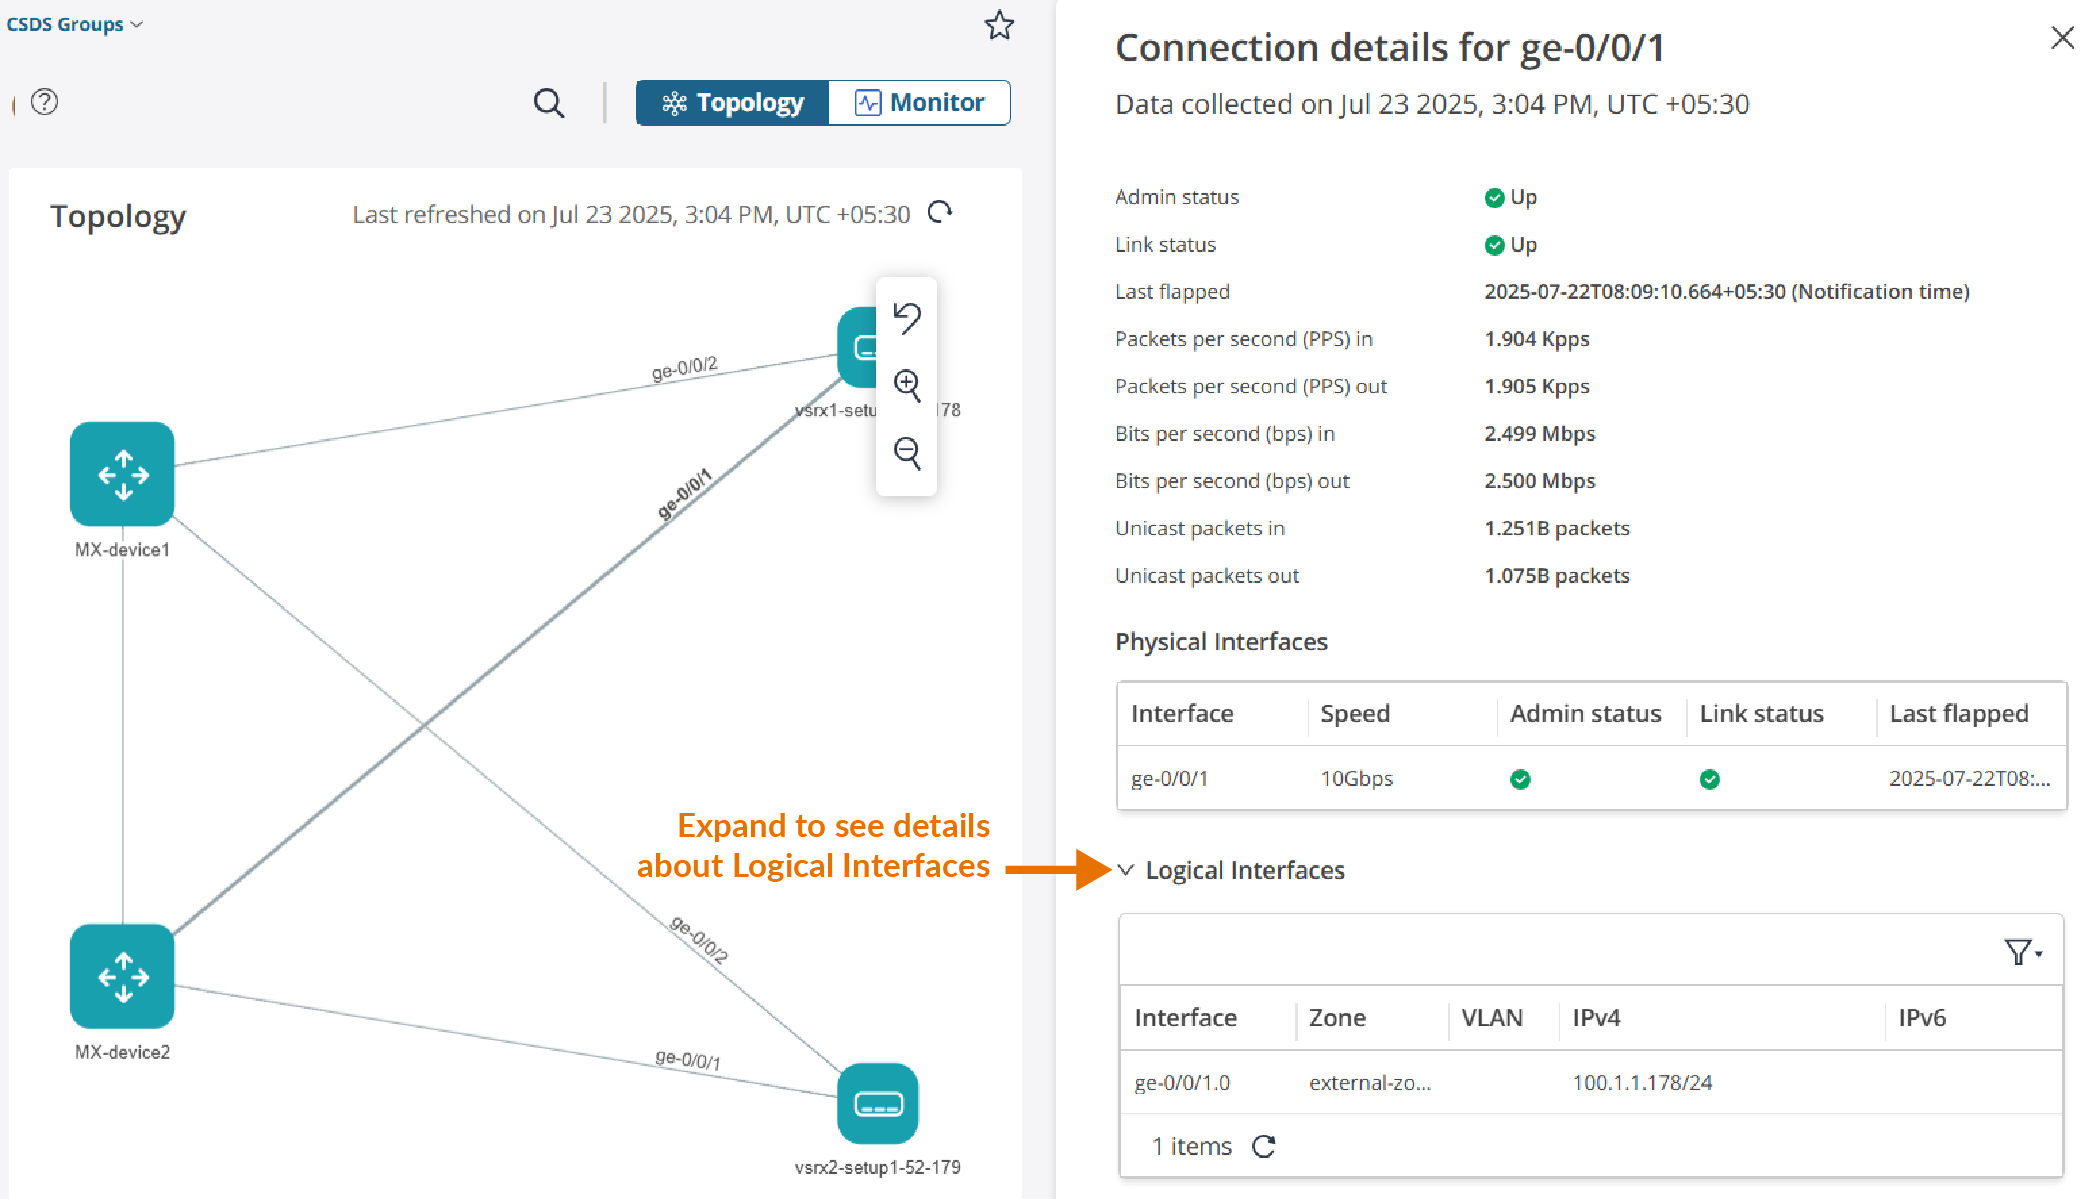
Table 2 describes the device interface parameters.
| Parameter | Description |
|---|---|
| Admin status | Indicates whether the interface is enabled or disabled by the network administrator. An interface with an admin status of Up is enabled, while an interface with an admin status of Down is disabled. |
| Link status | Indicates whether the physical link of the interface is currently active or not. If the interface is up and running, it is capable of transmitting and receiving the data. |
| Last flapped | Time and date of the most recent interface transition between the up and down states. |
| Packets per second (PPS) in | Number of packets received by the SRX Series Firewall interface in a second |
| Packets per second (PPS) out | Number of packets transmitted by the SRX Series Firewall interface in a second |
| Bits per second (bps) in | The speed at which data is received by the SRX Series Firewall interface |
| Bits per second (bps) out | The speed at which data is transmitted by the SRX Series Firewall interface |
| Unicast packets in | Number of unicast packets received by the SRX Series Firewall interface |
| Unicast packets out | Number of unicast packets transmitted by the SRX Series Firewall interface |
| Physical Interfaces | |
| Interface | Name of the physical interface |
| Speed | Ethernet speed of the physical interface |
| Admin status | Indicates whether the physical interface is enabled or disabled by the network administrator |
| Link status | Indicates whether the physical link of the interface is currently active or not. |
| Last flapped | Time and date of the most recent interface transition between the up and down states. |
| Logical Interfaces | |
| Interface | Name of the logical interface |
| Zone | Name of zone assigned to the logical interface |
| VLAN | Name of the VLAN configured on the logical interface |
| IPv4 | IPv4 address of the logical interface |
| IPv6 | IPv6 address of the logical interface |
You can switch between the Topology and Monitor pages. Click Monitor at the top-right corner of the page to monitor the widgets related to the CSDS group. For more information about monitoring, see Monitor SRX Series Firewalls in CSDS Groups.