Traffic Load Analysis
Network planners can visualize how network resources are used according to the traffic load input. In NorthStar Planner, there are two ways for the user to view network utilization with traffic load information through the NorthStar Planner client:
Network map color-coded link utilizations
Traffic load bar charts
You can also supply a “trafficload” file, which specifies measured or predicted traffic loads per demand during as many as 24 distinct periods. These periods can represent summarized daily traffic (in bits per second), or hourly traffic, for example. NorthStar Planner can then simulate the load on the links during each period. More detail on the format of the traffic load file can be found in Traffic Load File.
Animated Traffic Load Display
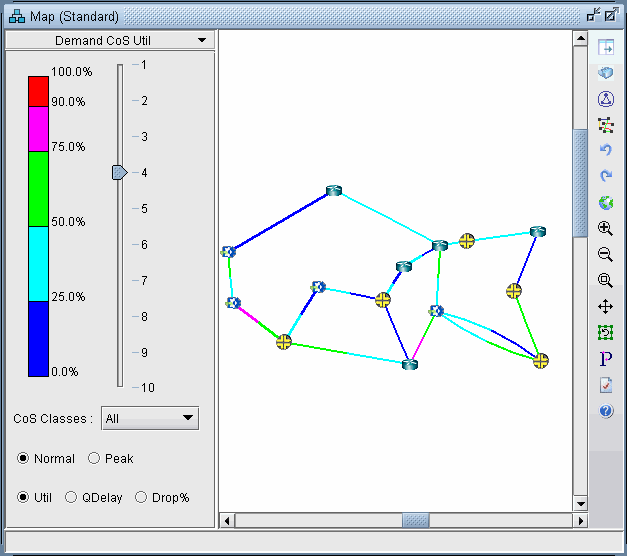
To view an animation of traffic load on the network map, select the Utilization Legends > Demand CoS Util legend. You can choose various options:
Normal or Peak
Utilization, QDelay or Drop Percentage
All CoS classes or one particular class
Select a period to update the link colors on the map to reflect the link load that results when the demand traffic for that period is routed over the network. Link utilization colors can be modified on the link utilization map legend.

Alternatively, find the equivalent options from the Traffic > Traffic Load window. In this window are two extra ticks on the slidebar for the current load and the worst load. Select Run to automatically step through each period.
