LDP Traffic Collection
LDP traffic statistics track the volume of traffic passing through forwarding equivalence classes. In addition to monitoring the LDP traffic statistics in the NorthStar Controller, the data can also be imported into the NorthStar Planner for capacity planning and failure simulation studies.
You must run device collection before attempting to run LDP traffic collection so NorthStar (Toposerver) can discover LDP-enabled links. Learning which links are LDP-enabled allows NorthStar to compute LDP equal cost paths between sources and destinations.
Currently, the LDP traffic collection task only supports Juniper Networks Junos OS devices. Even if you specify other devices in the task setup, this task will only run against Junos OS devices.
The device collection task extracts LDP-enabled interfaces from the Junos OS configuration at the [protocols ldp] and [protocols mpls] hierarchy levels. ConfigServer correlates these interfaces with the links discovered by Toposerver.
To schedule a new LDP traffic collection task, navigate to Administration > Task Scheduler from the More Options menu.
-
Enter a name for the task and use the drop-down menu to select the task type LDP Traffic Collection. Click Next to display the first Create New Task – LDP Traffic Collection window as shown in Figure 1.
Figure 1: LDP Traffic Collection Task, All Devices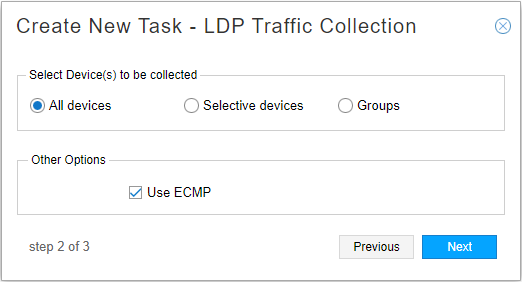
Under Select Device(s) to be collected, you can choose All devices, Selective devices, or Groups as a method for specifying the devices to be included in the collection task. For all three of those choices, you can select “Use ECMP” to mark the created demands as ECMP candidates during placement simulation. The default is yes (check box selected).
If you select “Selective devices”, you are presented with a list of all the devices available to be included in the collection task. Figure 2 shows an example.
Figure 2: LDP Traffic Collection Task, Selective Devices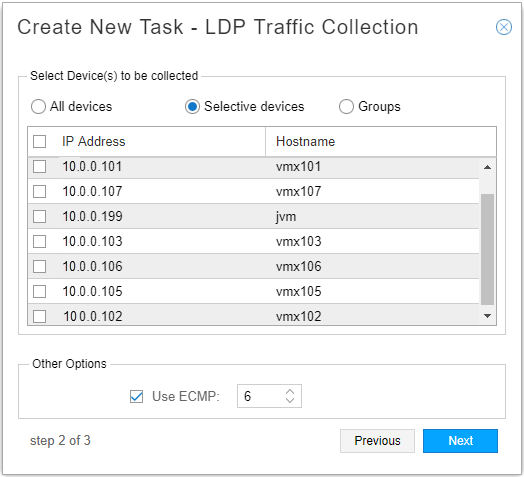
Click the check boxes corresponding to the devices you want to include.
If you opt for Groups, you are presented with a list of the device groups that have been configured in Administration > Device Profile, as shown in Figure 3.
Figure 3: LDP Traffic Collection Task, Groups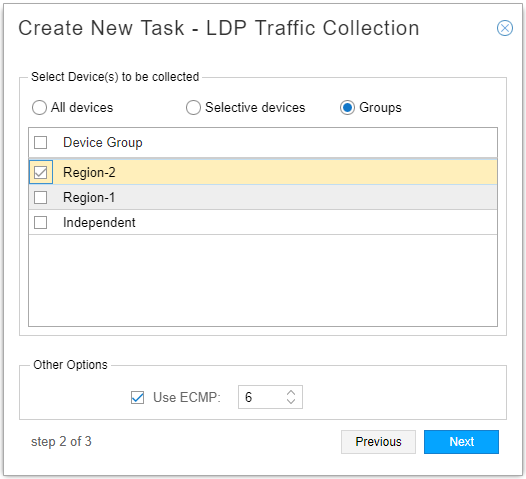
Click the check boxes corresponding to the groups you want to include.
-
Click Next to proceed to the scheduling parameters. The Create New Task - Schedule window is displayed as shown in Figure 4. At least two collections are necessary for the calculation of demand statistics. We recommend setting up automatic recurrence of the task every 10 to 20 minutes.
Figure 4: LDP Traffic Collection Task, Scheduling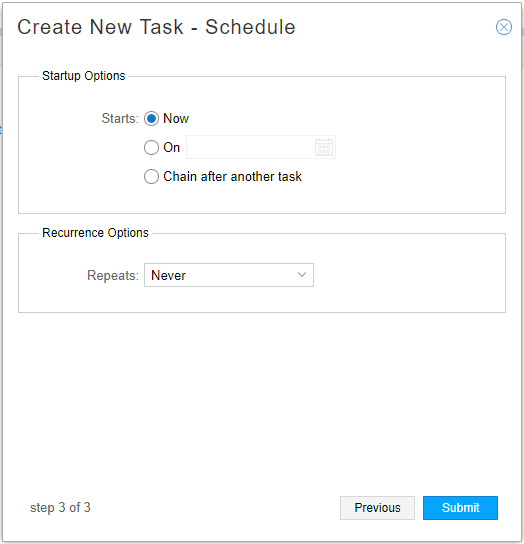
The option to chain the task after an already-scheduled recurring task is available, but we do not recommend it for LDP collection. LDP collection is better handled as a recurring, independent task.
-
Click Submit to complete the addition of the new collection task and add it to the Task List. The LDP traffic collection task executes
show ldp traffic-statisticsat configured intervals for the selected devices. Elasticsearch stores and indexes the collected the data for further query.Click a completed task in the list task list to display the results in the lower portion of the window. There are three tabs in the results window: Summary, Status, and History. An example of the Summary tab is shown in Figure 5. An example of the Status tab is shown in Figure 6.
Figure 5: Example Collection Results for LDP Traffic Collection Task, Summary Tab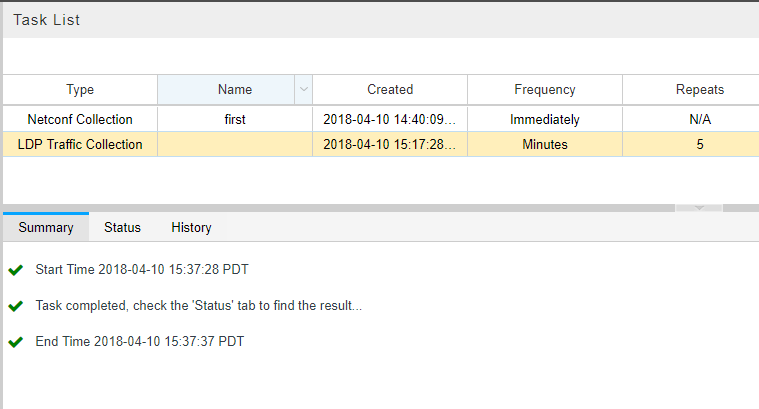 Figure 6: Example Collection Results for LDP Traffic Collection Task, Status Tab
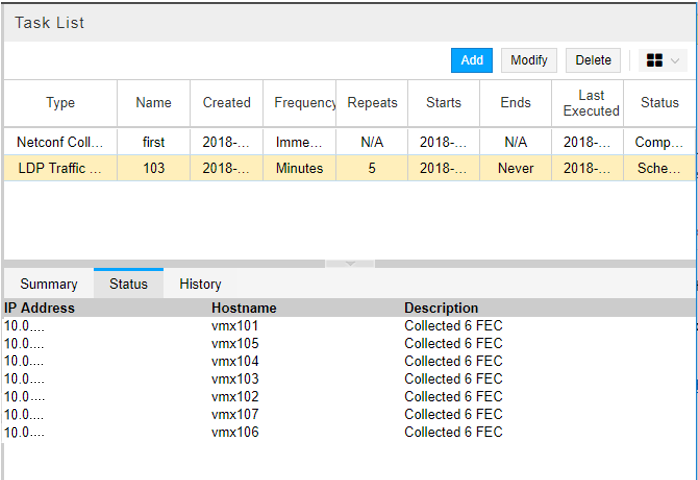 Note:
Note:You can have only one LDP traffic collection task per NorthStar server. If you attempt to add a second, the system will prompt you to approve overwriting the first one.
-
Once the traffic collection task has completed, view the collected data in the Demand tab of the network information table. The Node, Link, and Tunnel tabs are always displayed. The other tabs are optionally displayed. Click the plus sign (+) in the tabs heading bar to add a tab as shown in Figure 7.
Figure 7: Adding a Tab to the Network Information Table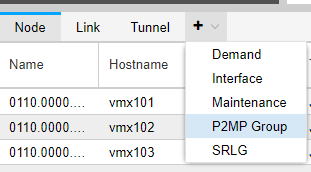
The Demand tab lists the LDP Forwarding Equivalent Class (FEC) data, including Node A, Node Z, IP A, IP Z, and Bandwidth. NorthStar creates the FEC names using the source name and the destination IP address. Figure 8 shows an example of the Demand tab.
Figure 8: Network Information Table, Demand Tab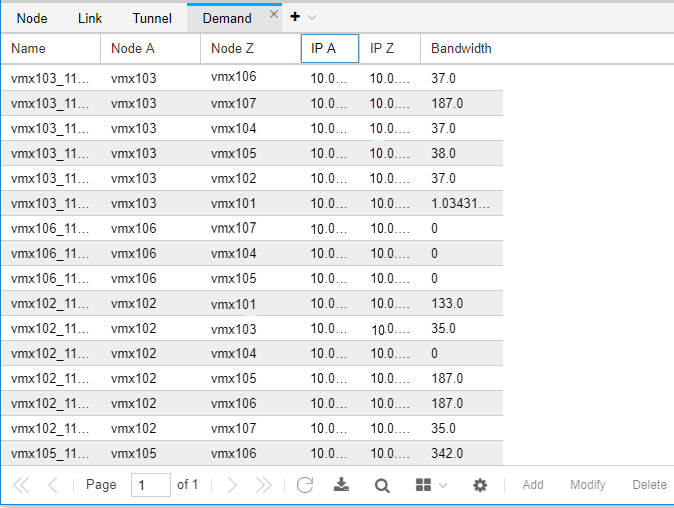
-
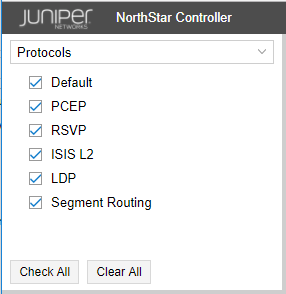
To view LDP-enabled links in the topology map, navigate to Protocols in the left pane and check LDP as shown in Figure 9.
Figure 9: Network Information Table, Demand Tab