Managing Juniper Networks Data Center Infrastructure from vROps
You can view the Juniper Networks data center infrastructure by using the various dashboards that are installed when you add the Juniper Networks Management Pack to vROps. In addition to this, you can use the Juniper Infrastructure view to display additional details for the data center and devices.
This topic describes how to:
Open the Juniper Networks Data Center Infrastructure View
To open the Juniper Networks Data Center Infrastructure View:
- Do one of the following:
Click
 in the left navigation
pane tool bar.
in the left navigation
pane tool bar.Select Environment from the list in the left navigation pane tool bar
View Data Center Details
To view the data center details in the Juniper Networks Data Center Infrastructure View page:
- Use the following tabs in the right pane of the Juniper
Networks Data Center Infrastructure View page to view more details
about the selected data center:
Summary—Displays information summary under three categories—Health, Risk, and Efficiency. Each category displays a badge and top alerts for the fabric and descendants, for example the Figure 1 shows the health status of the fabric device bng-11kona(VC). The badge color indicates the status of the fabric against each category.
Figure 1: Summary - Health Status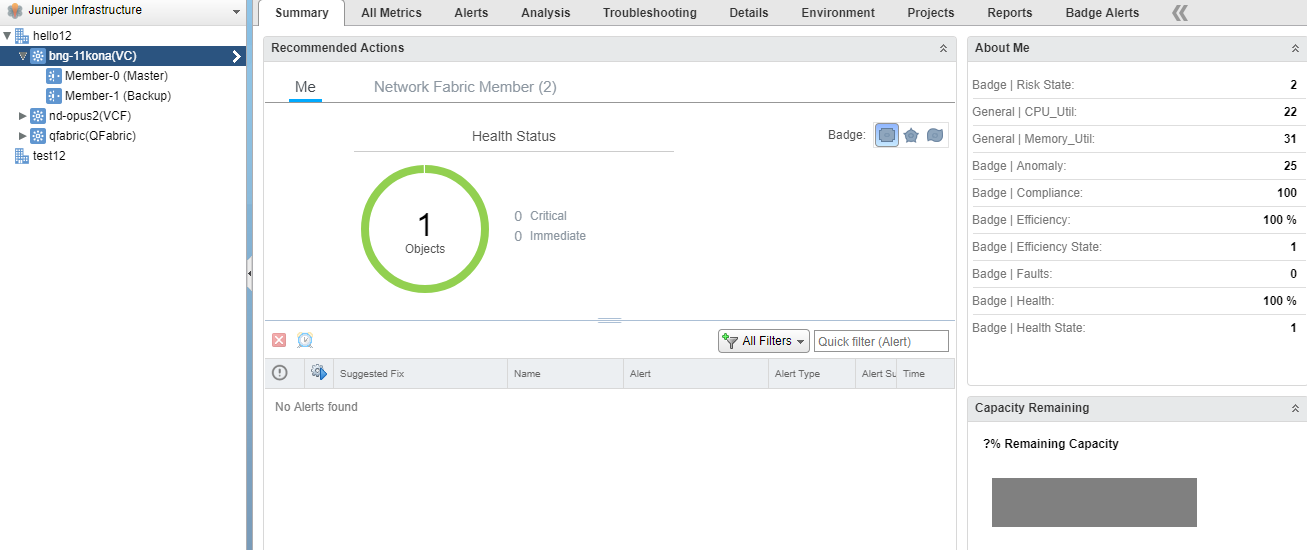
All Metrics—Displays the object relationship between the selected fabric and other devices. Double-click the device that you are troubleshooting, to view it in the context of parent and child objects.
Alerts—Displays all the alerts for the selected fabric and descendants. Click the alert description for displaying details about an alert.
Analysis—Displays anomalies in the fabric, if any.
Troubleshooting—Enables you to troubleshoot issues in the fabric and descendants by using the data presented under four tabs:
Symptoms—Displays the symptoms that you can use to analyze and troubleshoot issues.
Timeline—Displays a customizable timeline. You can use the timeline to identify common trends over time.
Events—Displays changes that occurred on the selected fabric or descendants because of user actions, system actions, triggered symptoms, or generated alerts.
Details—Displays details about the network fabric and the fabric members, such as the current active alerts, CPU and memory utilization of the fabric device and fabric members, and a list of symptoms. To view any of these details, click the corresponding item in the list. vROps displays the details for the item.
Environment—Displays the topology of the network fabric along with the data centers and the fabric members.
Projects—Displays list of all the projects generated for the selected object, group, or application.
Badge Alerts—Displays the Health. Risk, and Efficiency details.
Reports—You can generate reports using an existing report template or create a new report template and generate reports using the new template.
Note:See the vROps online Help to understand more about the Reports functionality.
Open Network Director from vROps
You can directly launch Network Director from vROps to view the port utilization and alarm details of a member device or to view the connectivity of member devices.
To open Network Director from vROps: