Help us improve your experience.
Let us know what you think.
Do you have time for a two-minute survey?

Help us improve your experience.
Let us know what you think.
Do you have time for a two-minute survey?
Please note that this will only appear for those on Global 01
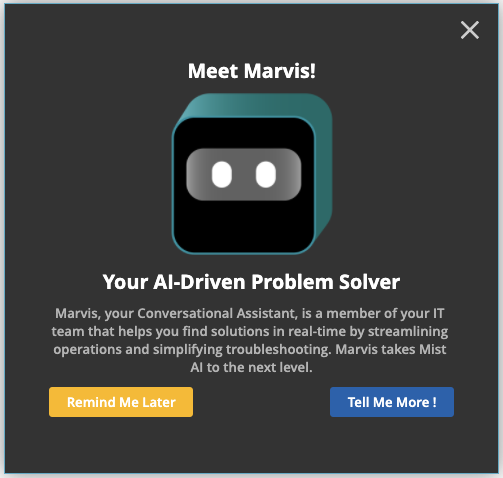
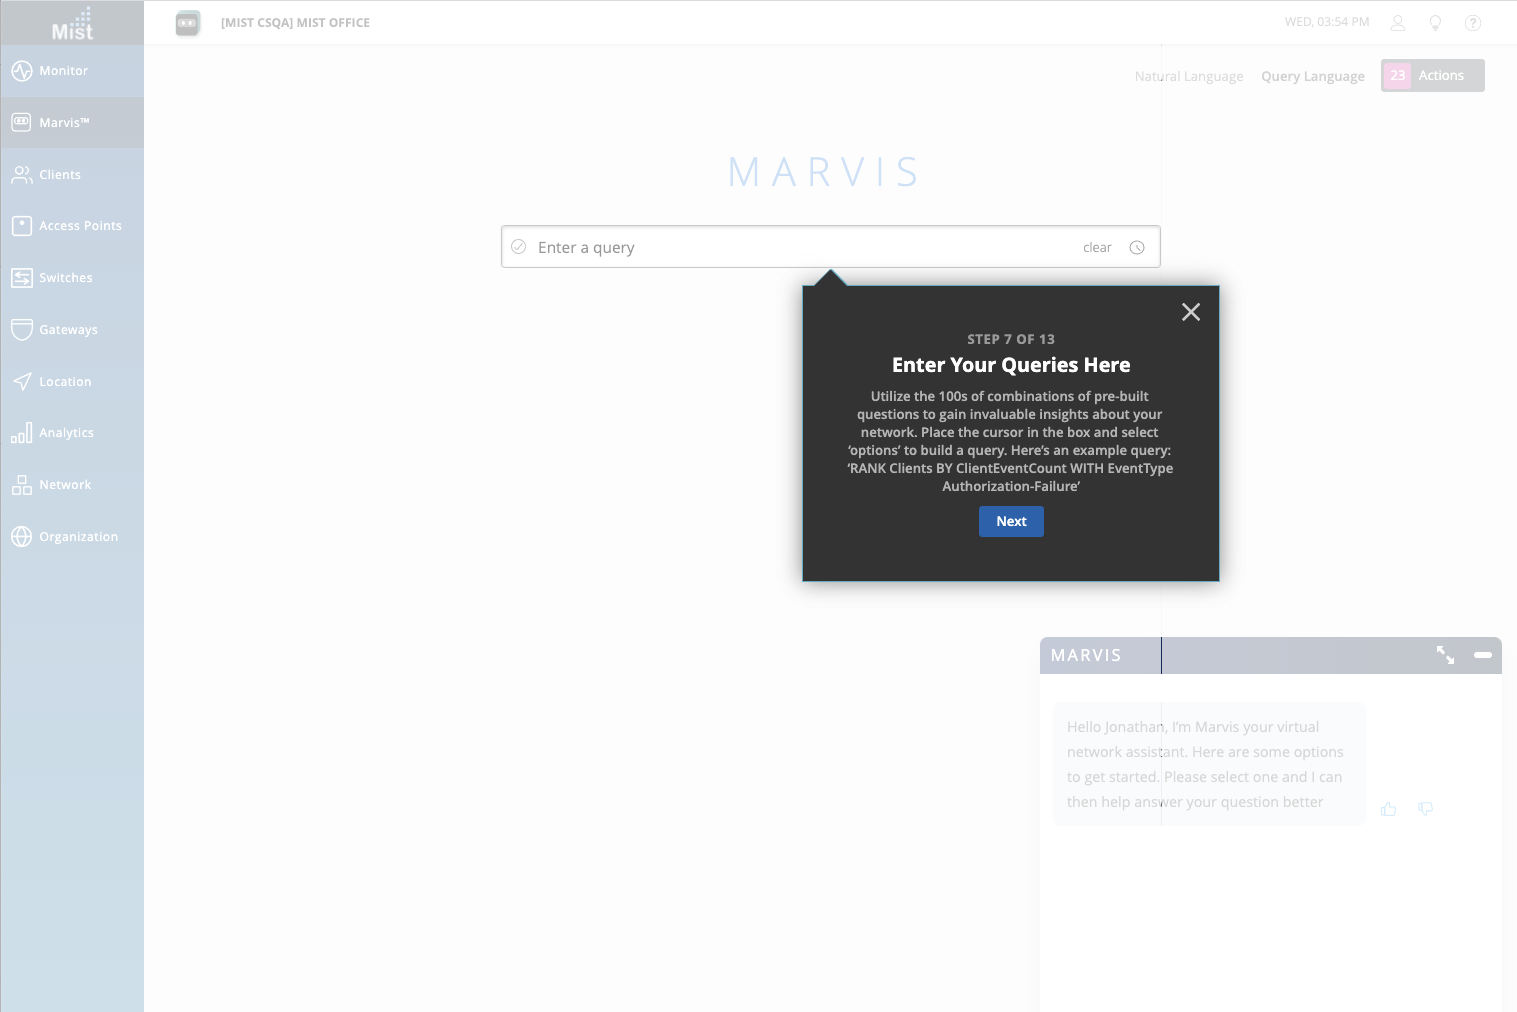
Today, Marvis supports three different main functions: Conversational Assistant, Action Dashboard, and the Natural, Query language interfaces. To ensure you are aware and are focusing on each of these areas, or to give new users an introduction to Marvis, we have included a Meet Marvis guide that will briefly walk you through the different Marvis features directly on our dashboard. Go through the step-by-step guide to familiarize yourself with Marvis, or feel free to exit out of the pop up and it will not show up again.
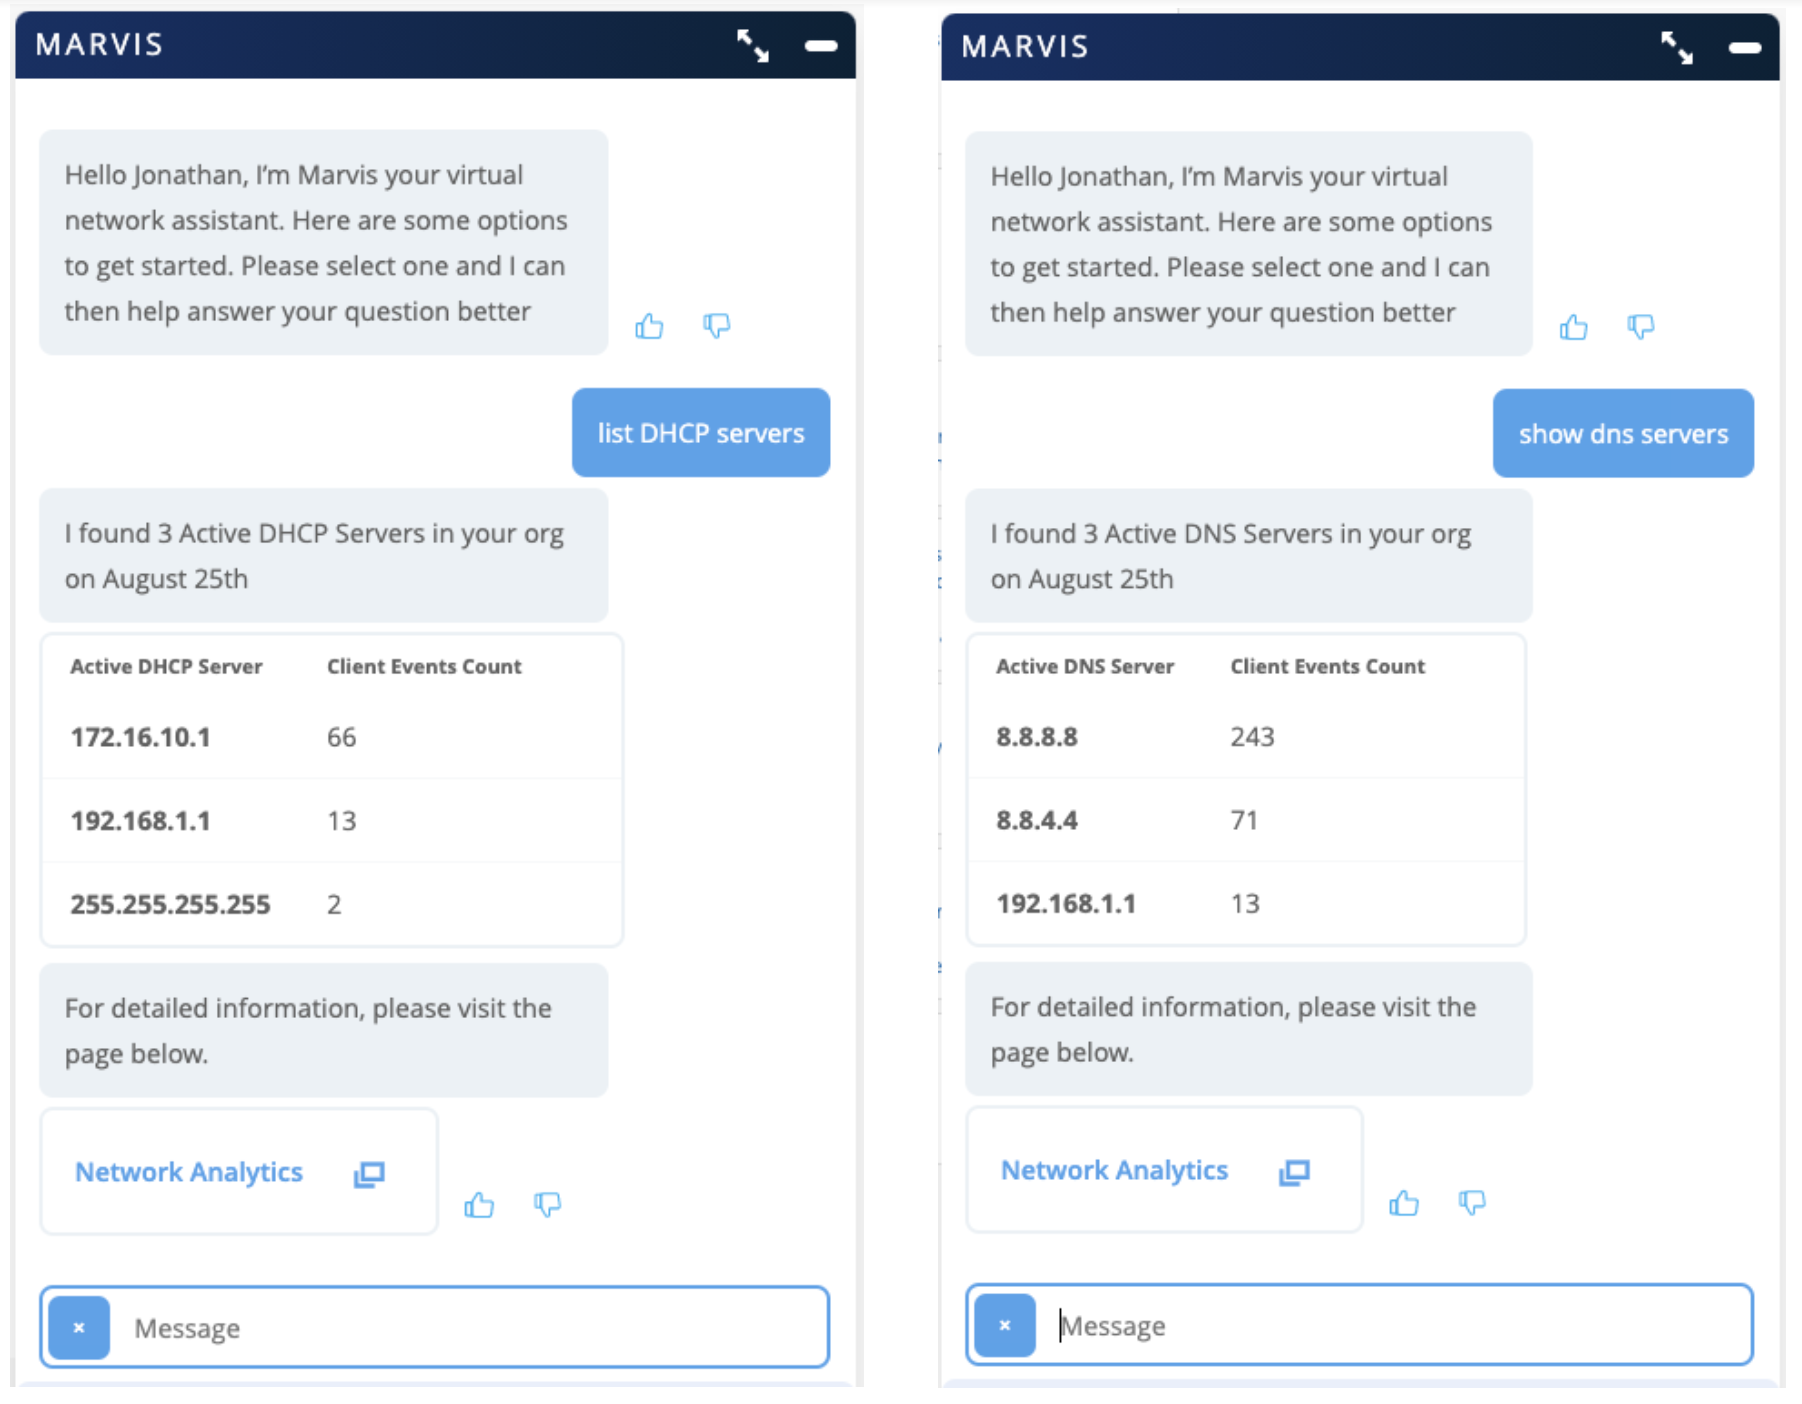
We are constantly making improvements and adding more support to our Marvis Conversational Assistant. Starting this week, Marvis can now show you your DNS, DHCP, and Radius servers. Marvis will return a list of all active servers on your organization as well as provide a client event count on each one. A link to your Network Analytics page will redirect you to your Analytics dashboard where you can create your customized report & view more details.
Learn more about Network and Engagement Analytics here: https://www.juniper.net/documentation/us/en/software/mist/mist-analytics/topics/topic-map/standard-analytics-engagement.html
Earlier we introduced the Persistently Failing Marvis Actions which captures cases where clients (wired/wireless) are continuously failing to connect due to a client specific issue (the scope of failure is not related to AP, WLAN, or network servers). Now, you can download the full list of your Persistently Failing clients in an organized .CSV file format. All the details visible on the Actions Dashboard UI are included in this file download, including the reason for failure, WLAN, and Switch/port details. Find the download button at the top of your Actions Details box.
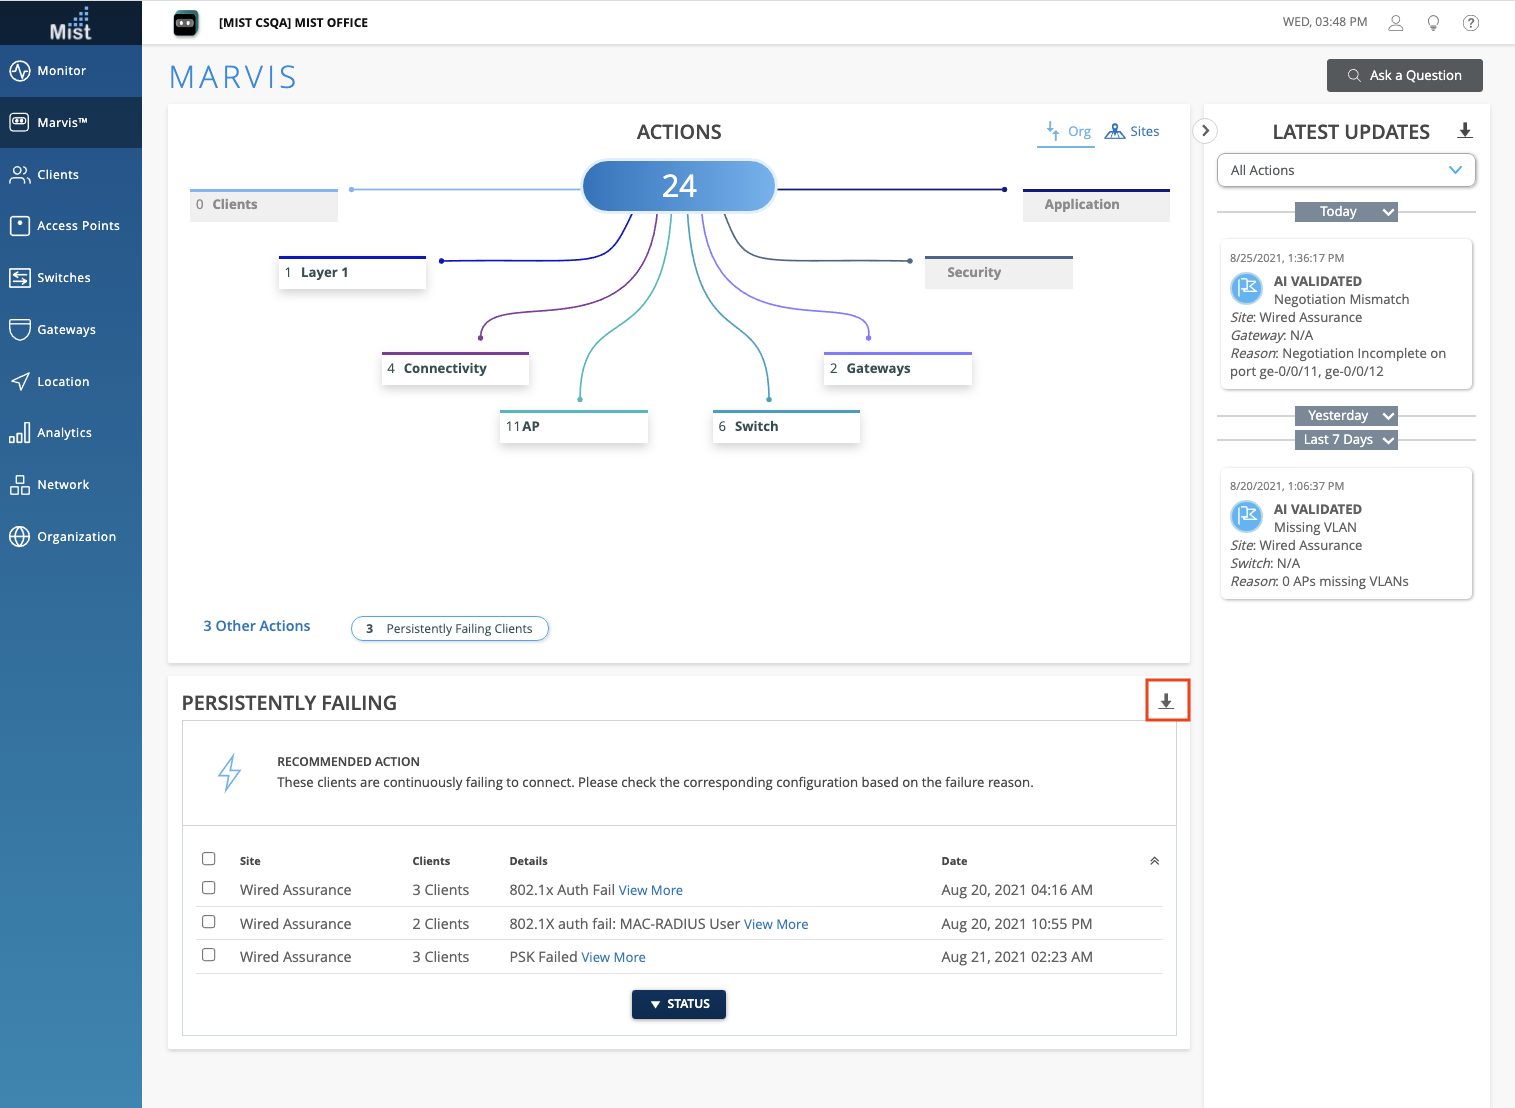
Here is a sample CSV download:

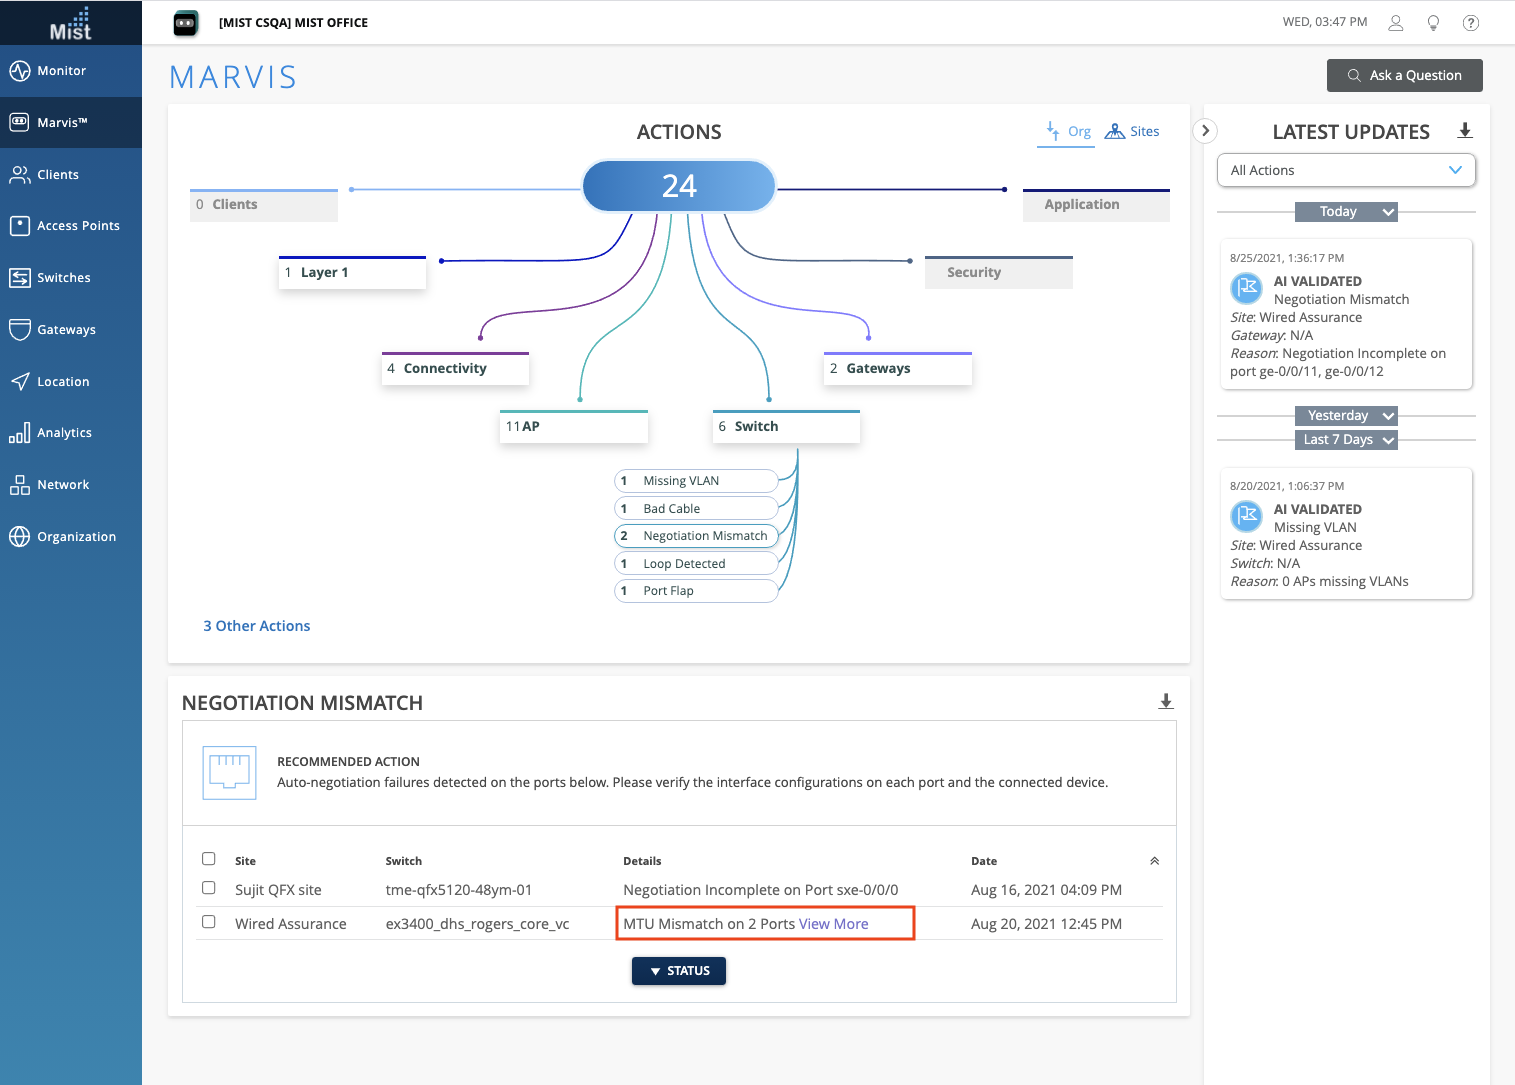
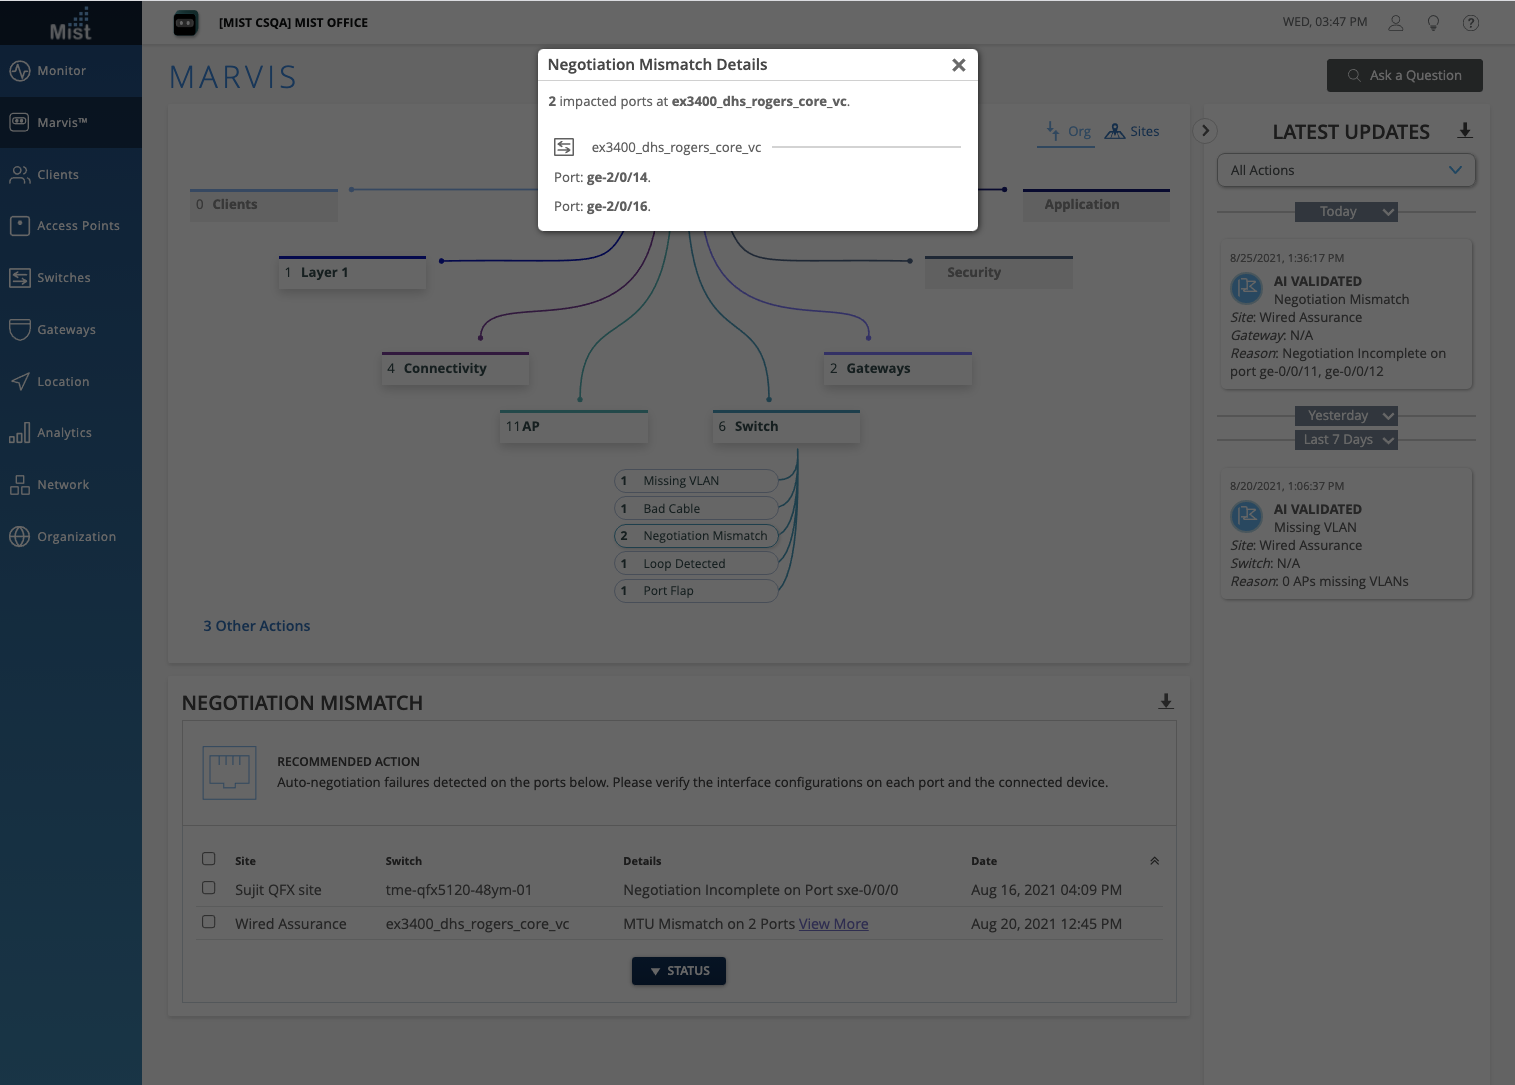
We are cleaning up how we display Actions that involve multiple ports of the same switch/gateway i.e. a single switch experiencing MTU Mismatch on 2 different ports. Previously, we displayed the list of all problem ports directly in the Details column. Starting this week, if a switch or gateway has more than one port experiencing an issue, a View More link will be included in the Details column, which will open a pop up modal displaying the full list of ports involved. This is similar to how we display multiple Missing VLAN or AP Offline issues.
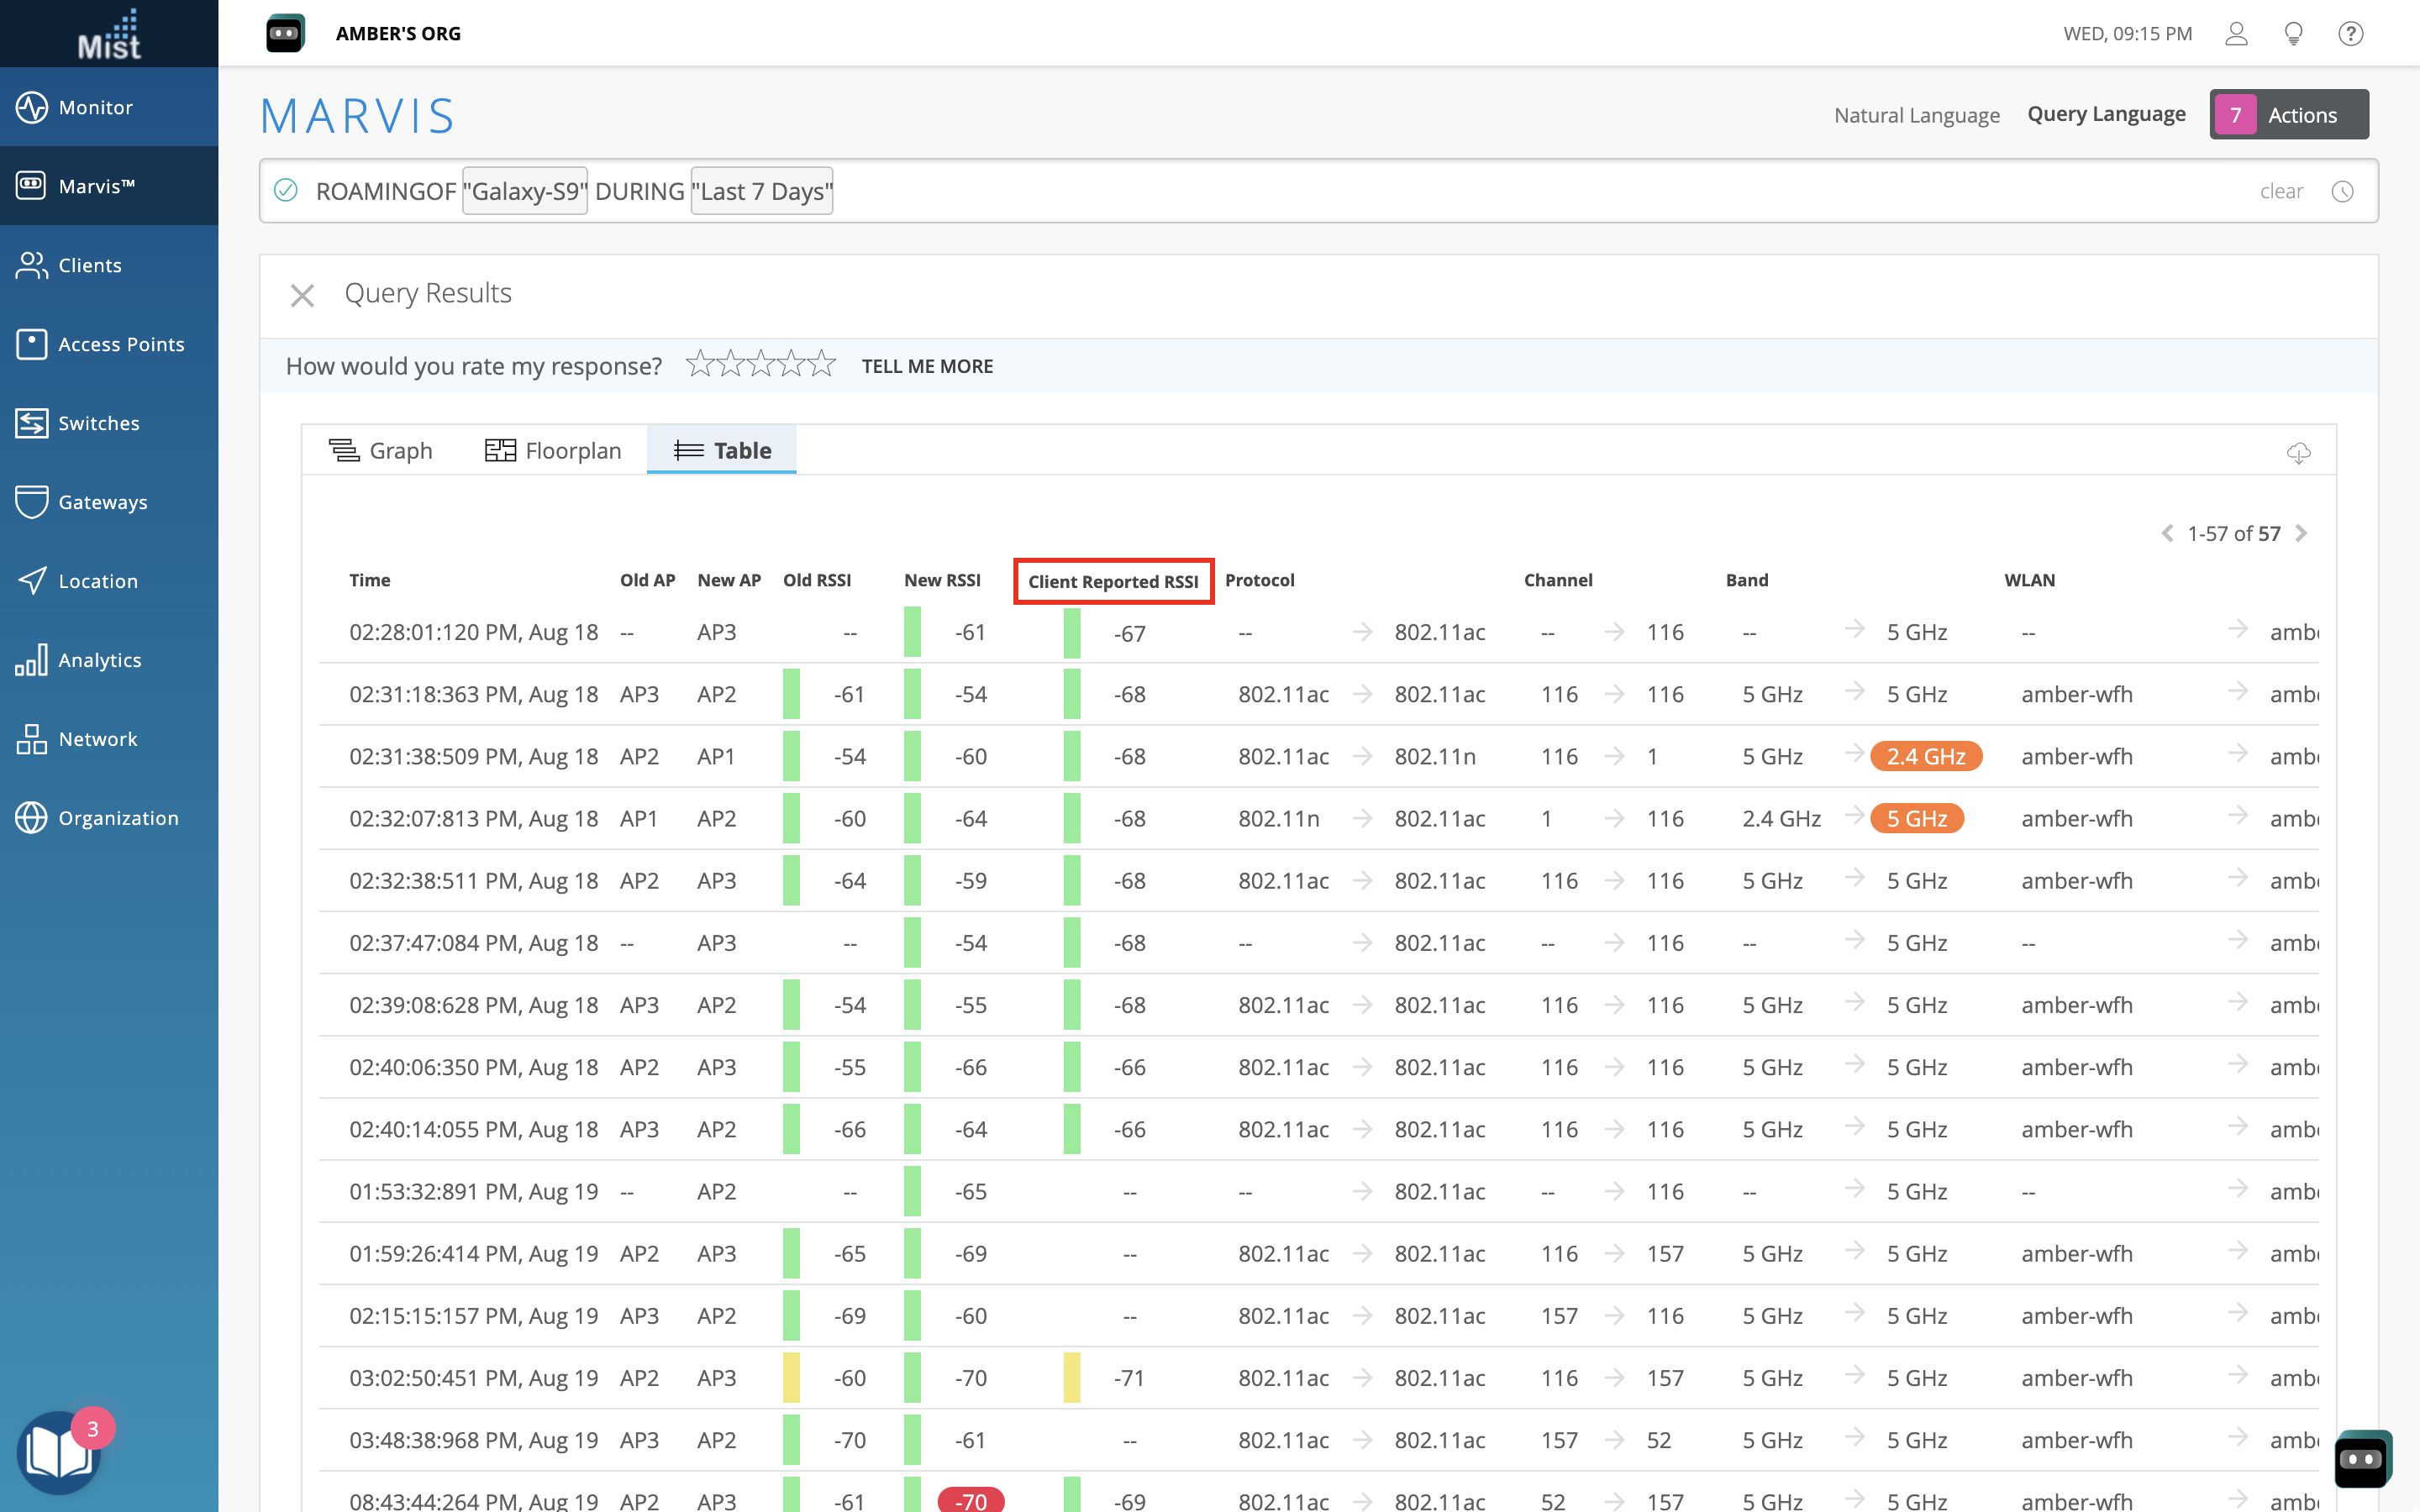
With Marvis Android clients, you have expanded visibility into how the client device sees the Wi-Fi environment. This week we are adding a Client Reported RSSI column in your roaming data when querying Marvis for roaming of a client. To view the client roaming visualization, use the “ROAMING OF” query as demonstrated here: https://www.juniper.net/documentation/us/en/software/mist/mist-aiops/topics/concept/marvis-client-roaming-visualization.html
Select the Table column to get a tabular view. Here you can see the new Client Reported RSSI column.
Learn more about Marvis SDK in this section of our documentation portal: https://www.juniper.net/documentation/us/en/software/mist/mist-aiops/topics/topic-map/marvis-client-android.html
Hotspot 2.0 allows automatic secured connections for mobile devices to enable seamless user experience for various use-cases, such as public guest networks, carrier WiFi offload, Eduroam services and many more. This week we are introducing even more customizability for your Hotspot 2.0 configurations in the Advanced Settings menu. Here, you can now configure Domain Names, Roaming Consortium IDs, and NAI Realm for your Hotspot 2.0 WLAN. Type out your Domain names and Roaming Consortium IDs in a comma-separated list. Add NAI Realms for the following EAP Types: TLS, AKA, and TTLS. You can add, delete, and name each NAI Realm.
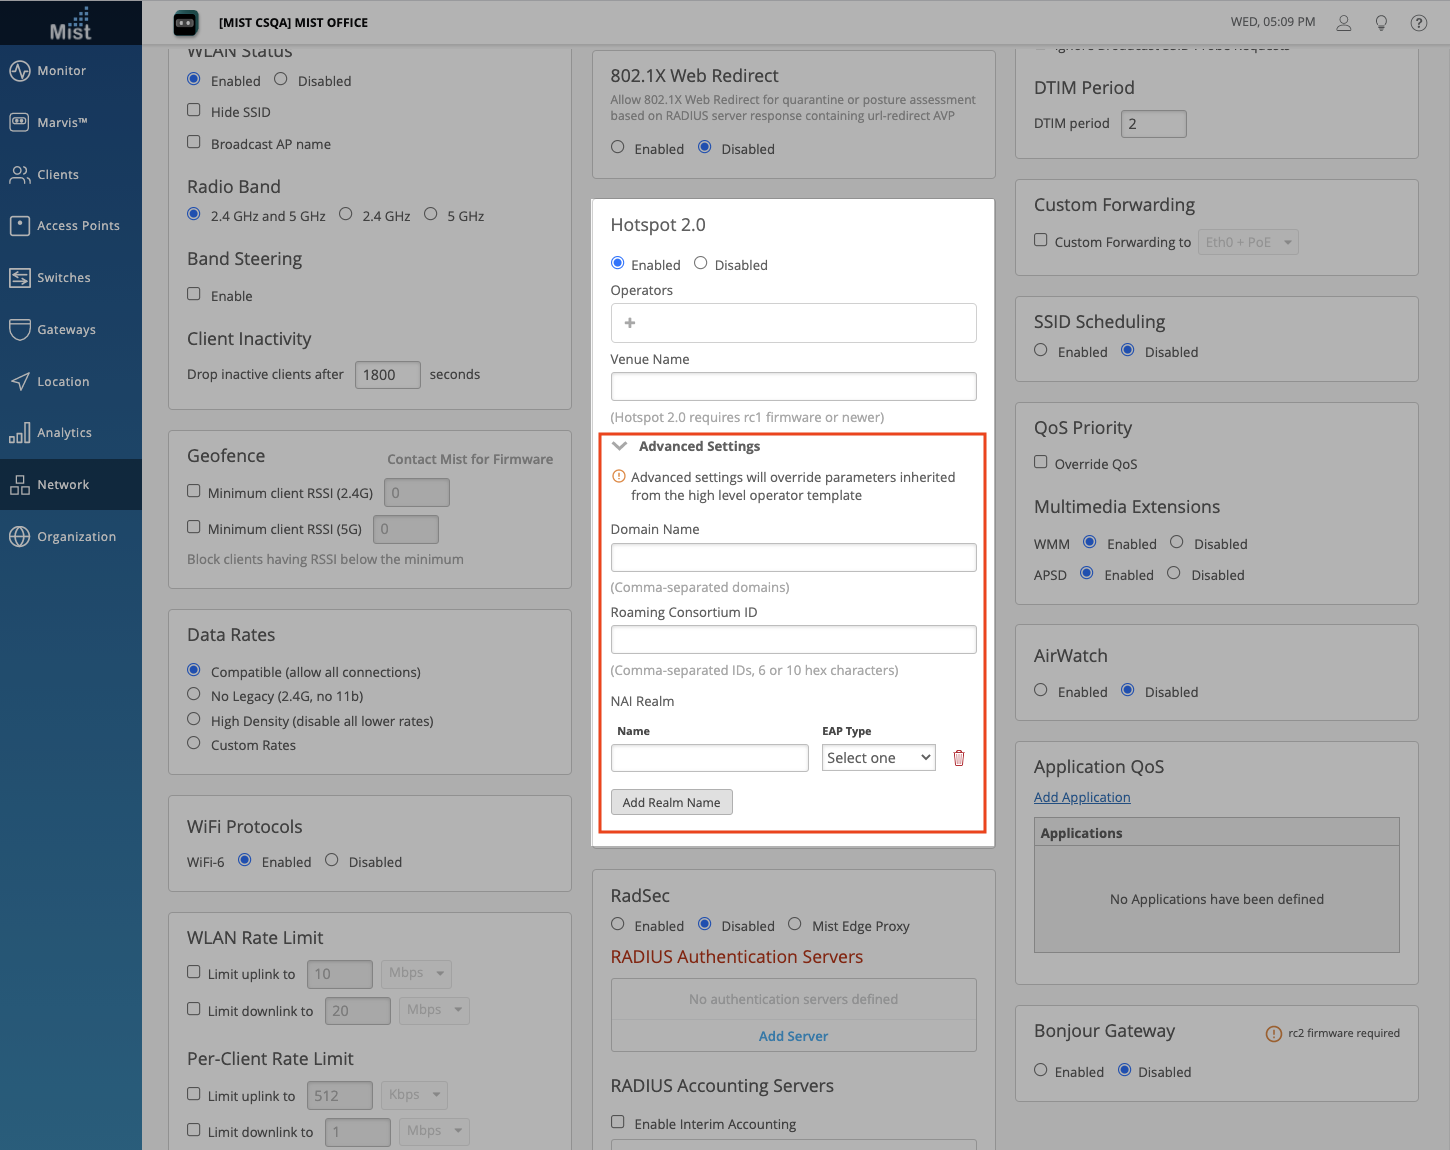
Please note that configuring these advanced settings will override parameters inherited from the high level operator template.
To learn more about Hotspot 2.0, please refer to this page: https://www.juniper.net/documentation/us/en/software/mist/mist-wireless/topics/task/hotspot.html
Persistent (Sticky) MAC is a Layer 2 port security feature that prevents unauthorized devices from connecting to your network. When this feature is enabled, the switch will observe the incoming source MAC addresses on a configured port and dynamically learn/save this address to memory. You can set the maximum number of MAC addresses learned. After the maximum limit is reached, any device attempting to connect to the port will have their frames dropped and logged.
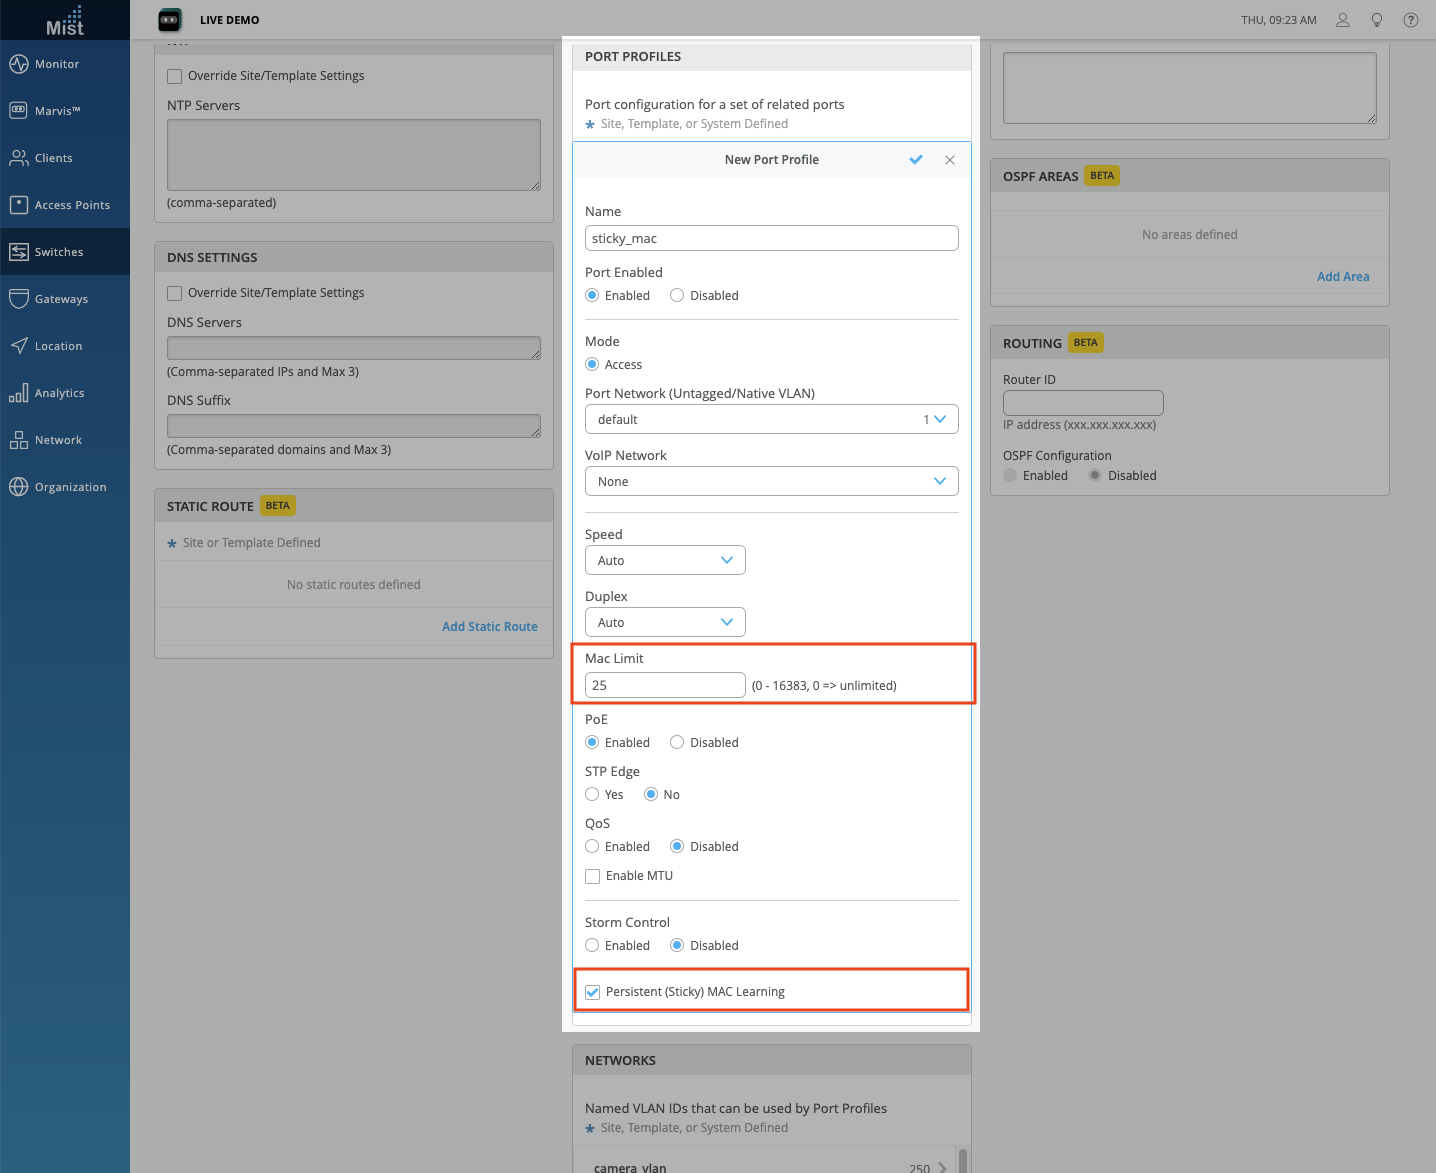
To configure Persistent MAC learning, navigate to your Switch Details page and configure a Mac Limit in your port profile. This is the maximum number of MAC addresses that will be learned. Make sure to enable Persistent (Sticky) MAC Learning at the bottom.
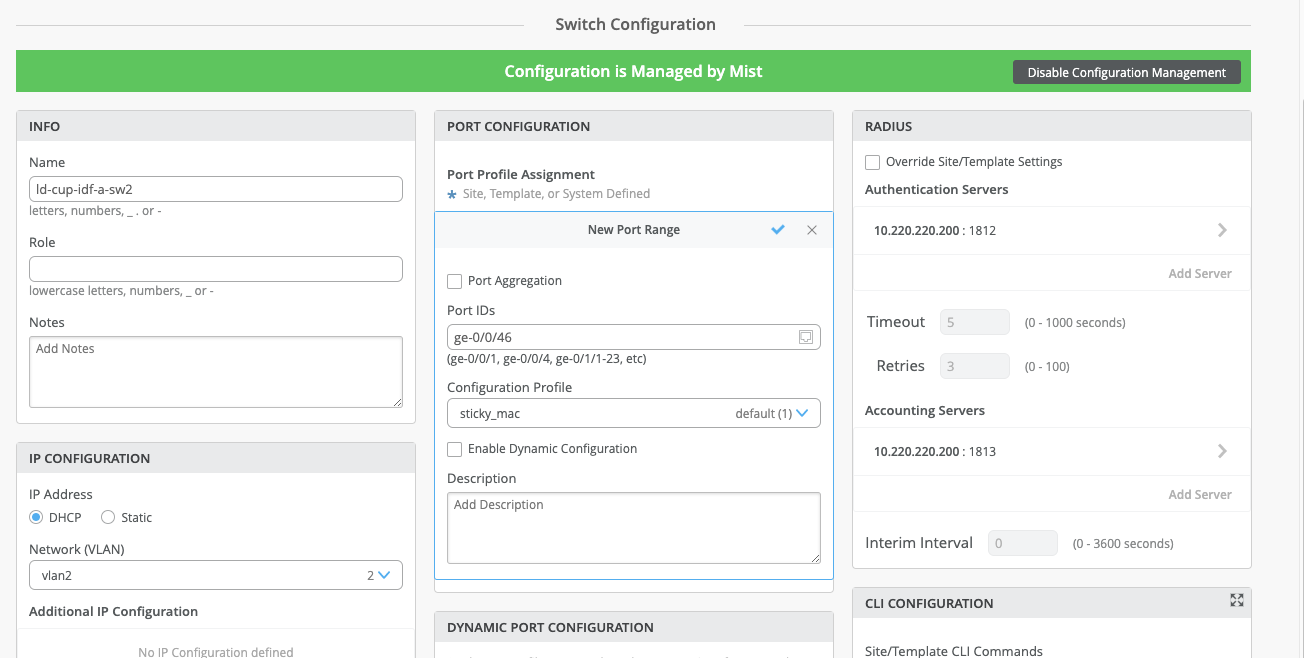
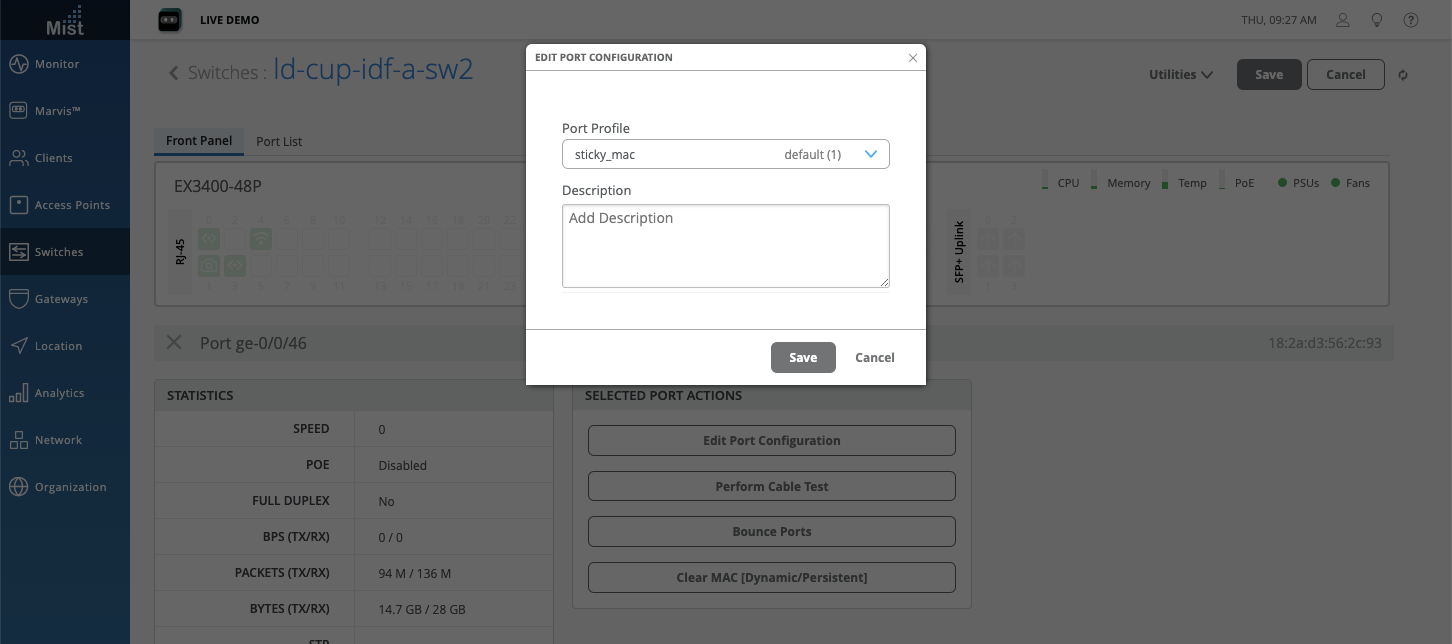
Map this port profile to your desired port from either the Port Configuration section, or directly from the switch front panel UI (Select port, Edit Port Configuration).
OR
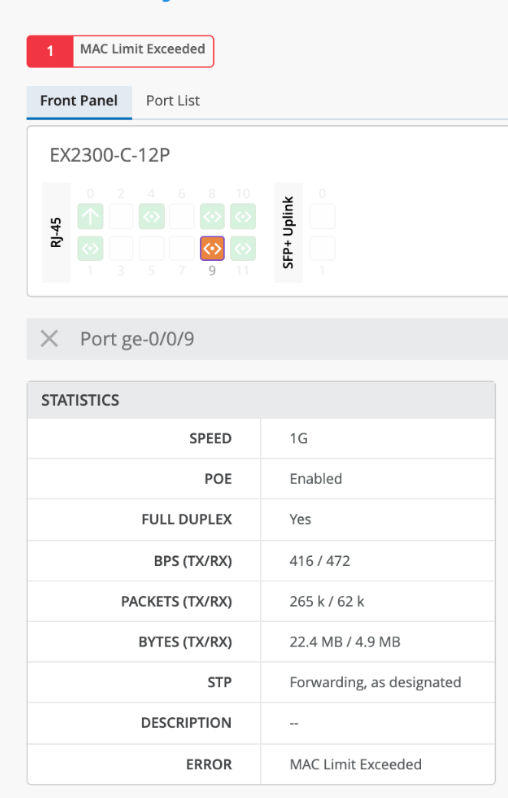
If the maximum number of MACs have already been learned, then the frames are dropped and logged for any additional MACs. You will see a warning on the switch page and a corresponding event on the Insights dashboard when the MAC limit is exceeded:

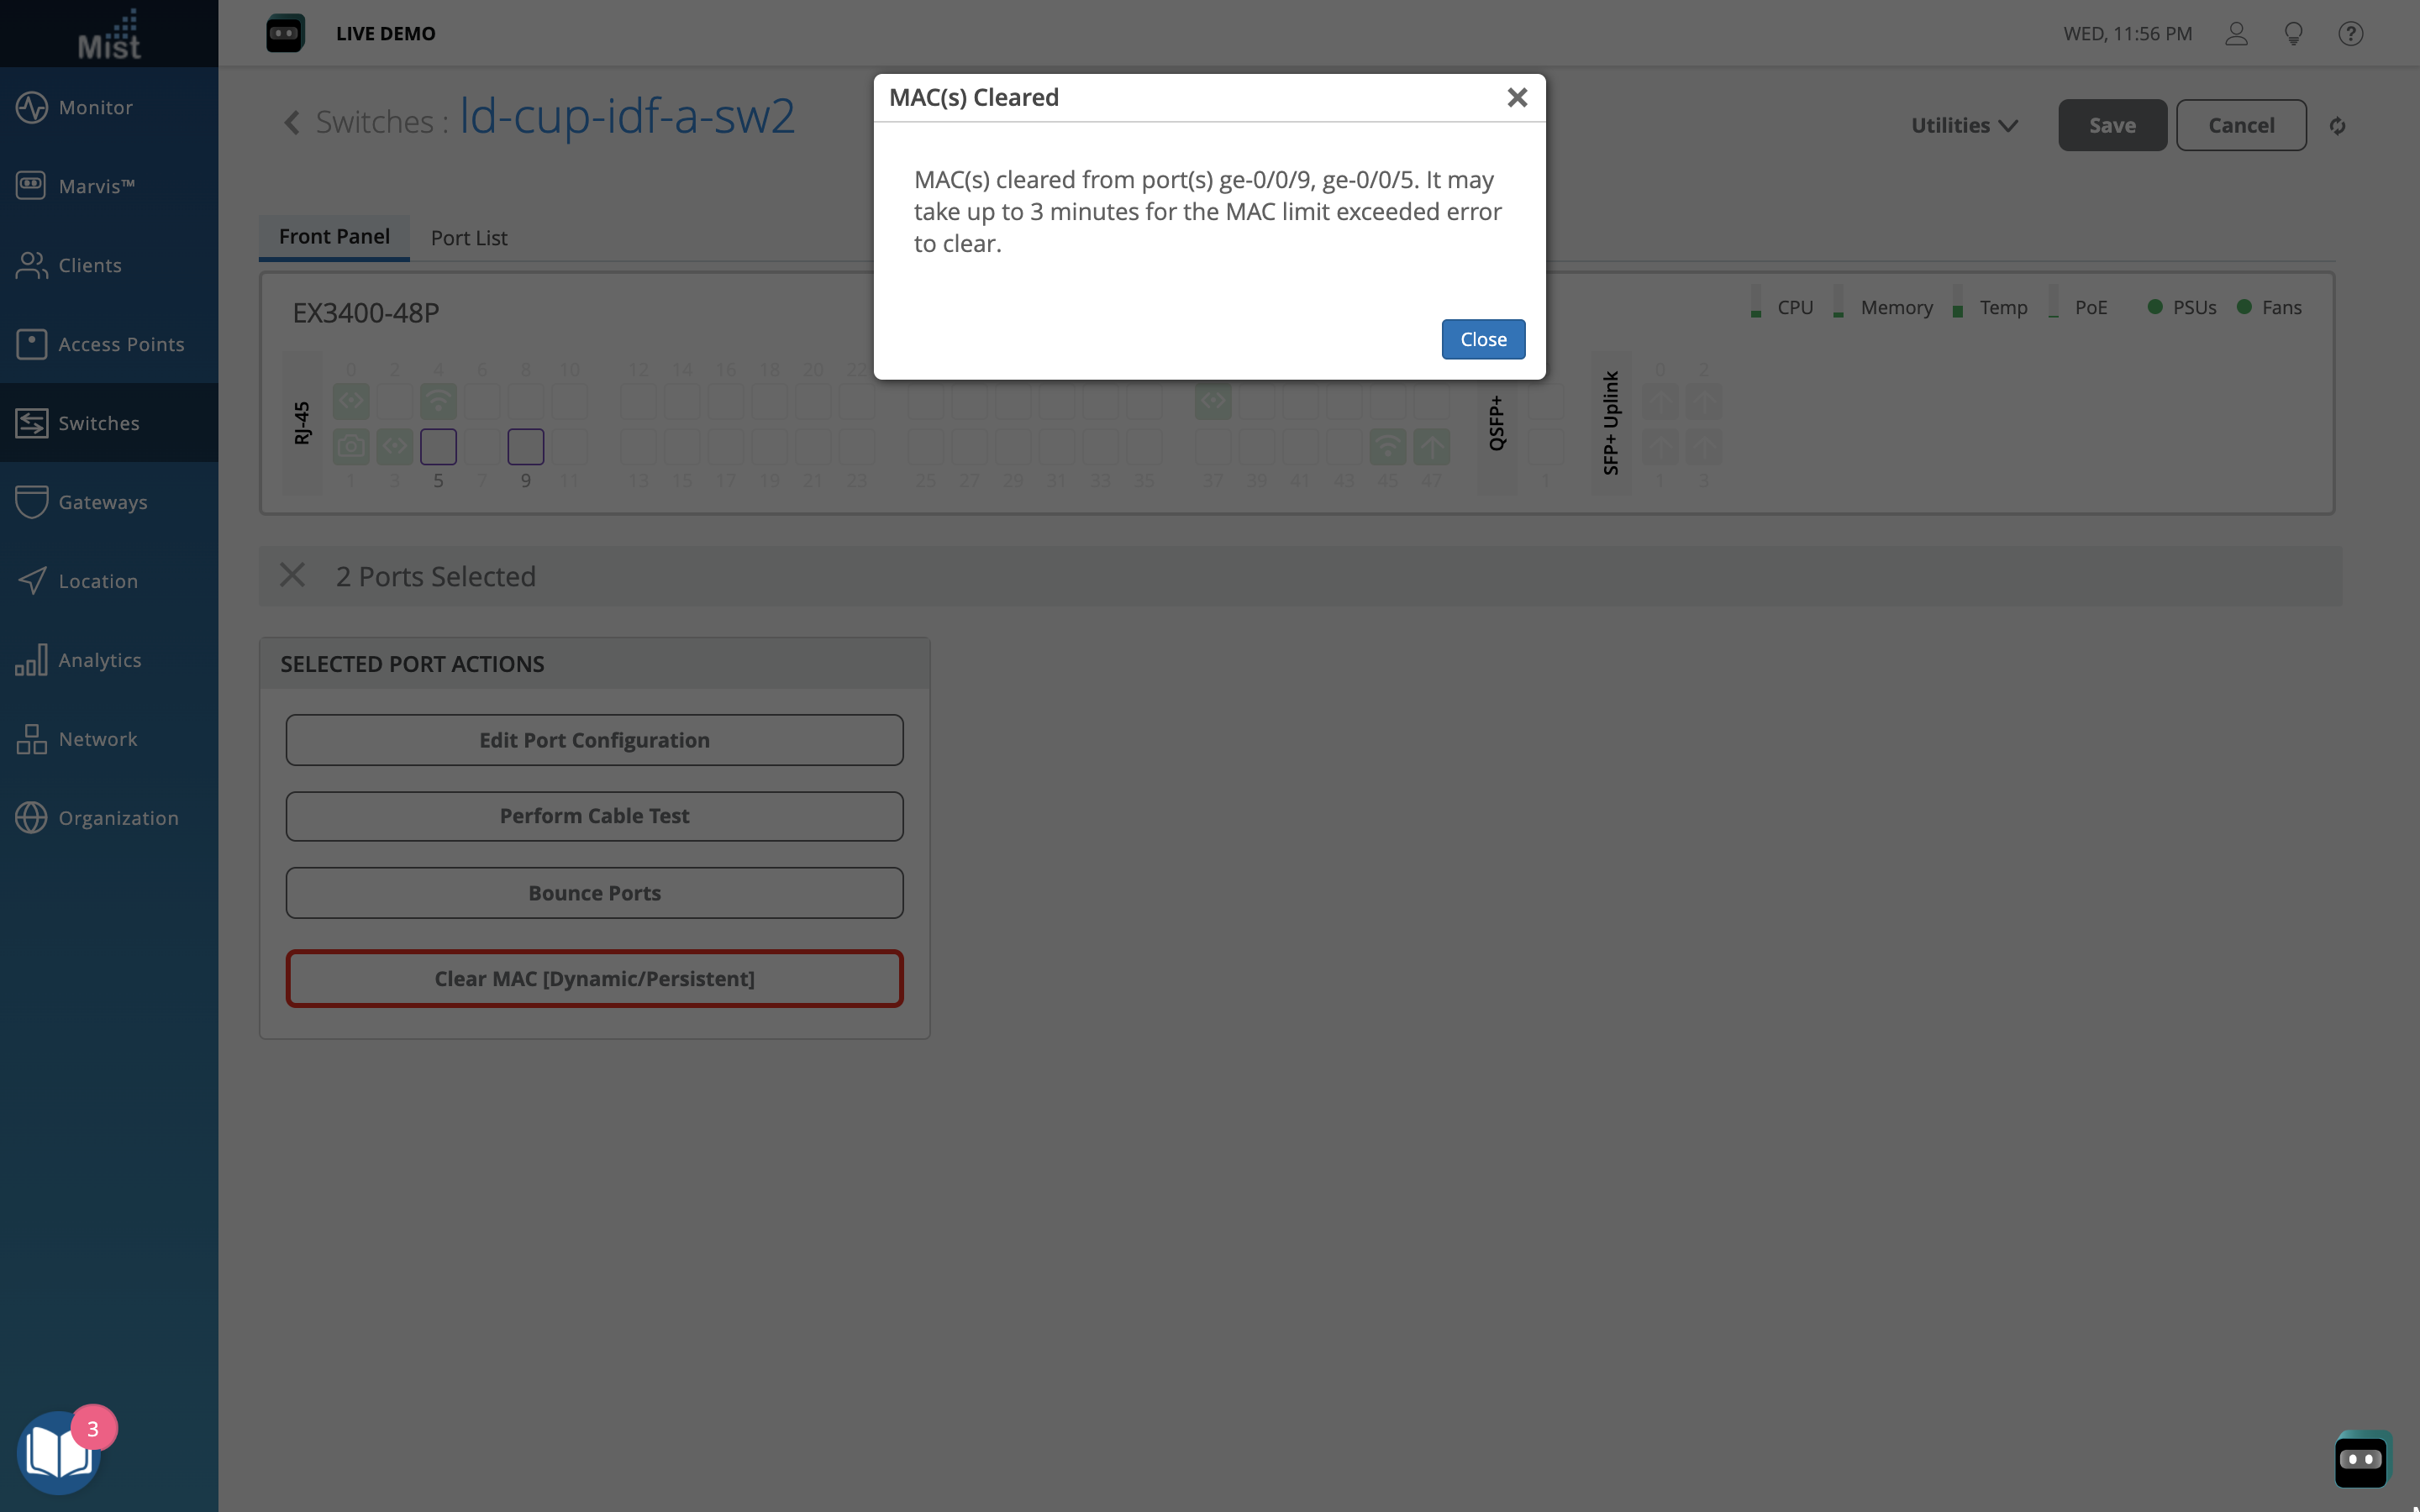
To clear out all dynamically learned MAC addresses, select your ports from the switch front panel and choose the Clear MAC (Dynamic/Persistent) option in the Port Actions. The action will take approximately 3 minutes, and after that your learned MACs will be cleared. Please note that if during the reset a device is still connected on the interface, its MAC address will be dynamically learned after a few minutes.

To learn more about Persistent MAC Learning, please visit this page: https://www.juniper.net/documentation/us/en/software/mist/mist-wired/topics/reference/switch-config-options.html
WAN Assurance is now available for everyone as a GA feature! Explore the WAN SLEs and the Gateways section in the Marvis Action Dashboard. We are also introducing a new Application Health SLE as a part of WAN Assurance. Keep reading to find out more.
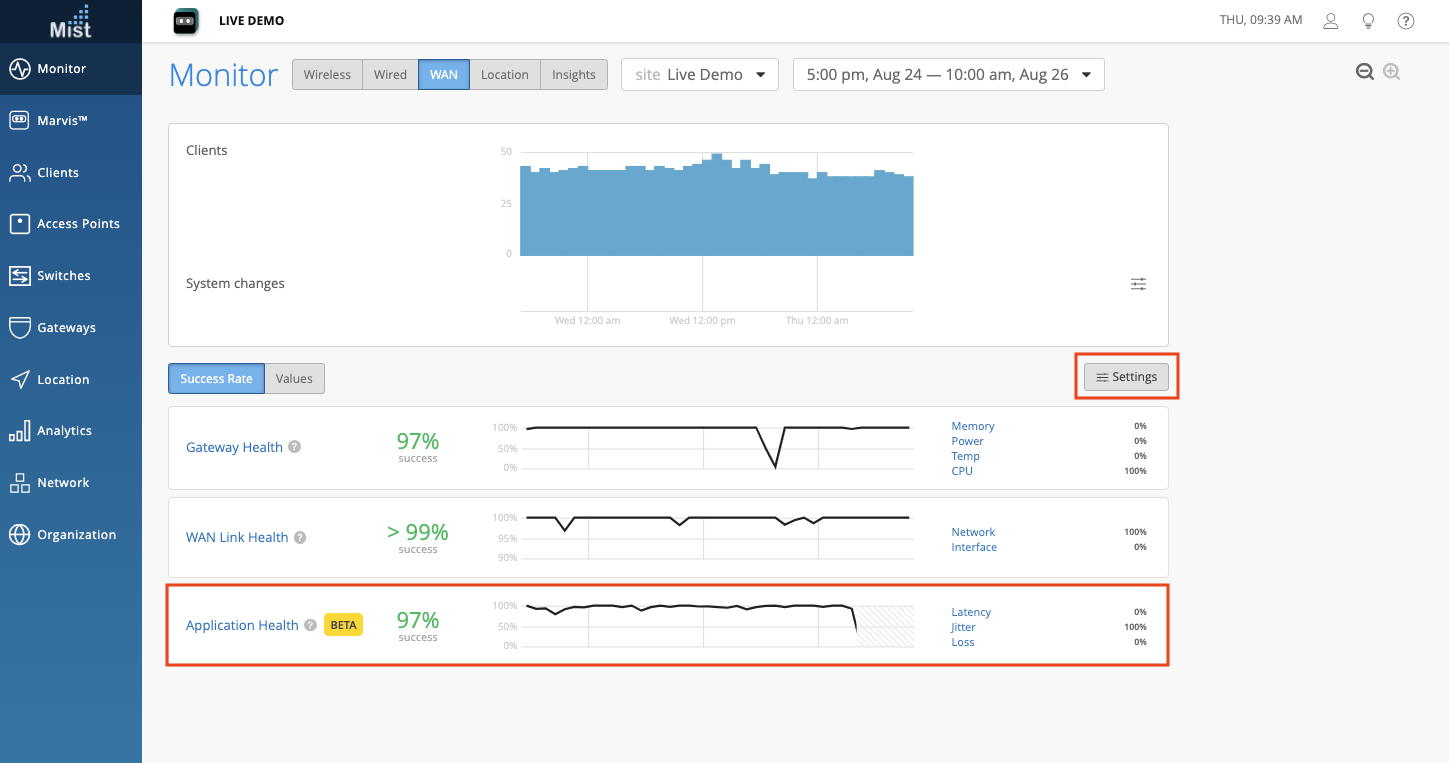
We are excited to announce a Beta release of the Application Health SLE! The goal of this WAN SLE is to measure the real-time network user experiences at the application level. For example, a weak network connection may give good user experiences for FTP or SMTP-based applications, but bad user experiences for VoIP applications. The Application Health SLE will help you identify which applications are giving you trouble.
To choose the applications you wish to monitor with this SLE, select the Settings button right above the list of SLEs and choose Application from the sidebar. Here, you may select your applications from our dropdown list. Here, we already have Webex and Zoom selected. Add or delete applications on your list as desired.
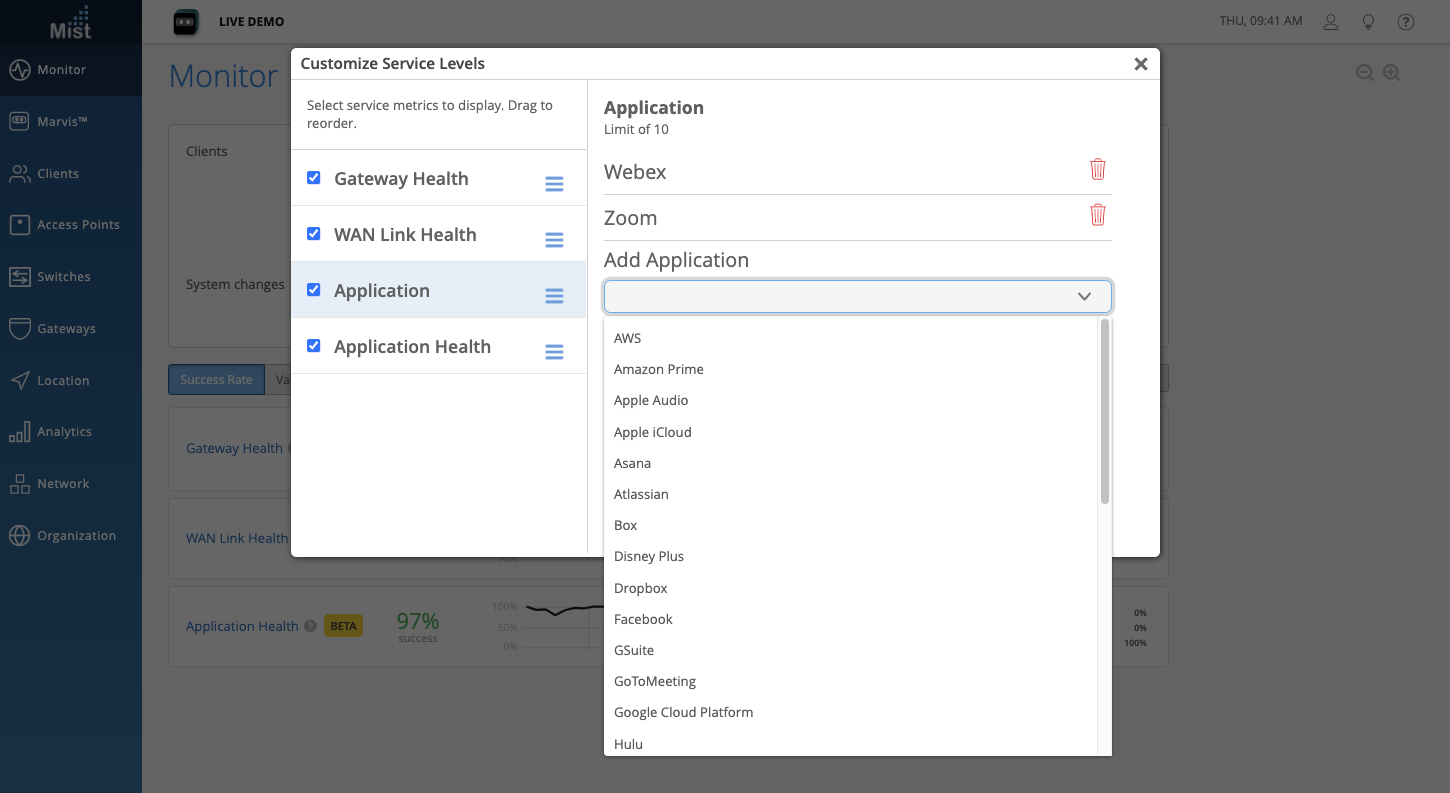
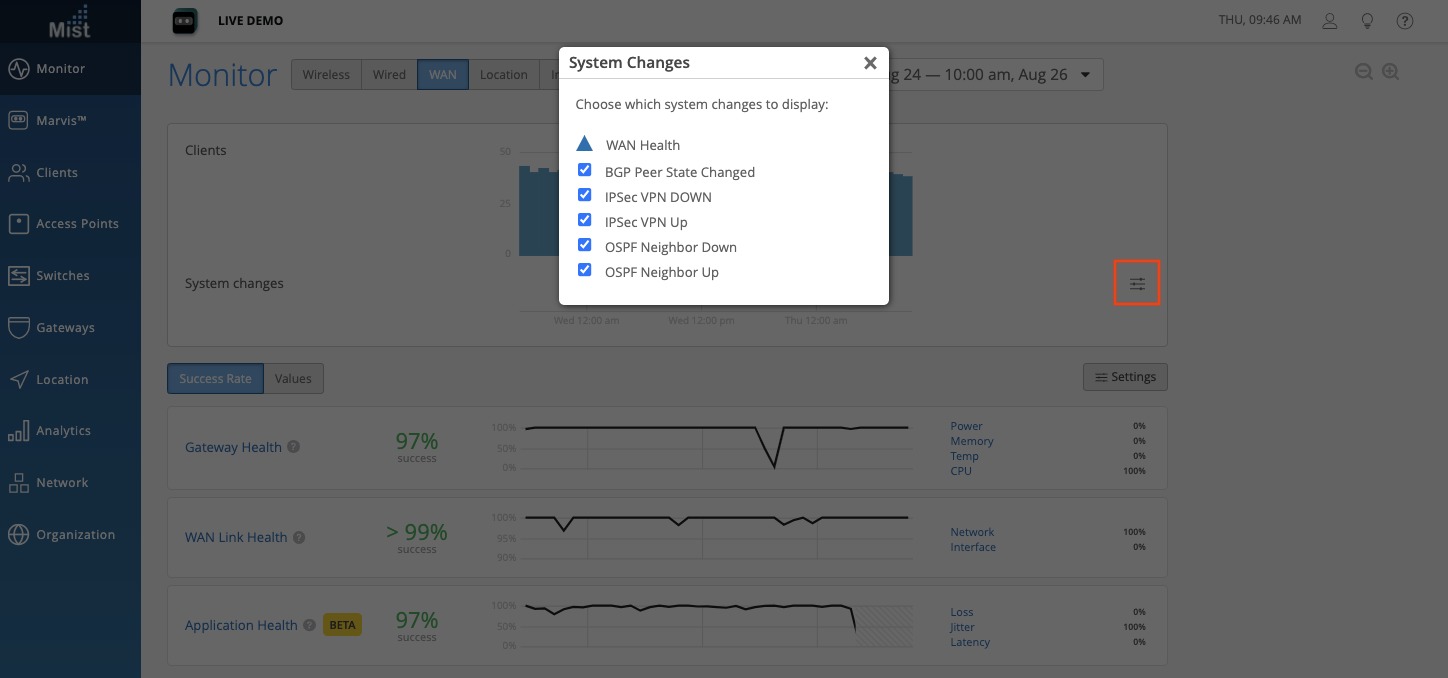
You may also choose which system changes to display in the System changes timeline view. Click on the hamburger menu button to customize to your liking.
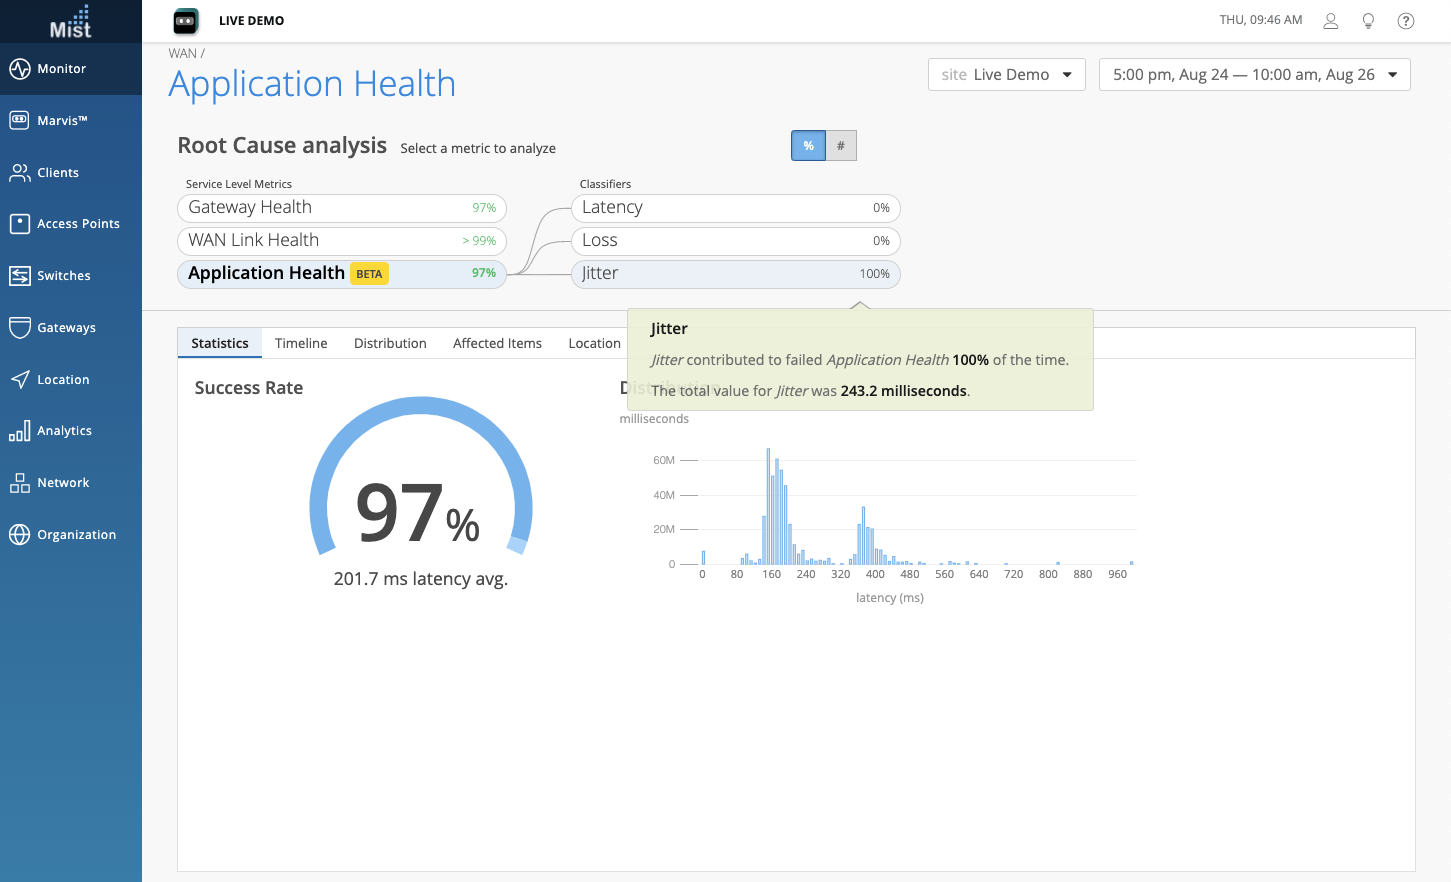
The Application Health SLE is tracked using three Classifiers: Loss, Jitter, and Latency. In this example, Jitter was the main cause of failures in Application Health:
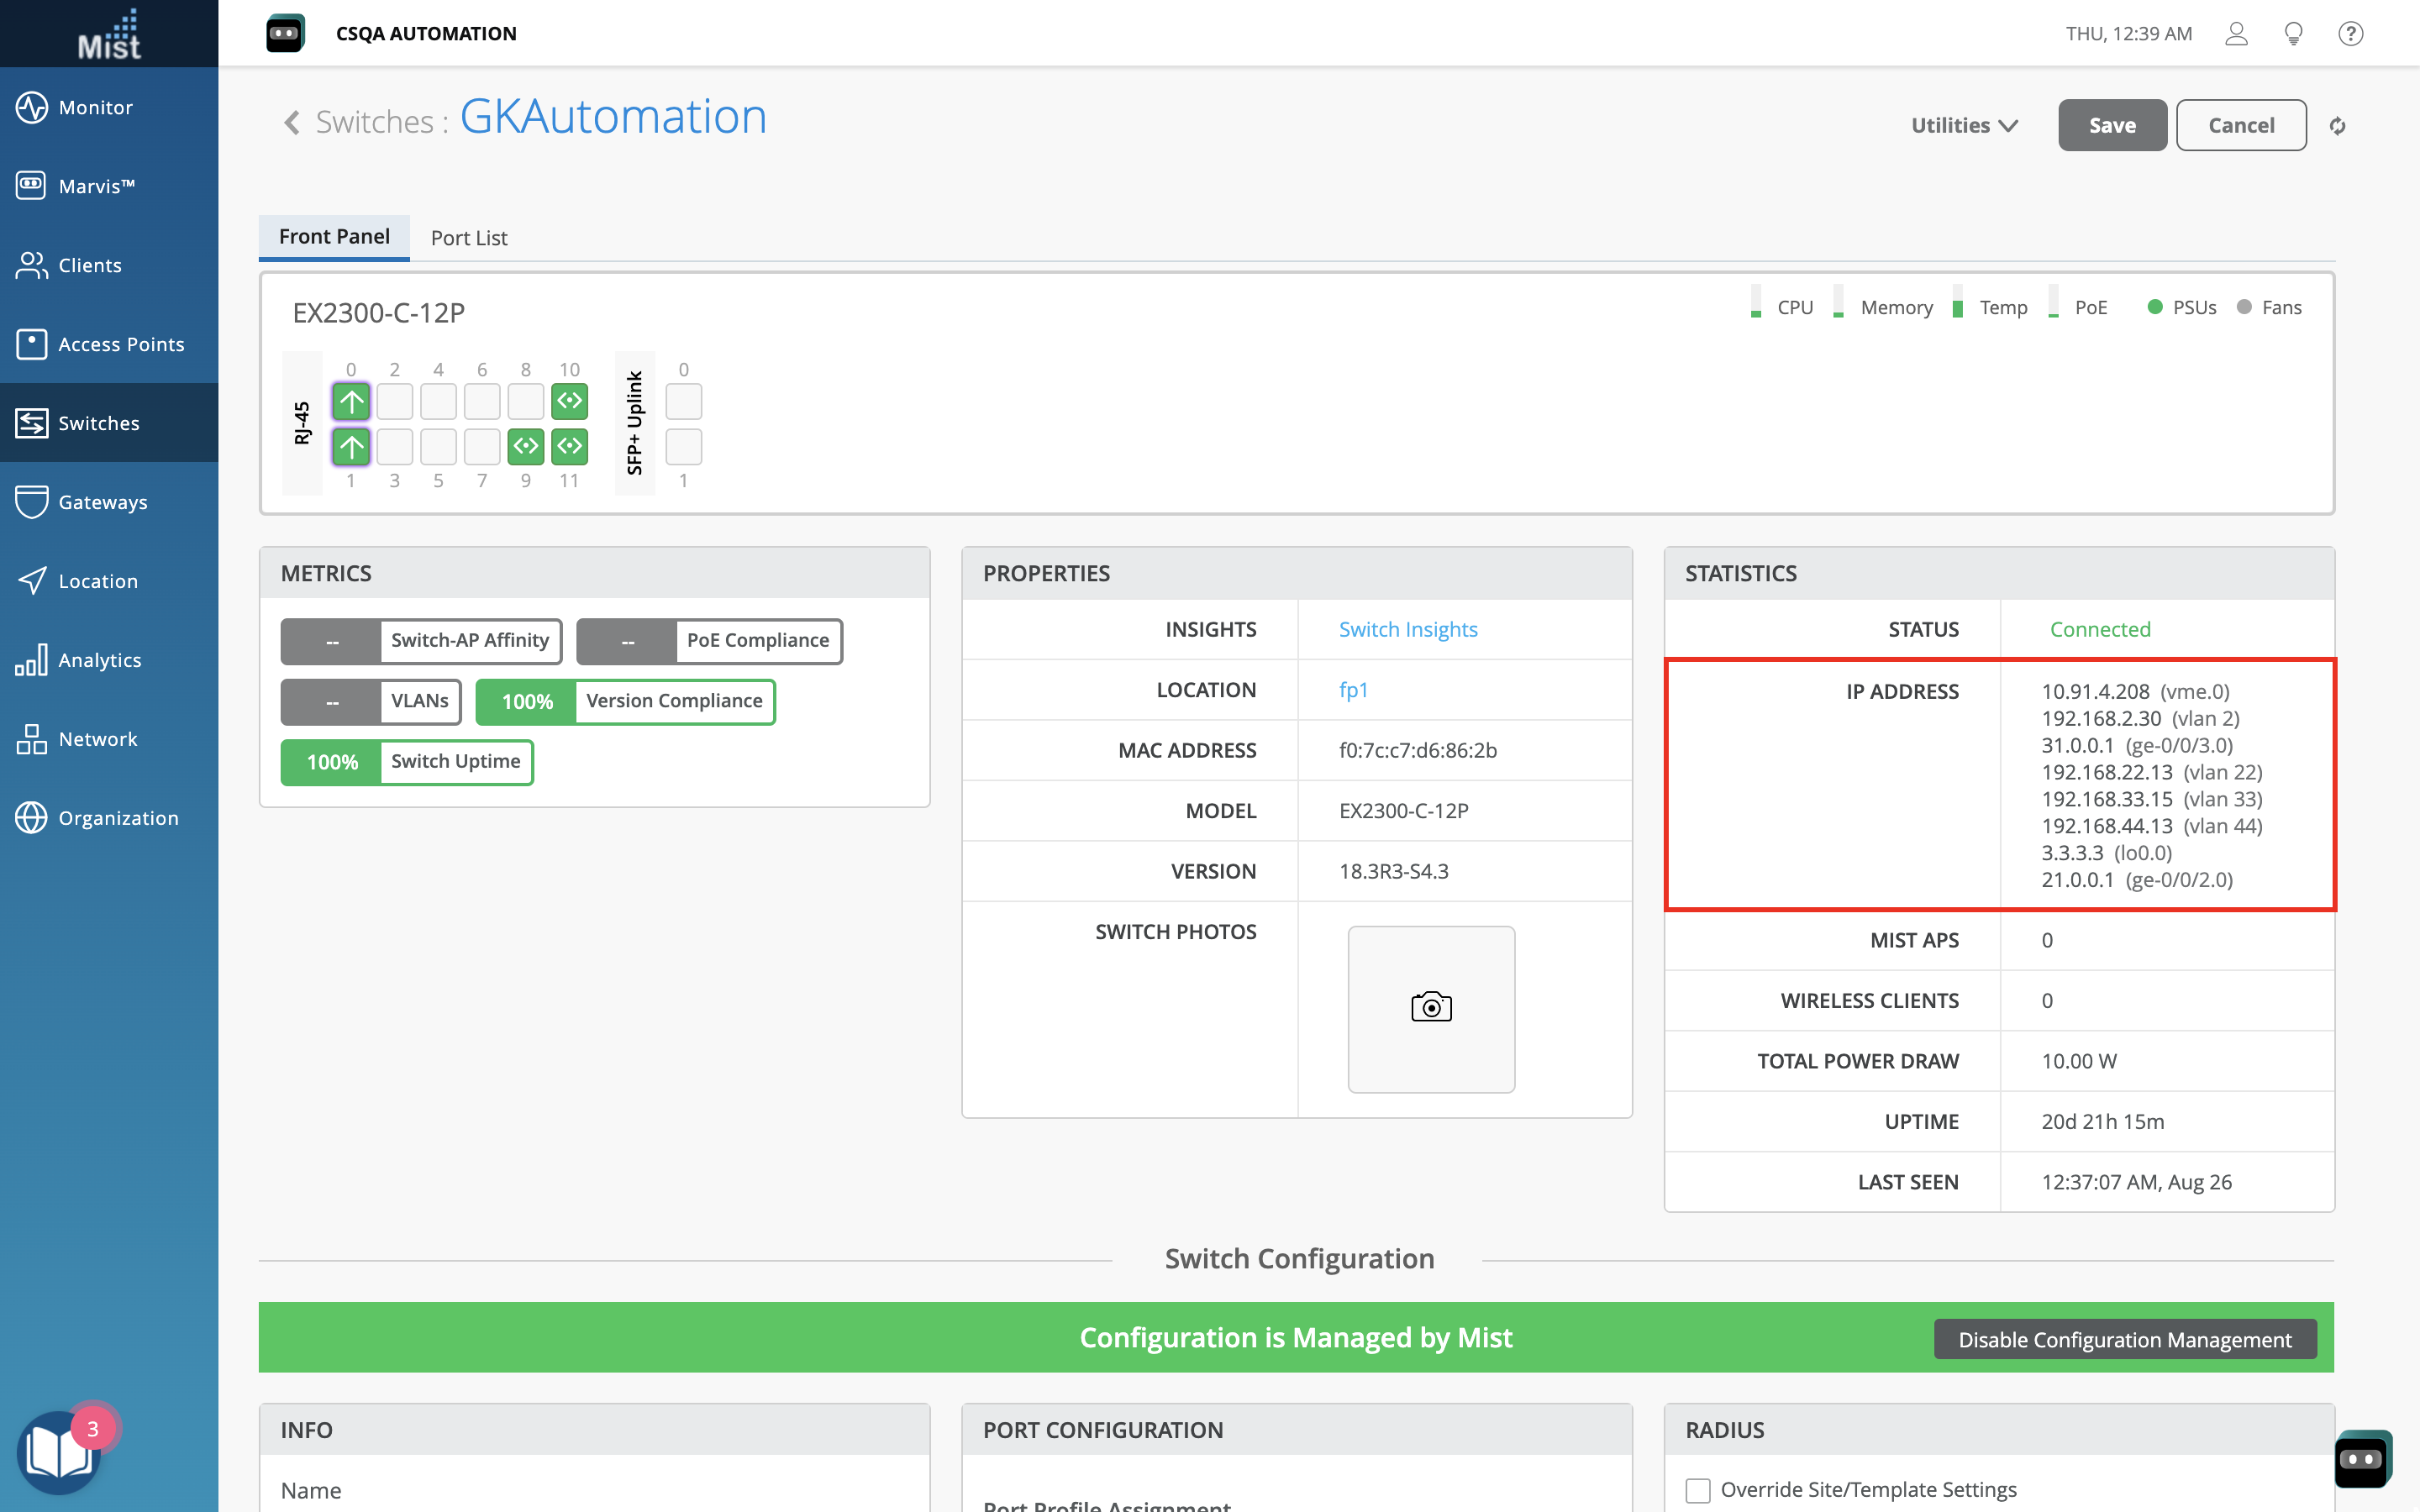
This week we fixed an issue where VLAN IDs were not being displayed properly for IRB interfaces.
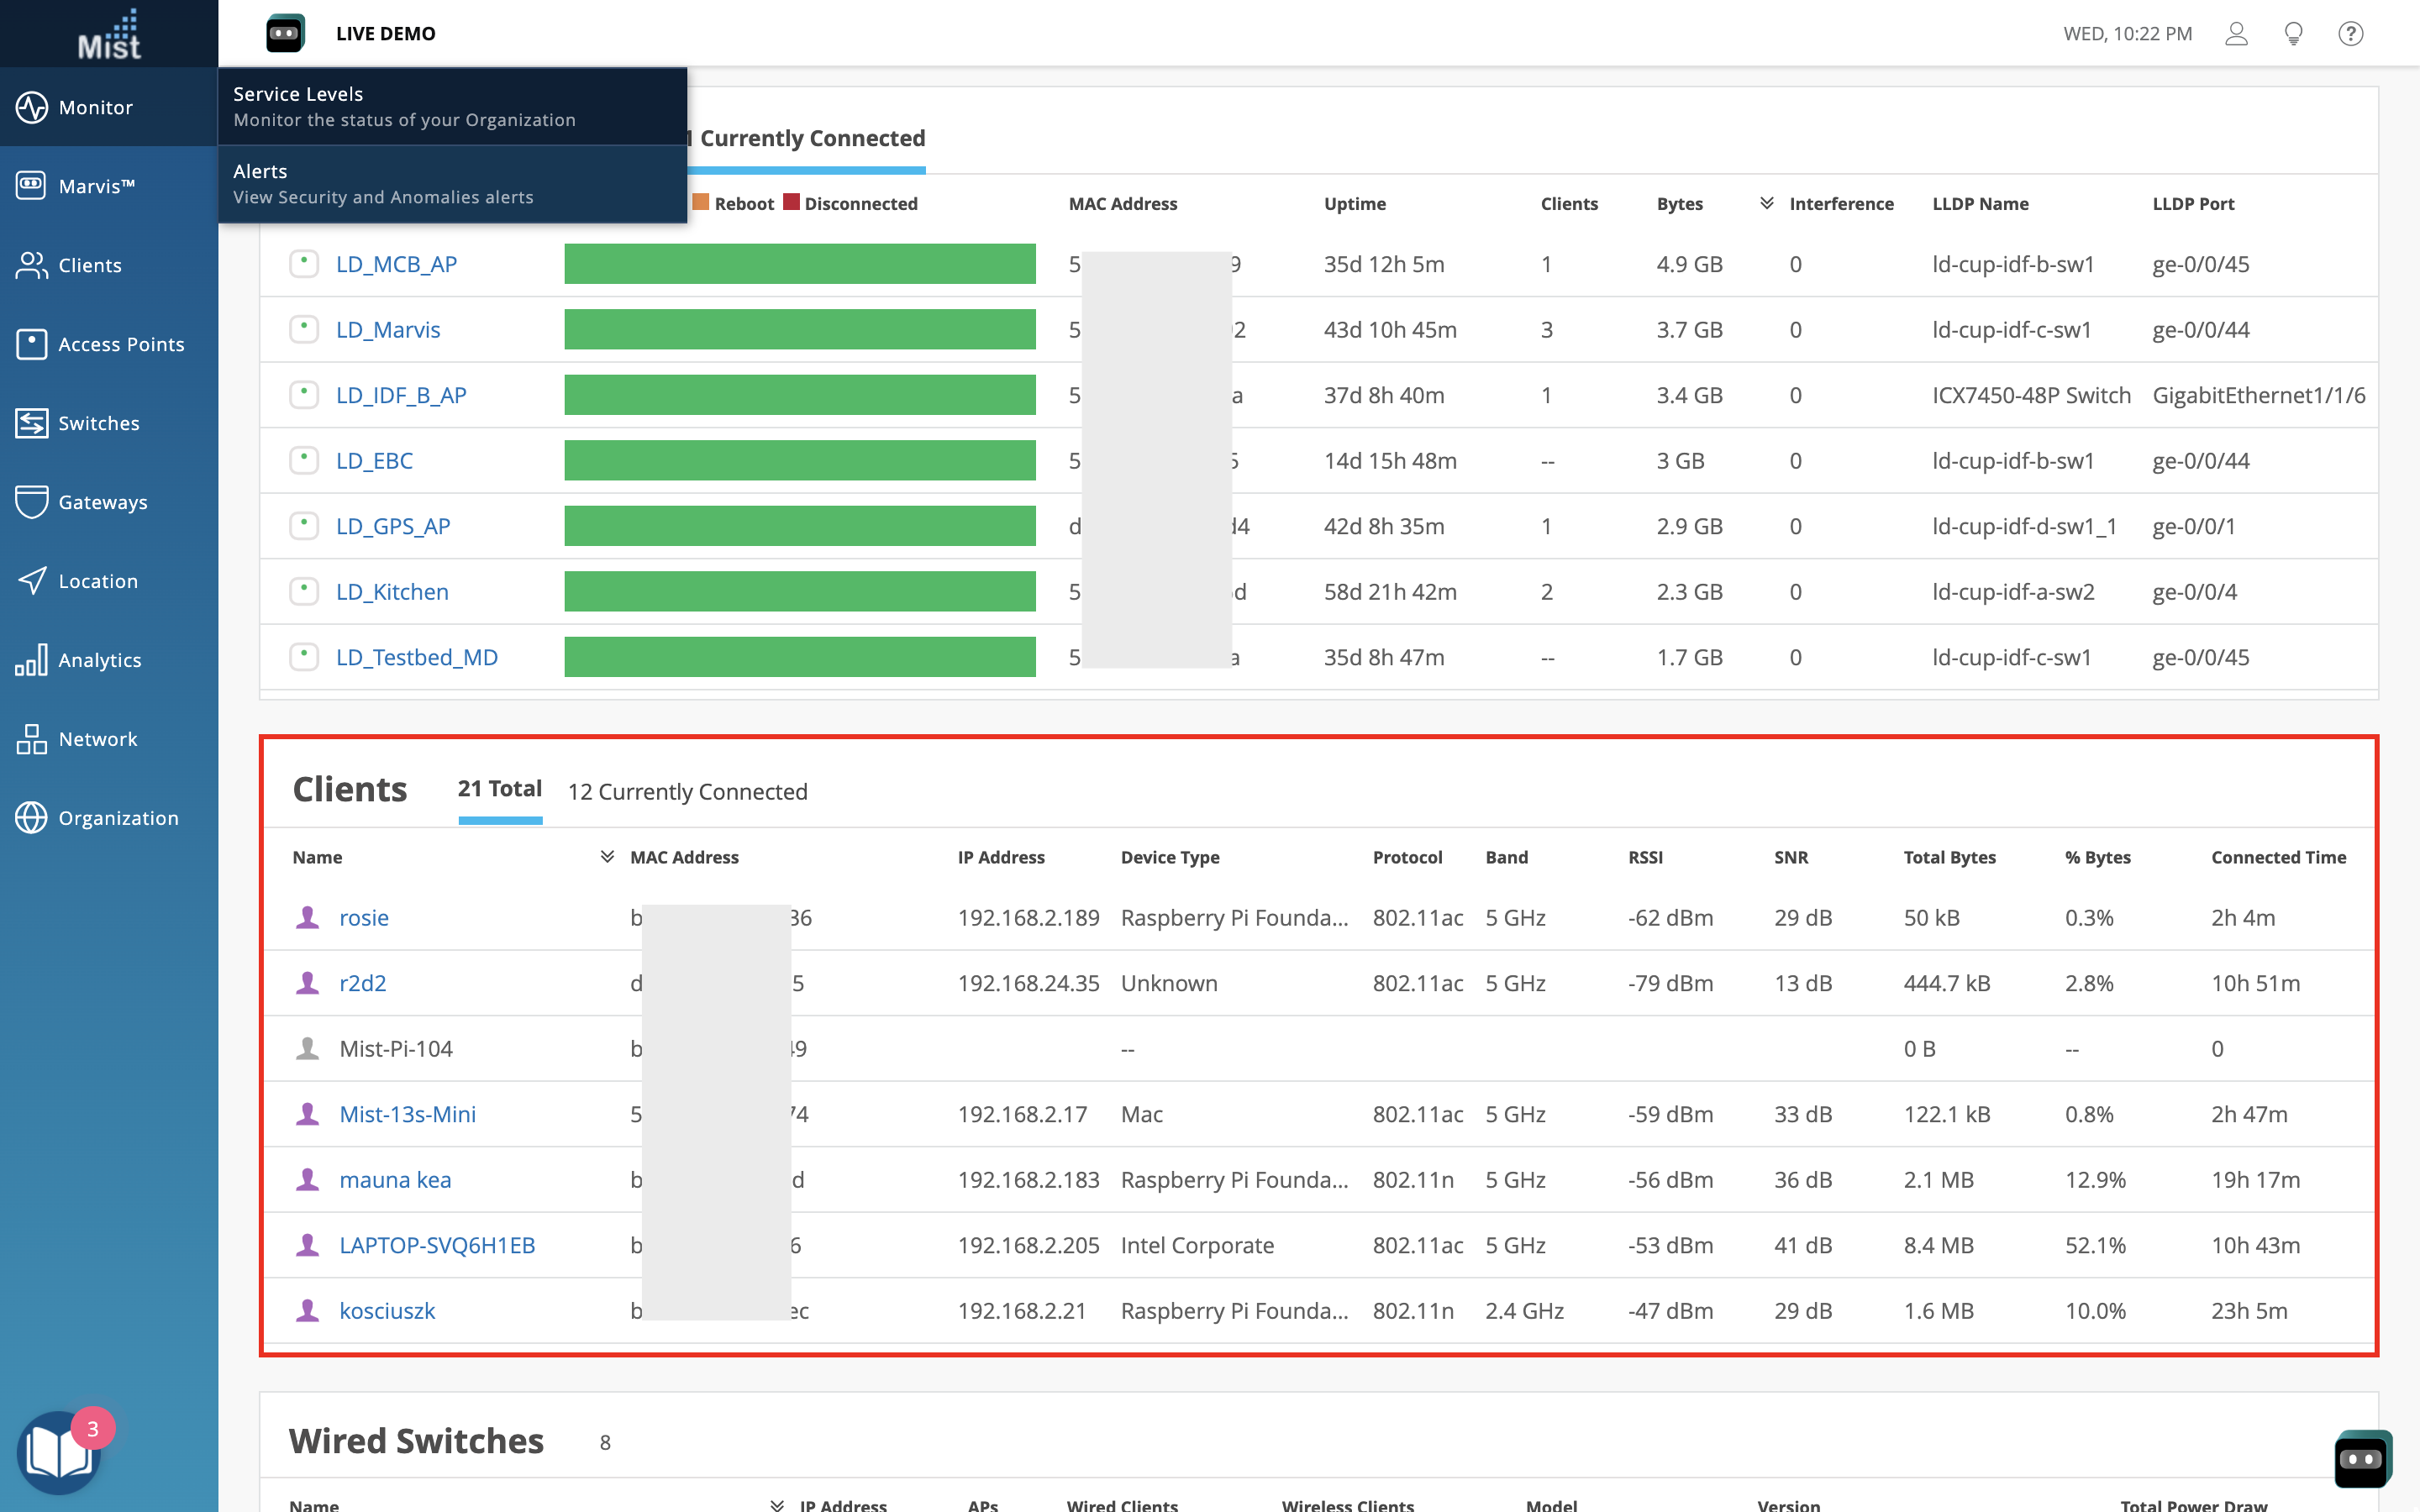
We are making some improvements to our Insights page by adding more columns in the Clients table. Now, you can find Protocol, Band, RSSI, and SNR information all in the same table for a detailed view of your clients. You can see these changes on both the Site and AP Insights pages (Monitor > Service Levels > Insights tab).
