Client Roaming Visualization
Gain additional insights by using the ROAMINGOF query to view the client roaming status.
Marvis provides a visualization of your device’s roaming history and behavior. It includes information about the access points (APs) and radio bands the device connects to, and the received signal strength indicator (RSSI) values of the connection. Marvis uses the data from Client Events to provide a visual of the path your device takes and its transitions between various APs. Marvis indicates a Bad roaming status when the RSSI is low and a warning roaming status when the client switches to a different radio band or wireless LAN (WLAN) while roaming.
You need to use the Marvis query (ROAMINGOF) to view the client roaming status. If you want to get a more detailed view of the visualization, you can zoom in. Use the magnifier buttons on the top right of the timeline or click and drag your cursor in a particular section to zoom in on a specific time interval.
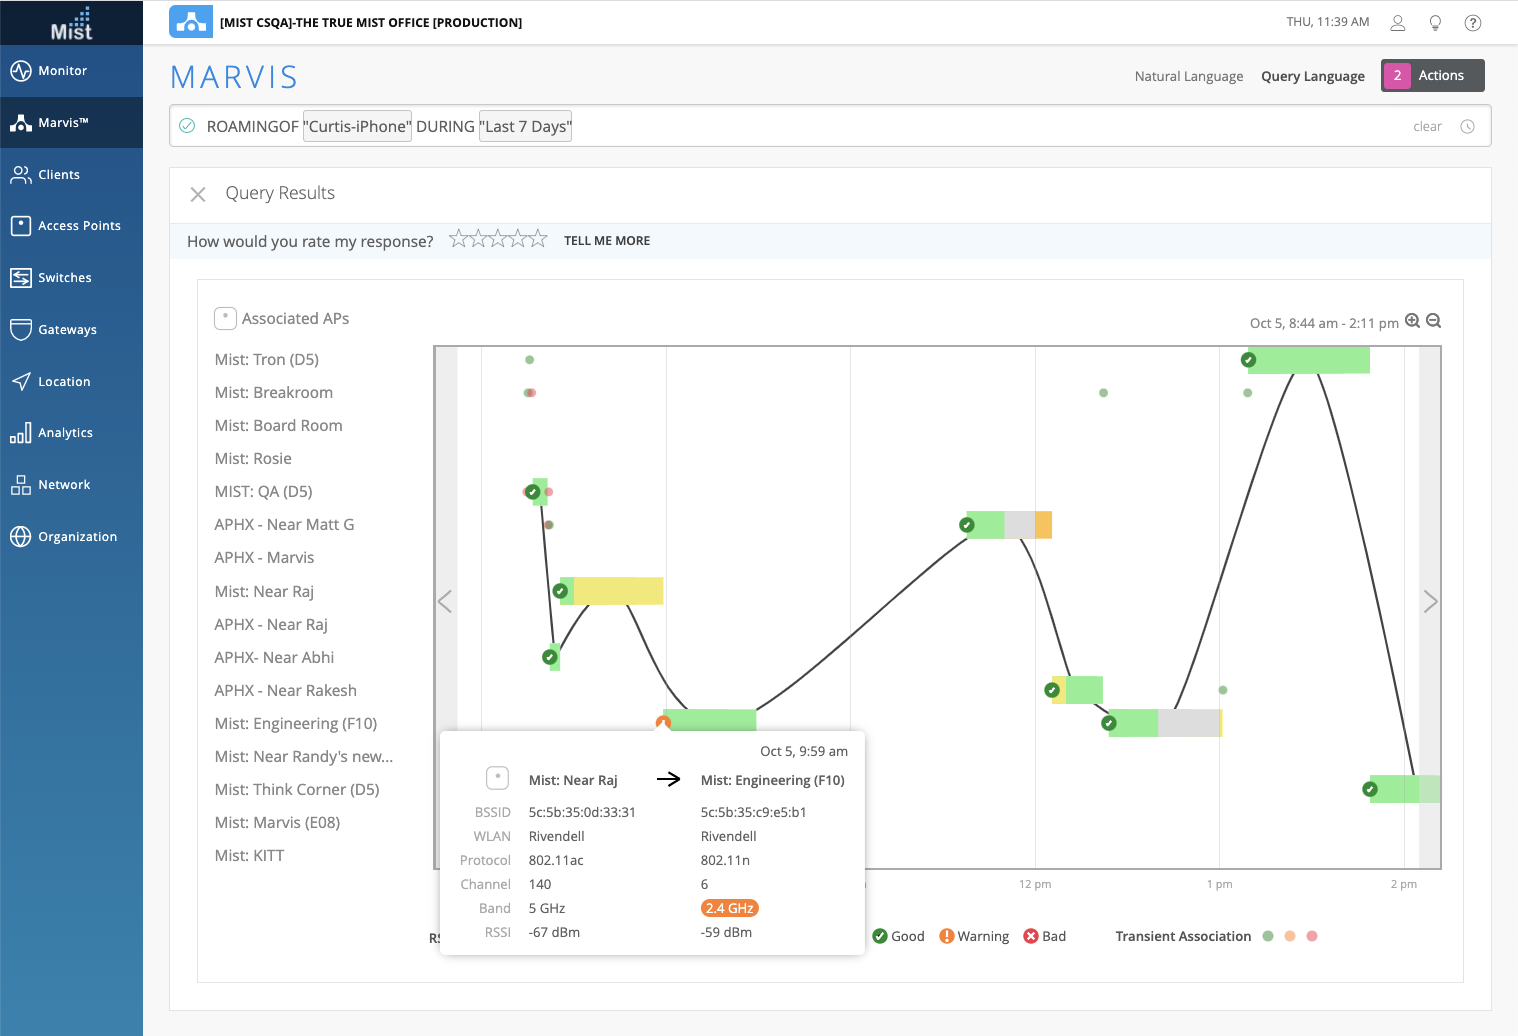
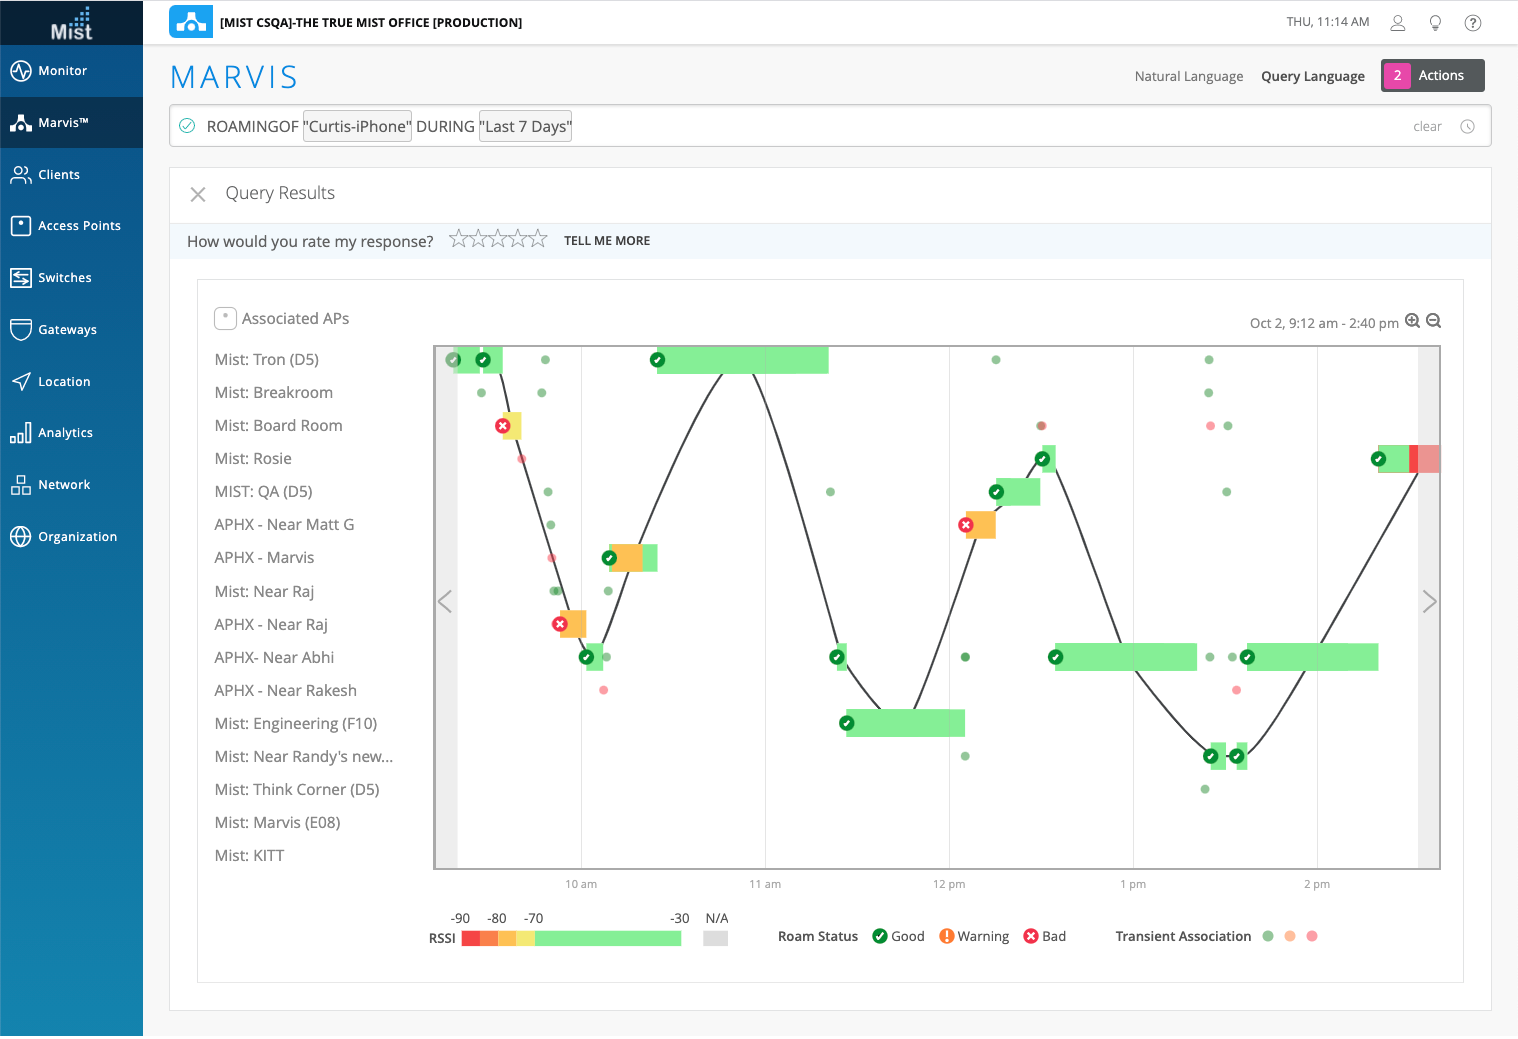
Marvis highlights information such as the roaming status, RSSI value, and transitions, to improve troubleshooting. The dots you see in this screenshot indicate Transient Associations, which means that the device was associated with the AP for a very short time.
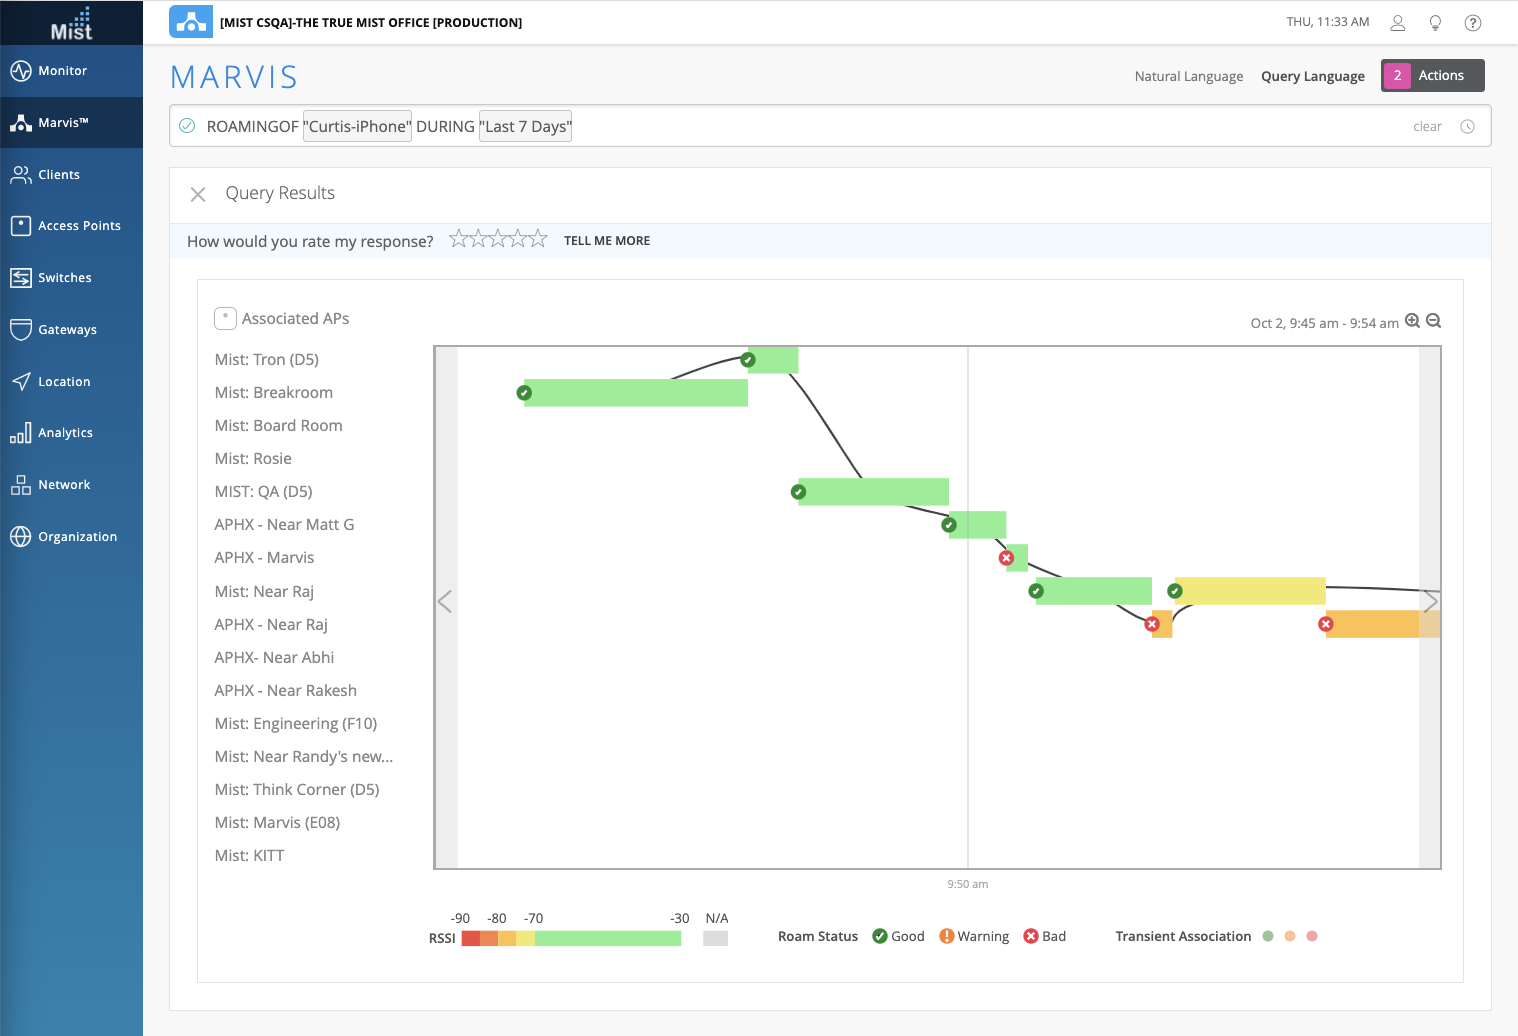
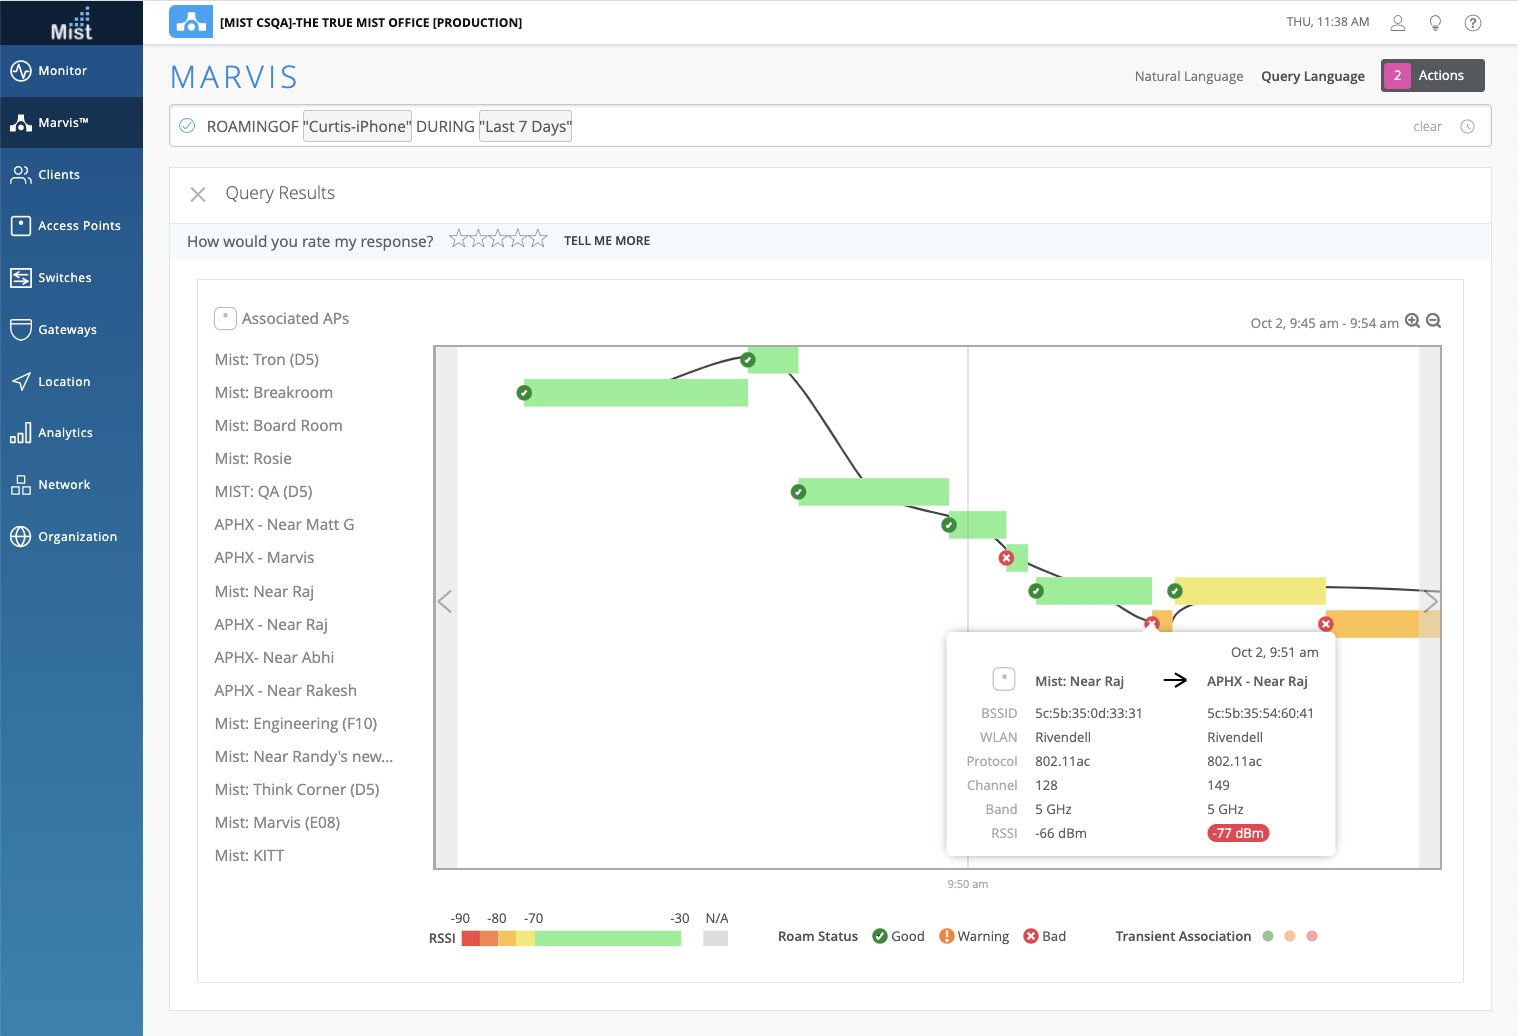
Here is a zoomed-in view of transient associations in the 9:45 a.m. – 9:54 a.m. time interval.
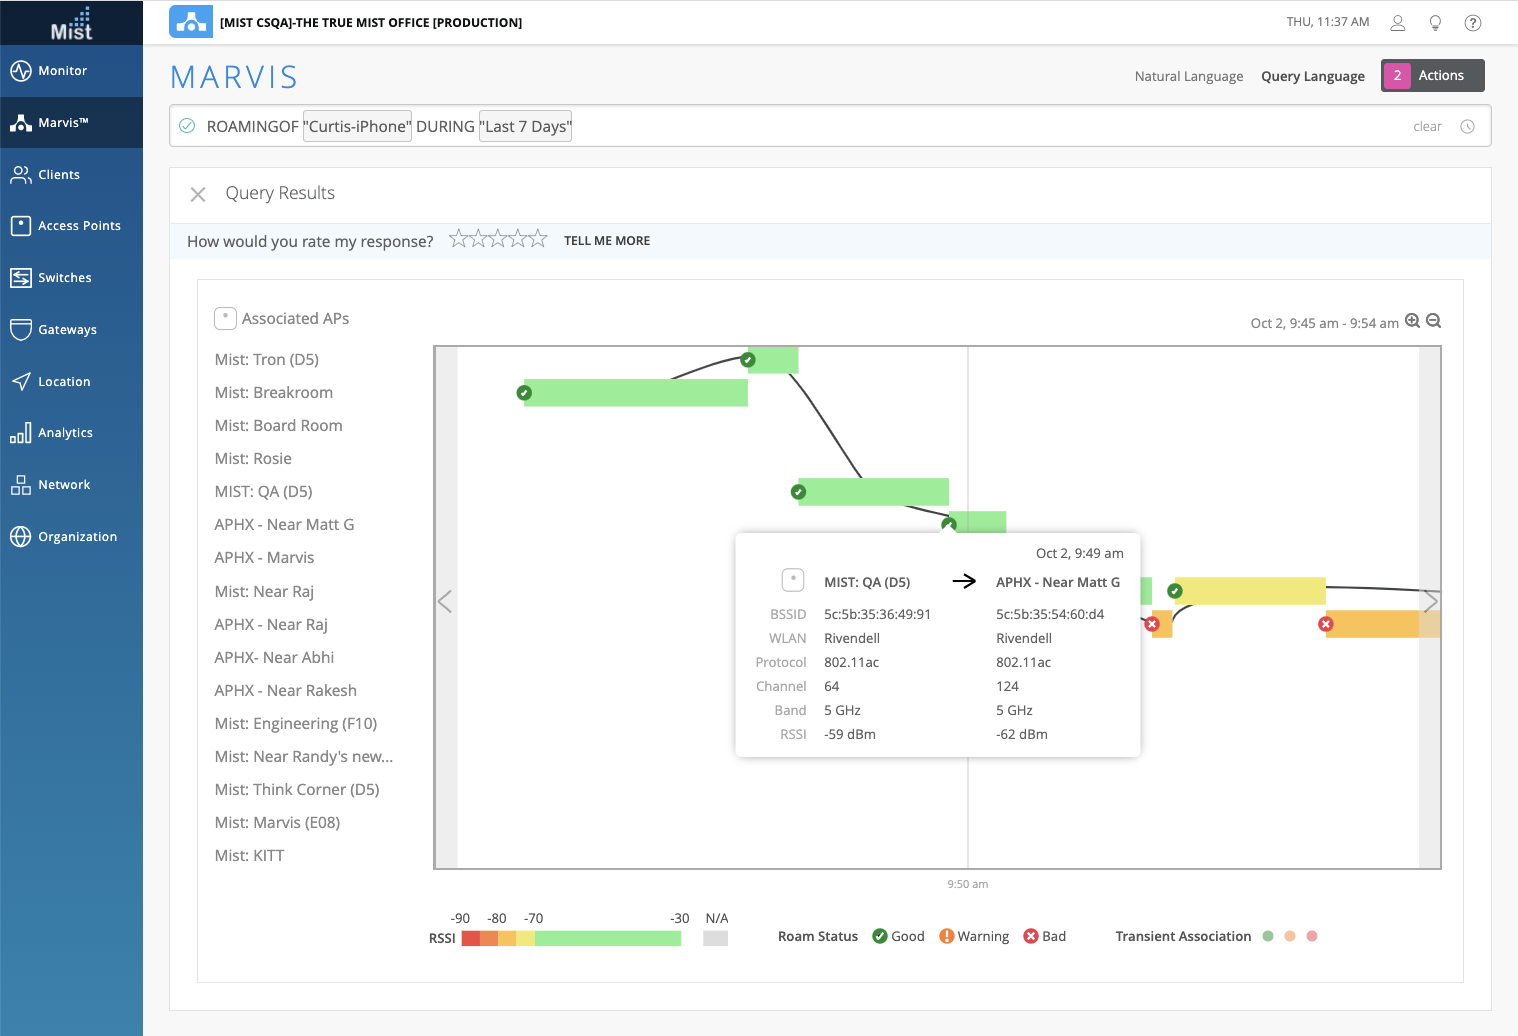
You can hover over the roaming status icons on the timeline to view detailed information about the roaming event, such as the WLAN, channel, band, and RSSI. Here you can see that the client experienced a good roaming event between the APs at 9:49 a.m.
Here's an example of a bad roaming event. Notice that Marvis indicates a low RSSI for this event.
In the following screenshot, you can see that the client switched from the 5 GHz radio band to the 2.4 GHz band while roaming. Marvis displays the roaming status as Warning.