Peer Path Insights
Get insights into the status of peer paths at a site or organization level.
The Peer Path Insights dashboard provides insights into the peer paths across an organization. A peer path refers to a connection between SSR Series Routers over a WAN network to enable redundancy and optimal performance. In a large-scale deployment, this dashboard is useful to identify sites experiencing a high number of peer path issues.
Features
-
Provides insights into the peer path down events across sites in an organization.
-
Lists the top sites and peer paths experiencing path down events and duration of the events.
-
Provides a timeline analysis of the path down events.
Subscription Requirements for Peer Path Insights
You’ll need a WAN Assurance subscription for SSR Series Routers to view and use the Peer-Path Insights dashboard. For information about subscriptions, see Subscription Types for Juniper Mist.
Before You Begin
-
Refer to the Juniper Mist WAN Configuration Guide for the WAN configuration details.
-
Understand about WAN Service Level Experience (SLE).
-
Refer to Mist Premium Analytics Trial License to know about license requirements for Juniper Mist Premium Analytics.
- Become familiar with the options available on the Juniper Mist Premium Analytics dashboards. See Figure 3.
Peer Path Insights Dashboard
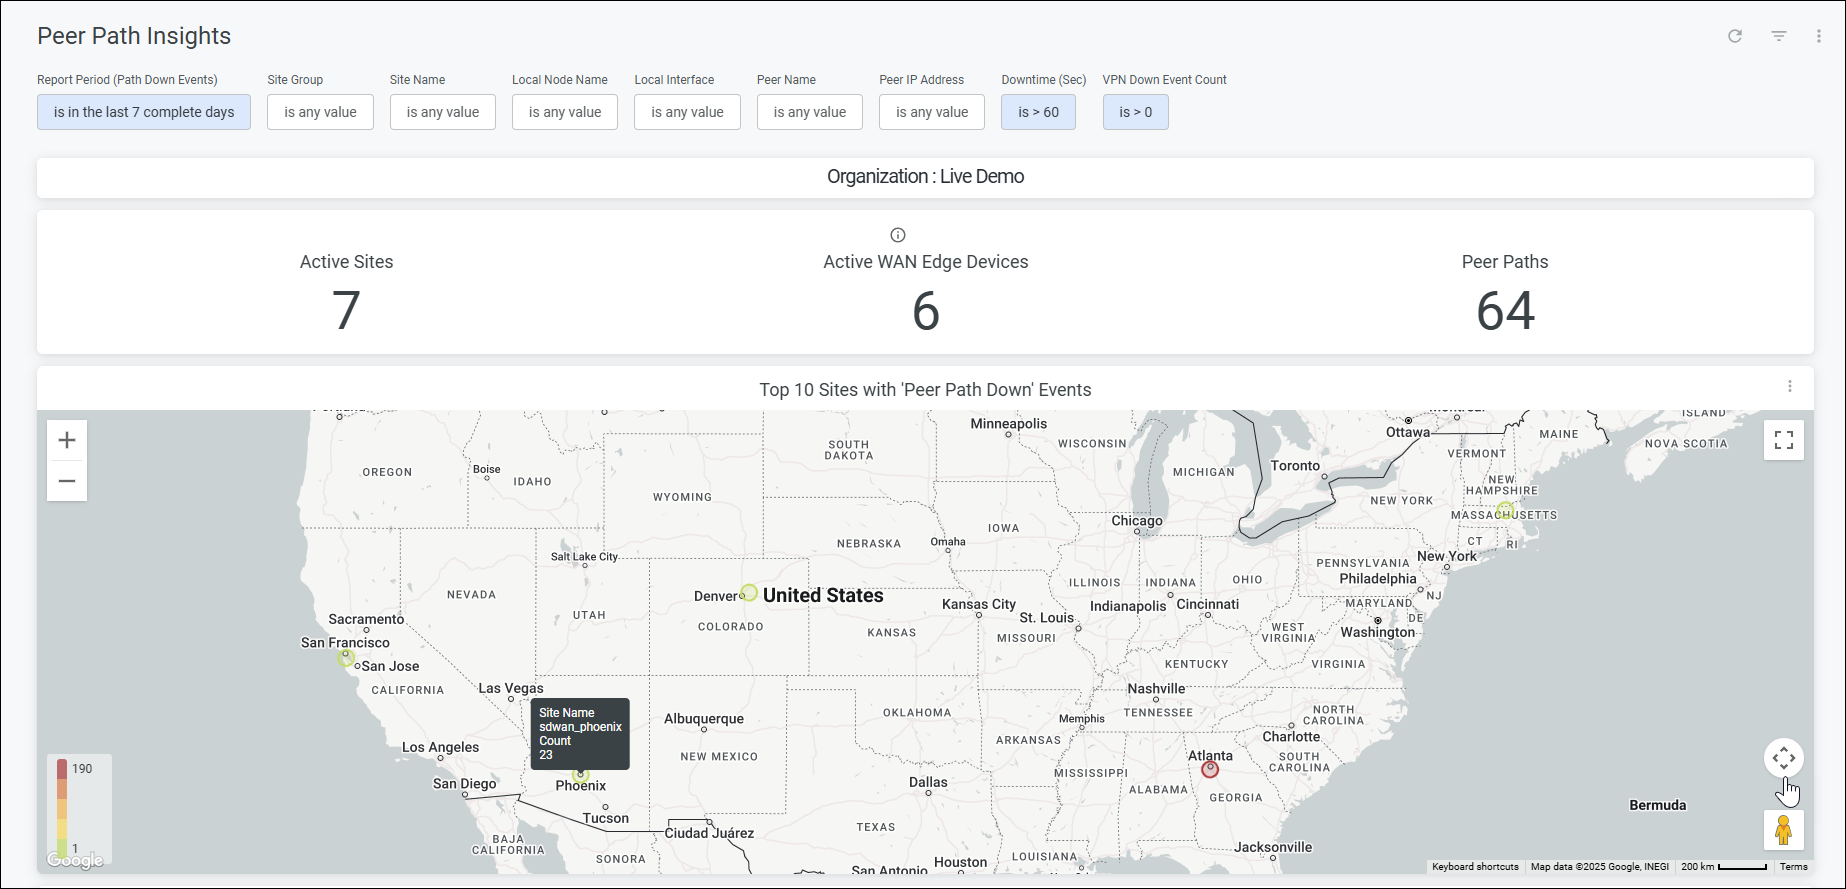
Peer Path Insights Tiles
The Peer Path Insights dashboard includes various tiles to provide an overview of peer path insights for SSR Series Routers. The dashboard displays the number of active sites in the organization, number of active SSR Series Routers, and the total number of peer paths configured between the SSR Series Routers. If you click the numbers displayed for the active sites and devices, you can view the details.
Hover over a location on the Top 10 Sites with Peer Down Events map to see details about the site and the number of events for the site. In the lower left corner, you’ll see a color legend to indicate locations based on the number of peer path down events.
You can use the plus and minus sign buttons in the top left corner of the map, or double-click the map to zoom in, which will give you a more detailed view of the map.
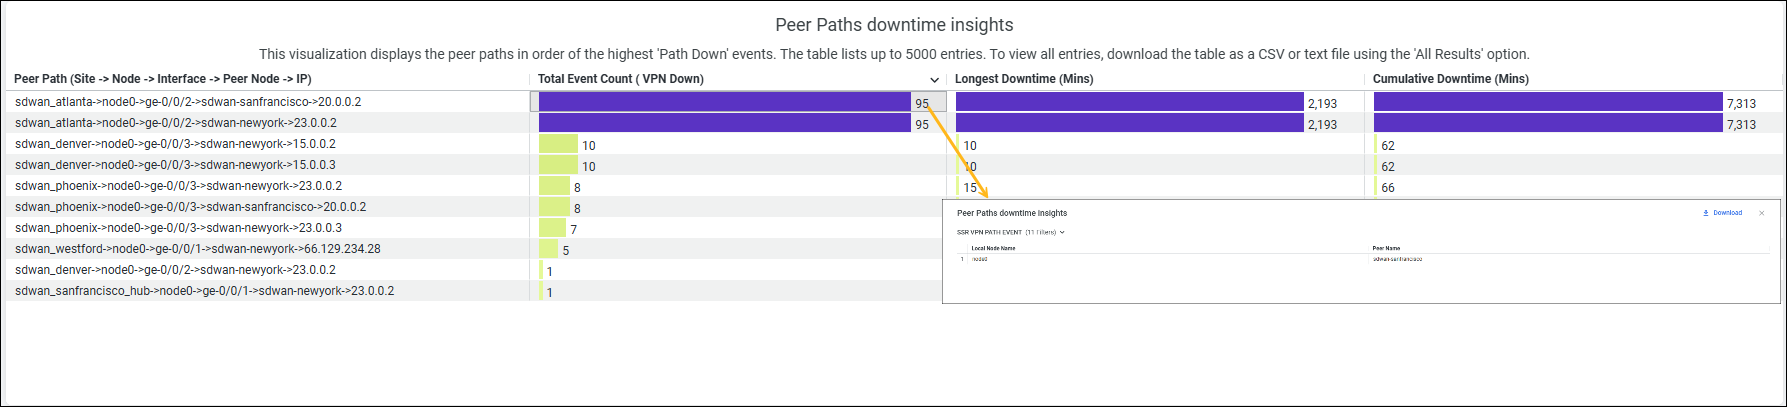
Peer Paths Downtime Insights
The Peer Paths Downtime Insights tile displays all the peer paths experiencing downtime. It lists the paths in the order of path down events. You can click the number listed in the Total Event Count column to view details as shown in the following example.
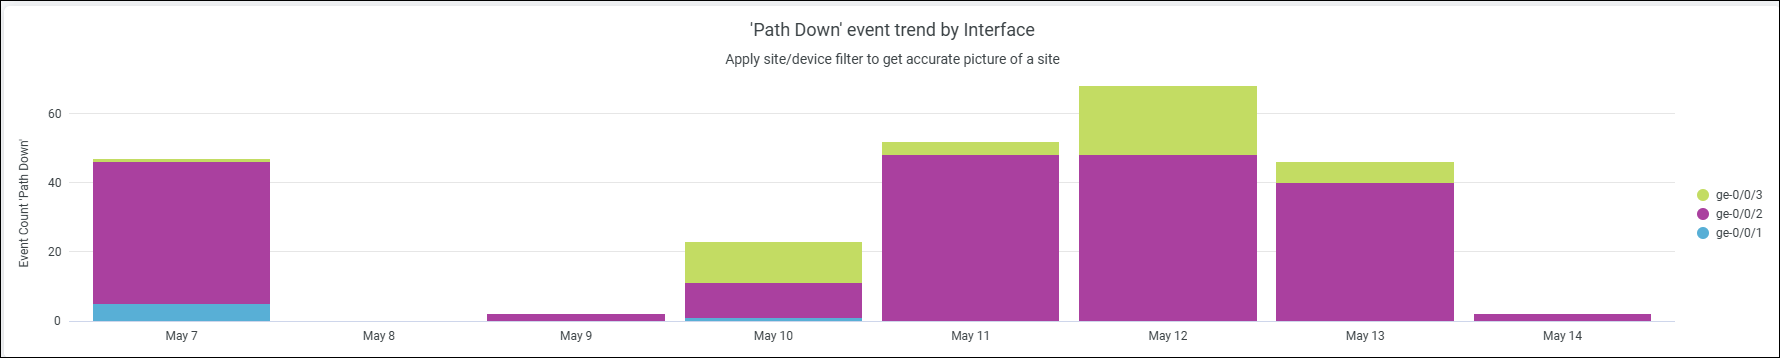
Path Down Event Trend by Interface
You can view the path down events for interfaces or WAN links at a site. We recommend that you filter by site or device to get a more precise view about the status of the WAN links at a site.
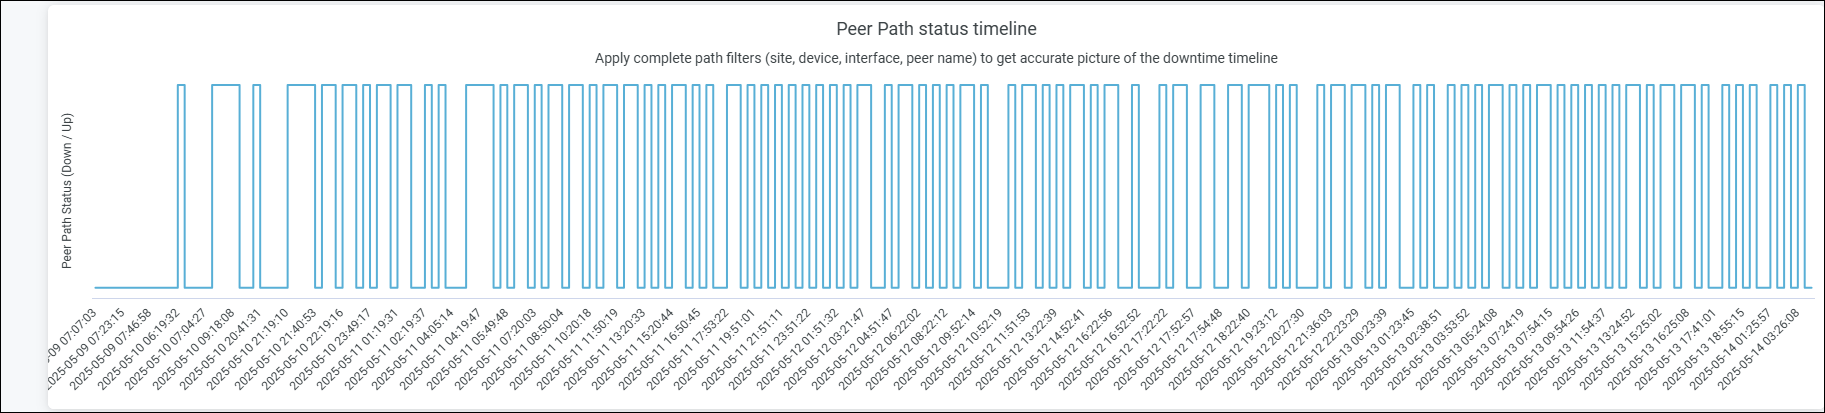
Peer Path Status Timeline
The Peer Path Status Timeline provides a graphical representation of the path up and path down events for a specific duration. You can use the filter options to narrow down the results.