Inactive Switchport Insights
Get visibility into the unused ports on your network.
The Inactive Switchport Insights dashboard provides visibility into all unused switch ports that were previously active on your network. Monitoring switch ports that were previously active but have remained unused for an extended period is crucial for maintaining network security and efficiency. Unused switch ports can pose a security risk by potentially allowing unauthorized access. This dashboard helps network administrators to proactively identify such ports and take necessary measures, such as disconnecting patch cords or disabling the ports, to mitigate security threats.
Subscription Requirements for Inactive Switchport Insights
You’ll need a Wired Assurance subscription to view and use the Inactive Switchport Insights dashboard. For information about subscriptions, see Subscription Types for Juniper Mist.
Before You Begin
-
See the Juniper Mist Wired Configuration Guide for the wired configuration details.
-
See Mist Premium Analytics Trial License to know about license requirements for the Juniper Mist Premium Analytics dashboard.
- Become familiar with the options available on the Juniper Mist Premium Analytics dashboard. See Figure 3.
Access Inactive Switchport Insights Dashboard
To access the Inactive Switchport Insights dashboard:
Inactive Switchport Insights Tiles
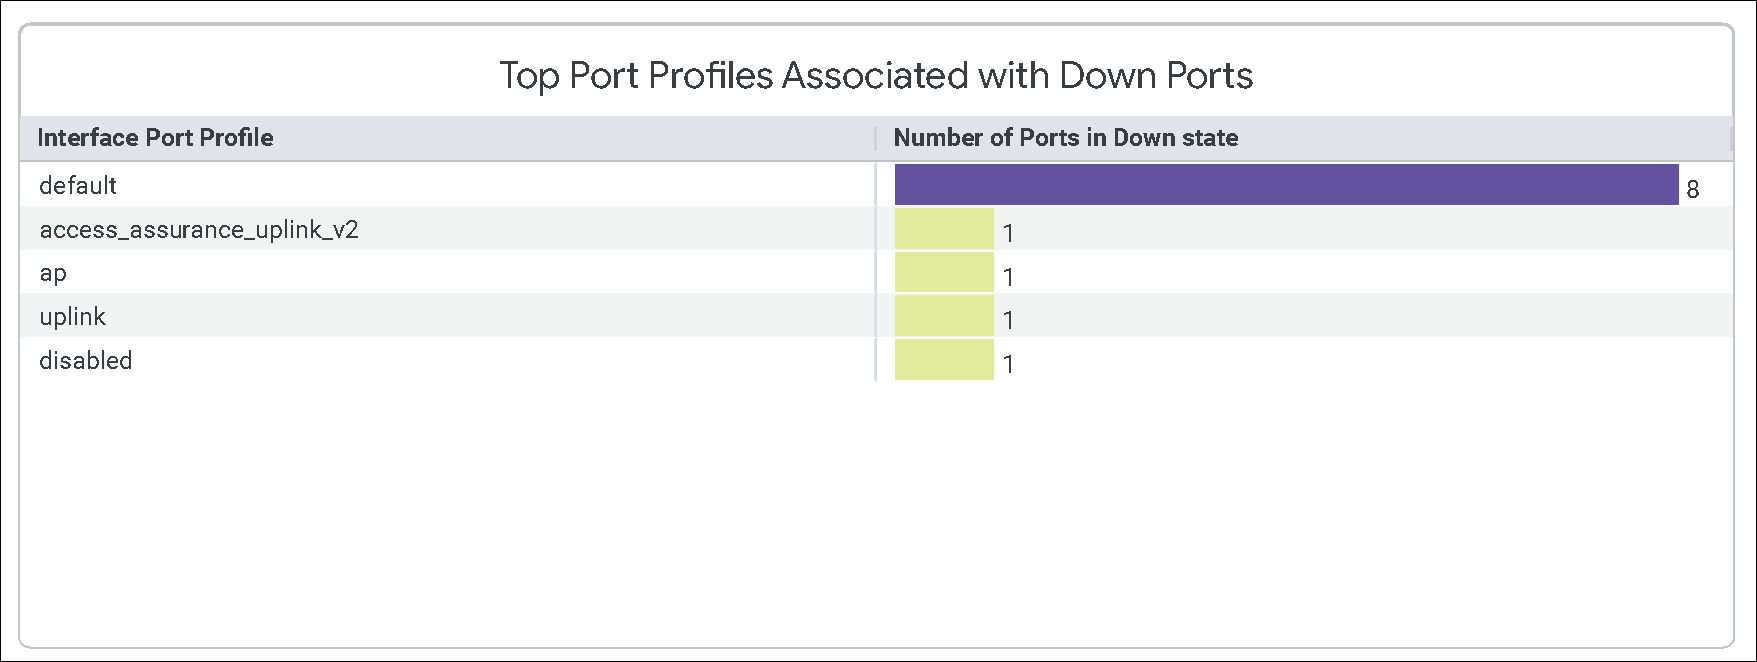
The Inactive Switchport Insights dashboard includes various tiles that provide graphical representations of analytics at a granular level. You can see the following details for the selected period:
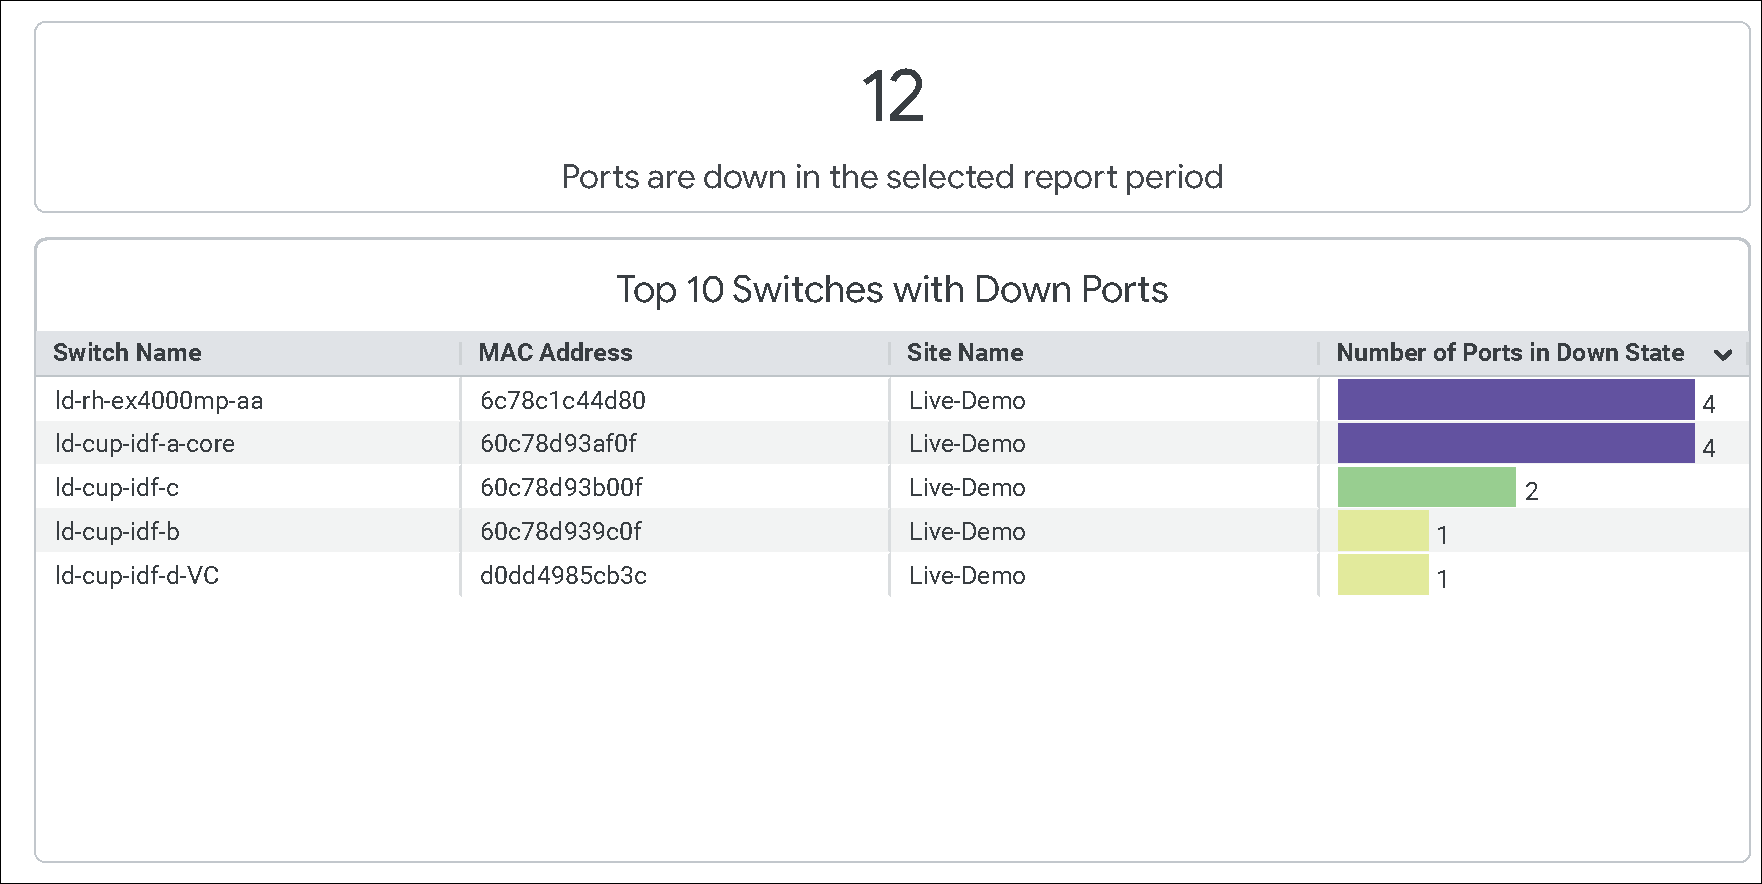
For a selected period, you can see the total number of ports that are inactive or in the Down state in your organization. You can also see detailed statistics of inactive or down ports based on the following categories:
-
Switches
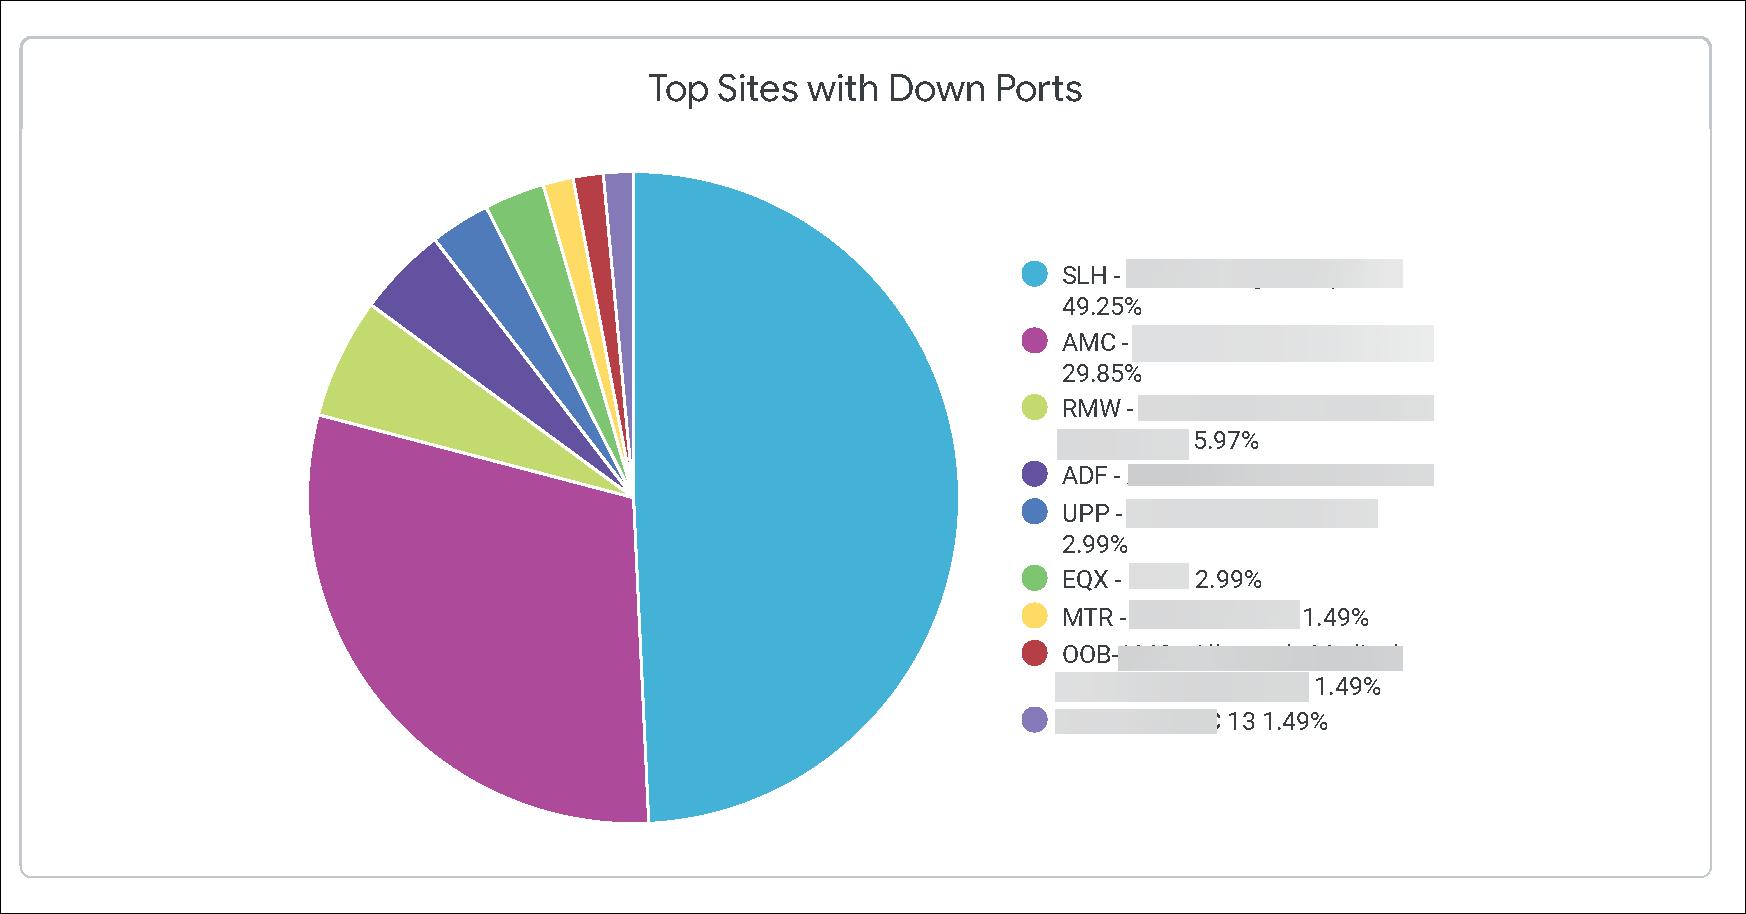
-
Sites
-
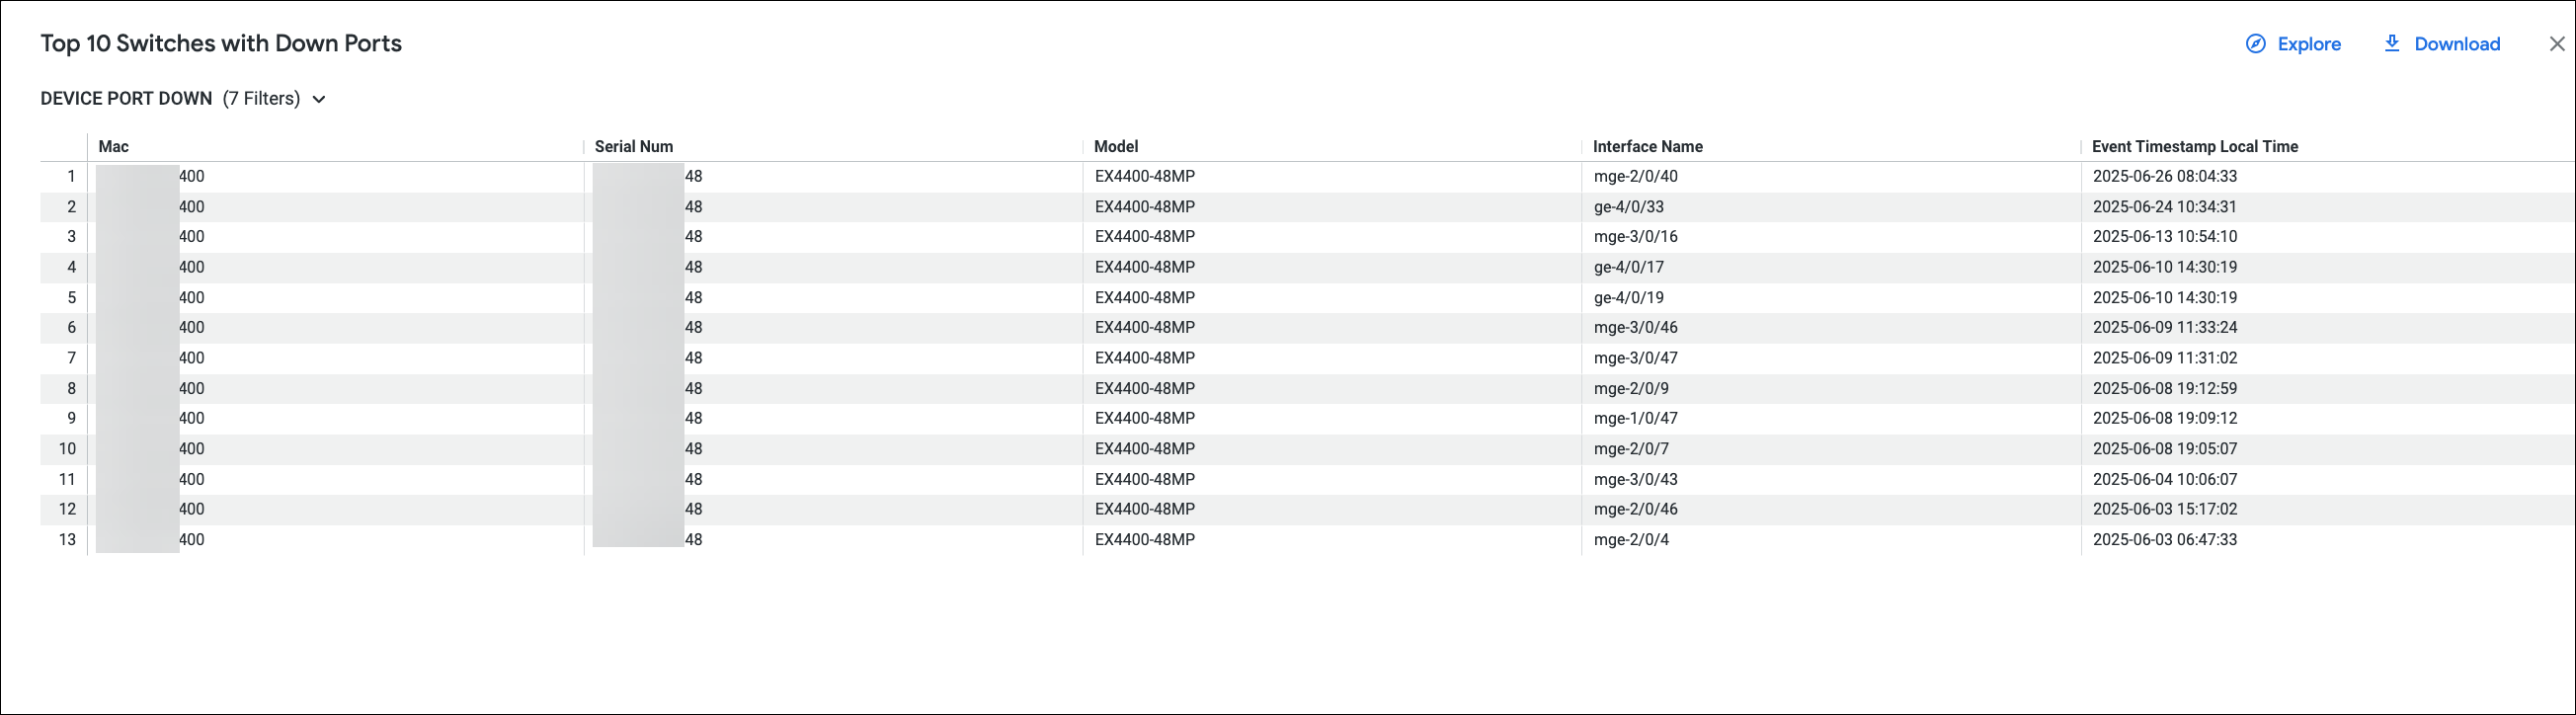
The last section of the report displays all the details of the switches with inactive or down ports.
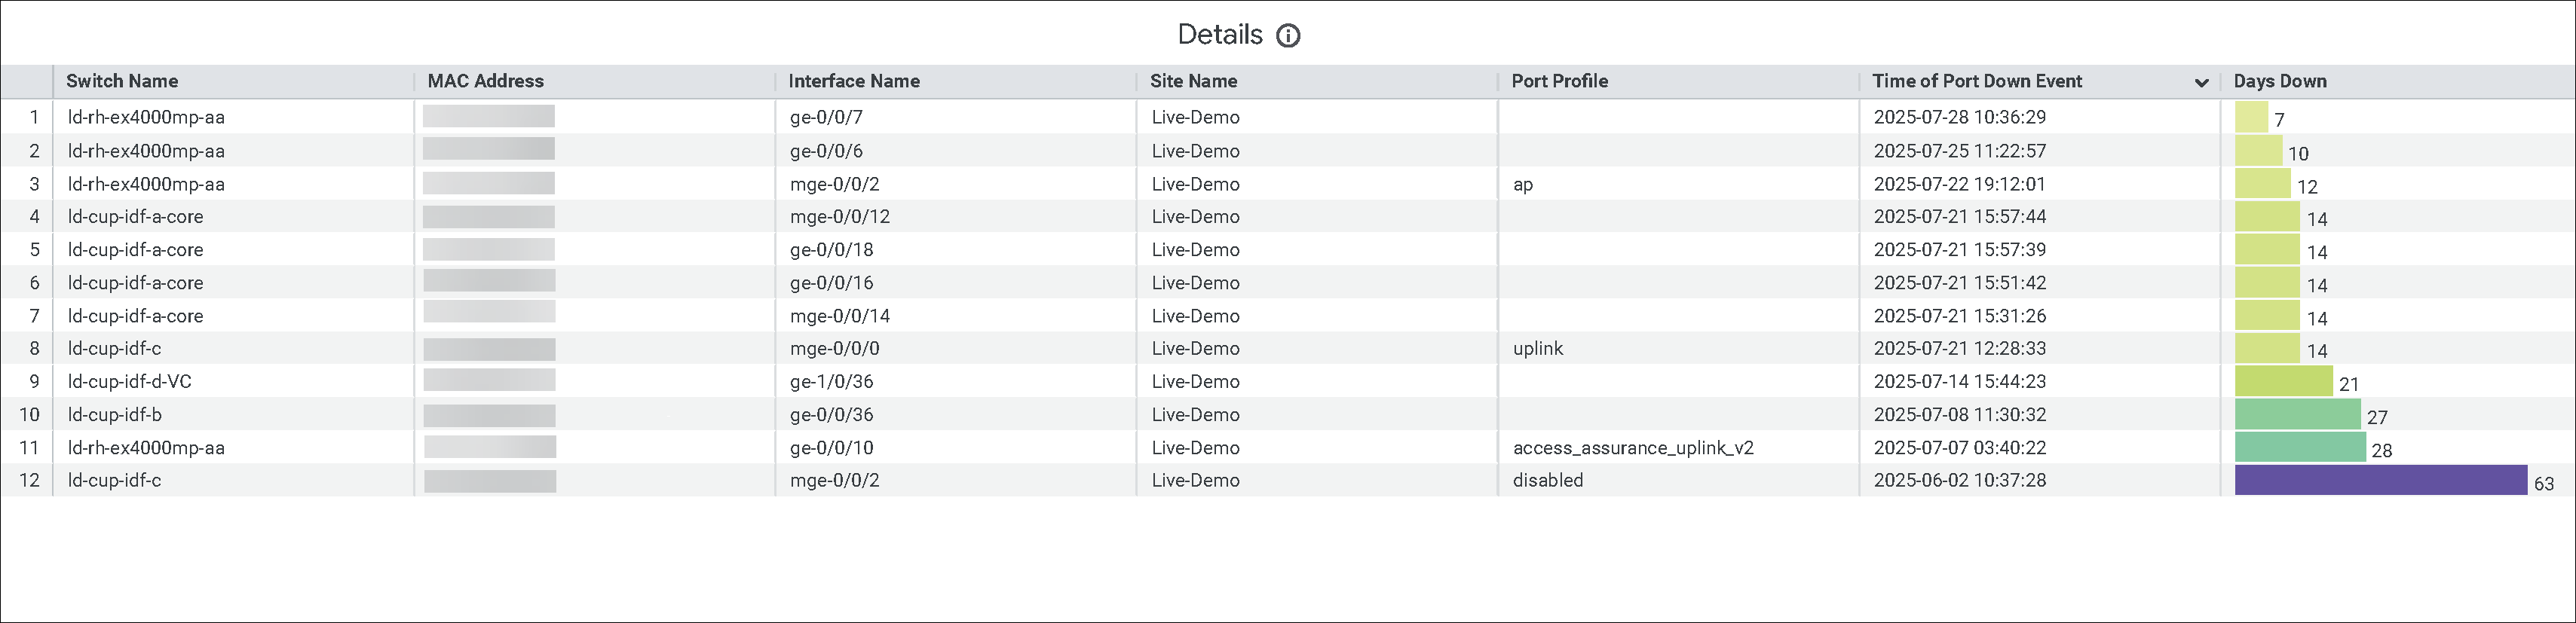
You can click an entry within each tile to view detailed information. Here's an example of the details that you can view for a switch from the Top 10 Switches with Down Ports tile: