Marvis Actions: An Insight into Back-End Operations
Take a closer look at the factors that Marvis uses to identify key issues and to categorize them as Marvis actions.
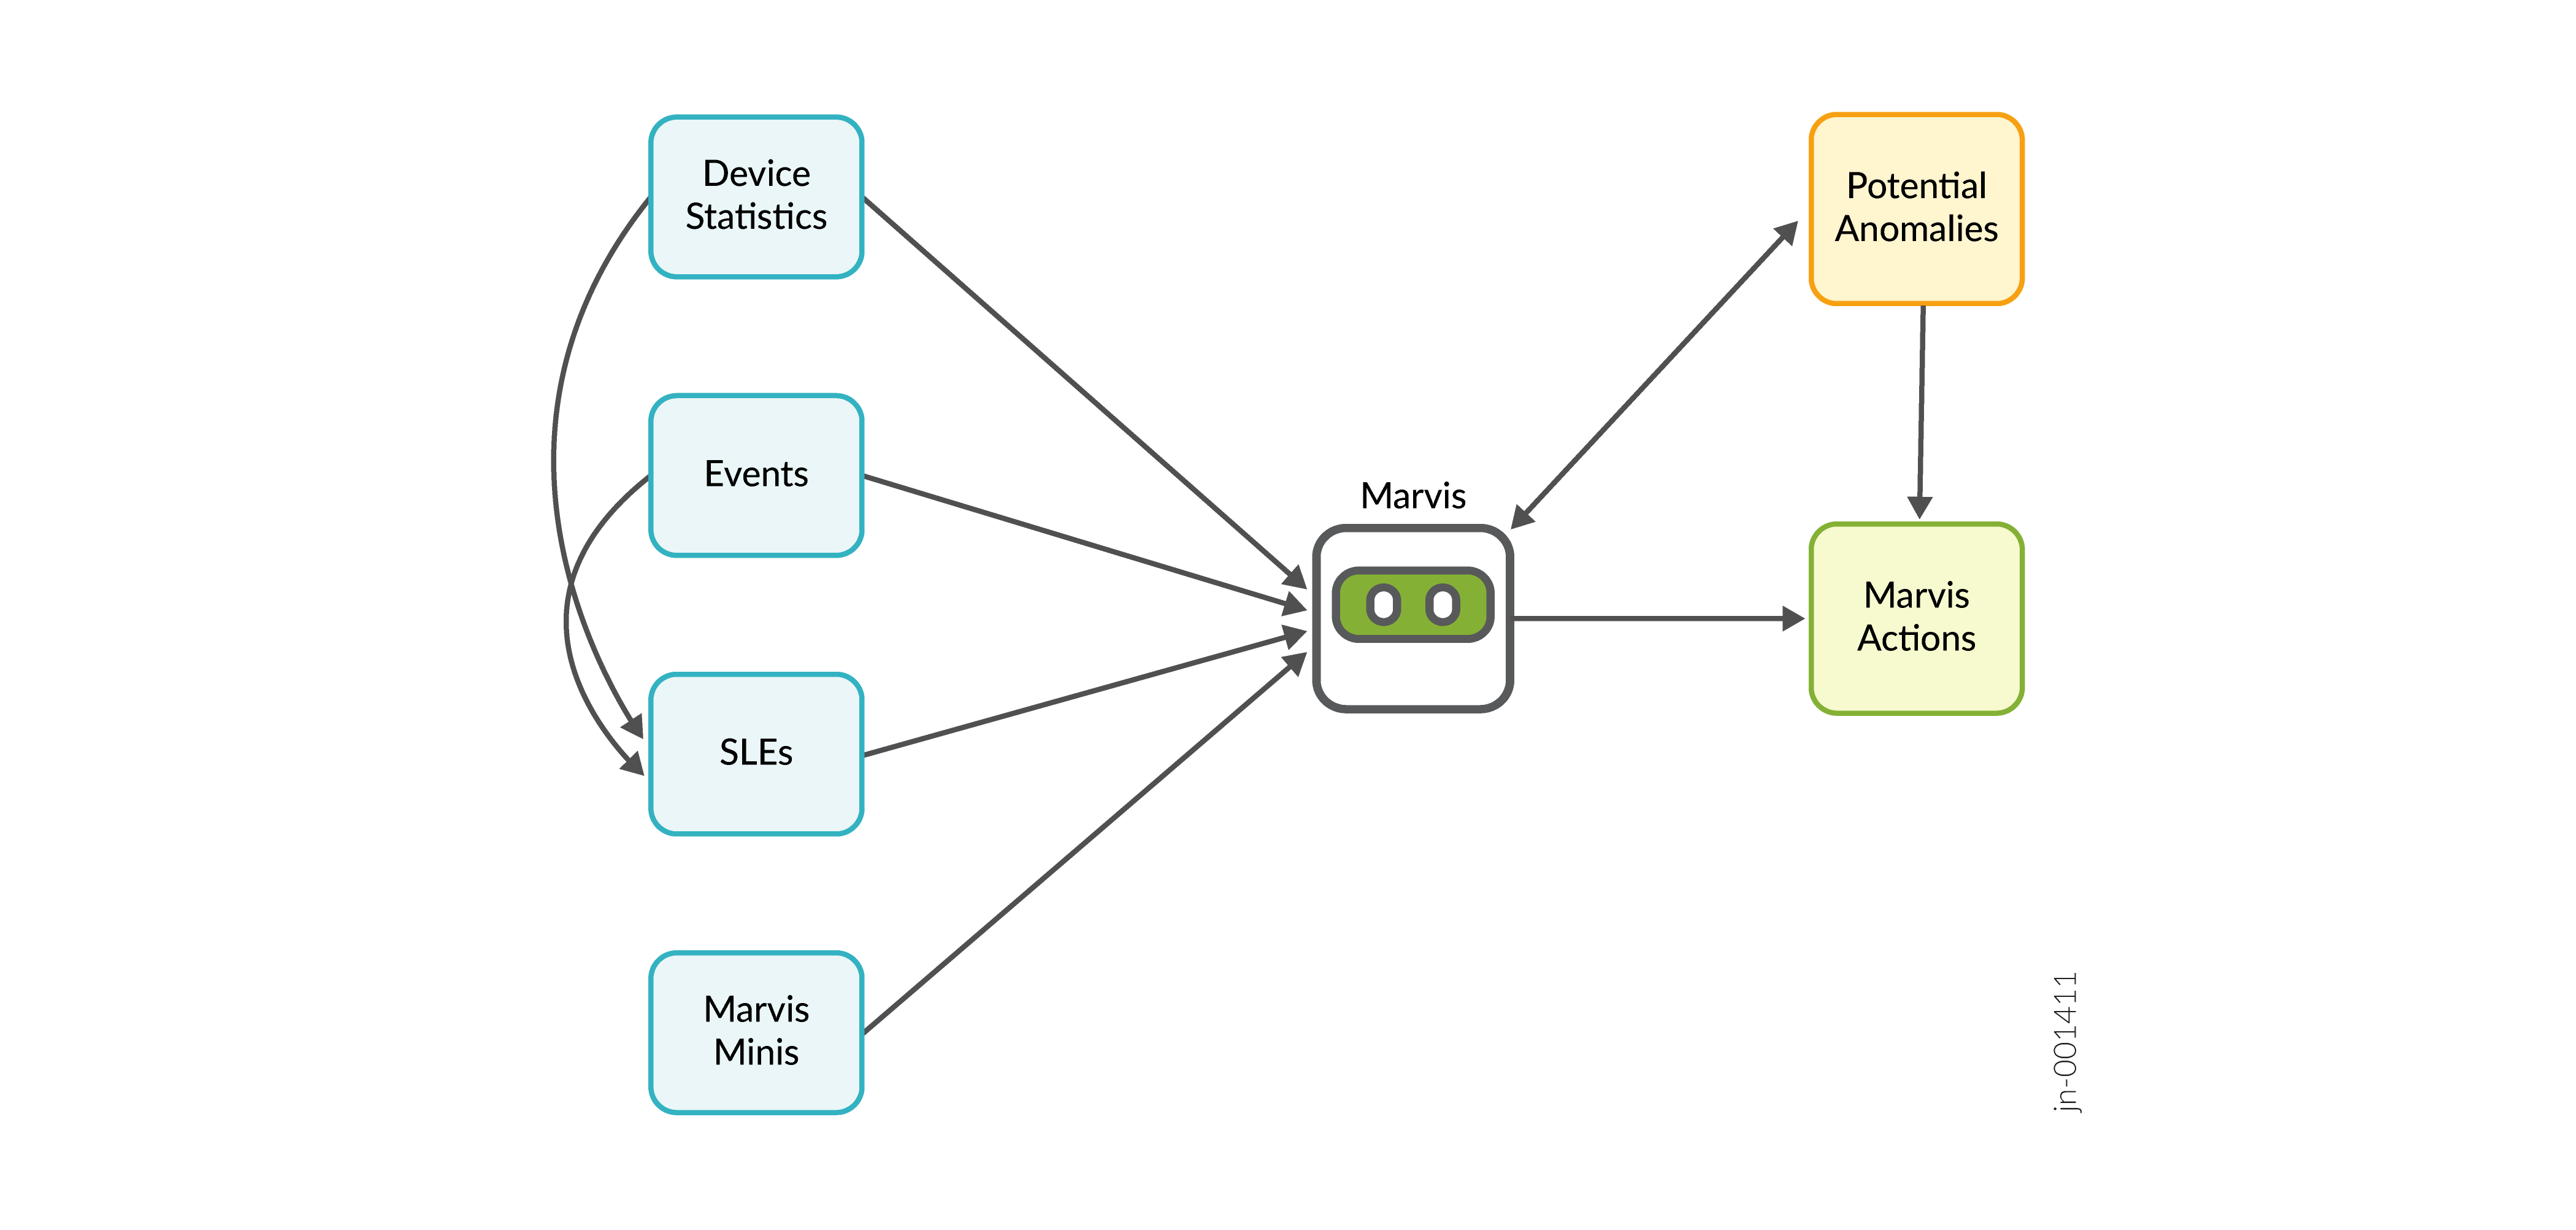
Marvis proactively scans your network for events and actionable insights. Using data from statistics and events, Marvis identifies user-impacting issues pertaining to wired, WAN, and wireless connectivity for both pre-connection and post-connection experiences. By highlighting high efficacy actions and automating root cause analysis, Marvis helps reduce mean time to resolution/innocence (MTTR/MTTI).
Note that Marvis Actions does not replace alerts. Alerts are triggered in real-time as and when events occur, for example a port up or down event. For information about alerts, see Alerts Overview.
Glossary of Terms
| Term | Definition |
|---|---|
| Model input feature | The inputs or features that the model consumes to determine whether the condition for generating the specific action is met. |
| Trigger conditions | The conditions that trigger the model to create Marvis actions. |
| Validation time | The time taken for Marvis to mark an open Marvis action as resolved. A user might have fixed the issue. Or the symptoms might not be observed anymore. |
Layer 1 Actions
| Marvis Action | Model Input Feature | Trigger Conditions | Validation Time |
|---|---|---|---|
| Bad Cable | AP, switch, or WAN Edge statistics, events | Speed changes, errors reported on ports, switch port link active but not passing traffic, and frequent disconnections and restarts (only APs) over the monitored period. | 7 days |
Connectivity Actions
| Marvis Action | Model Input Feature | Trigger Conditions | Validation Time |
|---|---|---|---|
| Authentication Failure | Wired and Wireless clients |
Deviations from the predicted baseline. The LSTM-based model baselines authentication success or failure events across the site. The model considers the severity of the issue to generate this Marvis action. The higher the severity and deviation from the baseline, the higher the confidence of the model to generate this action within the observed time duration. |
1 day |
| DHCP Failure | Wired and Wireless clients |
Deviations from the predicted baseline. The LSTM-based model baselines Dynamic Host Configuration Protocol (DHCP) success or failure events across the site. The model considers the severity of the issue to generate this Marvis action. The higher the severity and deviation from the baseline, the higher the confidence of the model to generate this action within the observed time duration. |
1 day |
| ARP Failure | Wired and Wireless clients |
Deviations from the predicted baseline. The LSTM-based model baselines Address Resolution Protocol (ARP) success or failure events across the site. The model considers the severity of the issue to generate this Marvis action. The higher the severity and deviation from the baseline, the higher the confidence of the model to generate this action within the observed time duration. |
1 day |
| DNS Failure | Wired and Wireless clients |
Deviations from the predicted baseline. The LSTM-based model baselines Domain Name System (DNS) success or failure events across the site. The model considers the severity of the issue to generate this Marvis action. The higher the severity and deviation from the baseline, the higher the confidence of the model to generate this action within the observed time duration. |
1 day |
Wireless Actions
| Marvis Action | Model Input Feature | Trigger Conditions | Validation Time |
|---|---|---|---|
| Offline | AP statistics |
One AP or multiple APs are locally up or down (loss of cloud connectivity only). The model correlates to identify the cause for the AP being down—that is, if the issue is due to a switch, site, region, or ISP outage. If you want to be notified when devices go offline, configure infrastructure alerts for device up or down events and specify a threshold. |
15 minutes |
| Health Check Failed | AP statistics |
AP or radios remain repeatedly inoperable after autorecovery. |
30 days |
| Non-Compliant | AP statistics |
Difference in firmware version on an AP or multiple APs from that in the version compliance settings configured under site settings. |
30 minutes |
| Coverage Hole | AP and client statistics |
Anomaly in the SLE baseline caused due to repeated low RSSI reported by all clients associated with an AP or multiple APs in a high-impact area. The model considers the recurrence of the issue and fringe pattern awareness in the case of outdoor APs or APs located at the building entry or exit. The model considers the strength of the anomaly to generate the Marvis action to indicate a user-impacting coverage-hole issue. If the anomaly index is strong, the model generates the action faster than when the anomaly index is weak. The model examines multiple batches of data to identify APs for coverage-hole issues. |
7 days |
| Insufficient Capacity | AP and client statistics |
Anomaly in the baseline caused by APs with repeated and prolonged capacity constraints that are not seasonal in nature. The model factors the anomaly strength to generate the Marvis action to indicate a user-impacting capacity issue. If the anomaly index is strong, the model generates the action faster than when the anomaly index is weak. The model examines multiple batches of data to identify APs for capacity issues. |
7 days |
| AP Loop Detected | AP events |
Reflection events on an AP triggered by network loops caused due to misconfiguration or incorrect configuration. Reflection events occur when an AP receives the packet it sent on the same or different VLAN. Reflection events are generated almost immediately under site events, enabling you to monitor these events for raw statistics-based tracking. |
30 minutes |
Wired Actions
| Marvis Action | Model Input Feature | Trigger Conditions | Validation Time |
|---|---|---|---|
| Missing VLAN | AP port statistics |
Uplink port statistics reported by an AP missing a VLAN. This action correlates data from two or more APs to determine whether an active VLAN used by clients is missing on the AP port. This correlation helps prevent generation of the Missing VLAN action if a VLAN is unused by any client across the entire site. |
30 minutes |
| Negotiation Incomplete | Individual switch port statistics |
Autonegotiation failure reported on the switch ports. |
Up to 60 minutes |
| MTU Mismatch | Individual switch port statistics |
MTU mismatch between any switch port and connected devices. The reported statistics indicate errors on the port. The model considers the severity and time to generate the Marvis action. The greater the MTU mismatch, the greater the severity, resulting in faster generation of the Marvis action. |
1 day |
| Loop Detected | Switch port events |
An intentionally or unintentionally introduced loop in the topology resulting in rapid and repeated Spanning Tree Protocol (STP) topology changes. The model uses the STP topology changes event as an input feature and considers the severity and time. The higher the frequency of STP topology changes in each period, the faster the detection. Alternatively, a loop causing events at a slower pace for a longer duration also triggers the Marvis action. |
30 minutes |
| Network Port Flap | Switch ports events (trunk port only) |
Consistent port bounce on a port configured as a trunk port. The model considers the frequency and time. The higher the frequency of port flaps, the higher the severity of the issue. For slow port flaps that occur for a longer duration, the model detects the port flaps within a couple of hours or a few days. |
30 minutes |
| High CPU | Switch chassis statistics |
Average CPU utilization consistently greater than 90% for the monitored duration. The model considers the frequency and duration of the issue. Statistics that show high average CPU utilization for every sample in the monitored dataset indicate a severe user-impacting issue. The model generates the Marvis action quickly for such an issue. |
30 minutes |
| Port Stuck | Switch port statistics |
Sudden deviation in traffic patterns for end devices on access ports. The model does not generate false positives for recurring seasonal traffic patterns. It also considers traffic patterns across similar endpoints for inference. . This Marvis action is self-driving. When a port stuck issue is detected, the port is automatically bounced to operationalize the endpoint again. The model generates the action only if the endpoint fails to come back into operation after an automatic port bounce or if the port stuck issue recurs multiple times. . |
30 minutes |
| Traffic Anomaly | Switch port statistics |
Any deviation in broadcast and multicast frame counters from the predicted traffic patterns. The model baselines traffic patterns on each switch or switch port every couple of days. This action uses the long short-term memory (LSTM)-based model. The model generates this Marvis action based on the severity of the issue. For strong deviations that last for the entire monitored duration, the model generates the action quickly. The model might take longer to generate actions for minor, longer-lasting deviations. |
1 day |
| Misconfigured Port | Uplink switch port statistics | MTU, VLAN, mode, or duplex mismatches between identified uplink ports. The model identifies discrepancies on the switch-switch connections at the edge. |
60 minutes |
WAN Actions
| Marvis Action | Model Input Feature | Trigger Conditions | Validation Time |
|---|---|---|---|
| MTU Mismatch | WAN Edge statistics |
MTU mismatch between a WAN Edge port and connected devices. The model examines the reported statistics that indicate certain errors on the port. The model considers the severity and time to generate this Marvis action. The greater the MTU mismatch, the greater the severity, and the action is generated within a specific time duration. |
30 minutes |
| Bad WAN Uplink | Uplink ports on WAN Edges |
High latency, packet drops, congestion, and network service failures such as ARP or DHCP reported in the WAN port statistics, indicating a change in the baseline behavior. Issues determined as high-severity issues are listed sooner than the low-severity issues. |
1 day |
| VPN Path Down | VPN tunnels or peer paths |
Peer-path down issue in either of the following paths:
Subscribe to the critical port monitoring alert for raw alerting if your requirement is to get alerts on every port up or port down scenario. Issues determined as high-severity issues are listed sooner than the low-severity issues. |
1 hour |
| Non-Compliant | SRX Series Firewall |
Difference in Junos OS version on the primary and backup partitions. |
30 minutes |
Other Marvis Actions
| Marvis Action | Model Input Feature | Trigger Conditions | Validation Time |
|---|---|---|---|
| Persistently Failing Clients | Wired and Wireless clients |
Clients continuously failing to authenticate and connect to the network. Persistent failures are observed continuously during the monitored time frame. The trigger time is dependent on the site—that is, the number of clients and correlated simultaneous failures. |
60 minutes |
| Access Port Flap | Access ports on a switch |
Consistent port up or port down events for a port configured as an access port. The model considers the frequency and duration of the issue. The higher the frequency of port flaps, the higher the severity of the issue. For slow port flaps that occur for a longer duration, the model detects the port flaps within a couple of hours or a few days. |
30 minutes |