Alerts Overview
Get familiar with Juniper Mist™ alerts and the Alerts dashboard in the Juniper Mist portal.
What Are Alerts?
Alerts represent network and device issues that are ongoing. Juniper Mist™ categorizes them as follows:
-
Infrastructure Alerts—Repeated events involving servers and protocols that can potentially affect a large number of clients. For example, an event during which a Domain Name System (DNS), Dynamic Host Configuration Protocol (DHCP), or RADIUS server is unreachable can affect many clients. Similarly, if a power supply on a switch is in alarm state, a large number of clients and a large amount of traffic could be affected.
-
Marvis Alerts—Repeated events that Marvis tracks on the Marvis Actions dashboard. For example, if an access point (AP) regularly fails health checks, you'll see a Marvis alert for it.
-
Security Alerts—Repeated events that could dramatically affect network security. For example, these alerts appear if a rogue AP is detected and clients start connecting to it.
-
Certificate Alerts—Notification for expired, and soon-to-expire, user-added digital certificates. These include RadSec (configured at Organization > Settings > RadSec Certificates and AP RadSec certificate), SSO (configured at Organization > Settings > Single Sign-On), and PSK Portal IDP certificates (configured at Organization > Client Onboarding). Certificate alerts appear on the Alerts page and begin 30 days before the certificate's expiry date, then the notification repeats 15, 7, 3, and 1 day before expiration unless the certificate is renewed. .
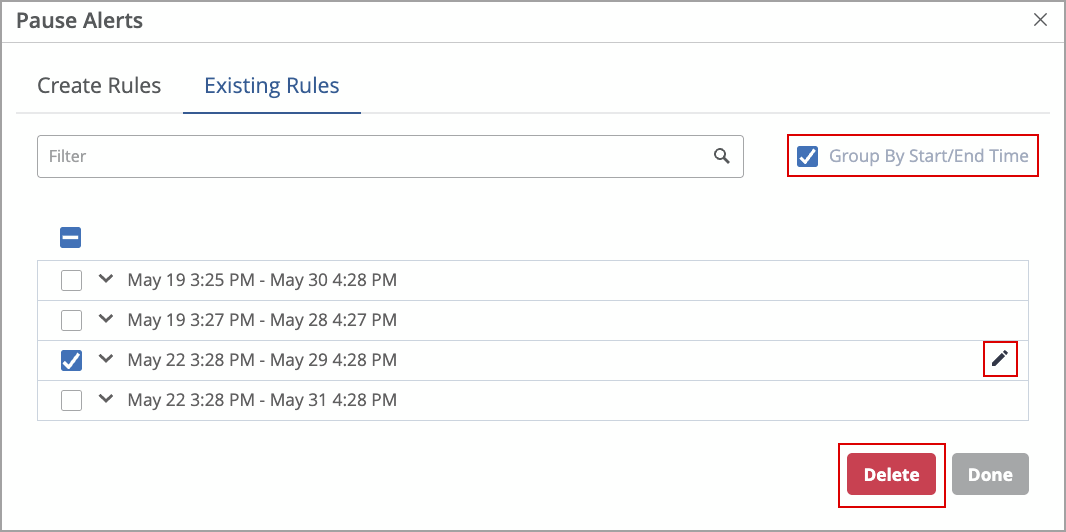
You can pause alerts for the organization, selected sites, and site groups:
- In the main menu, select Monitor > Alerts, then click Alerts Configuration and Pause Alerts. From the Existing Rules tab of the Pause Alerts window, you can view the schedule of current rules, and make new rules at the Create Rules tab.
-
For information about alerts, see Juniper Mist Alert Types.
-
To enable the alerts that you want to include on the Alerts dashboard, see Juniper Mist Alert Types.
-
Junos, the network operating system used in Juniper switching, routing, and security devices, provides another system for alerts and notifications that you can use to monitor switch ports. For more information, see https://www.juniper.net/documentation/us/en/software/junos/security-services/topics/topic-map/overview-port-security.html.
Finding the Alerts Dashboard
The Alerts dashboard lists all alerts that you've enabled on the Alerts Configuration page. To view the Alerts dashboard, select Monitor > Alerts from the left menu.
For help configuring alerts, see Select the Alerts Scope, Recipients, and Types to Monitor.
Selecting the Context and Time Period
At the top of the Alerts page, select the context, which can be an entire organization or a single site. Also select the time period to view.
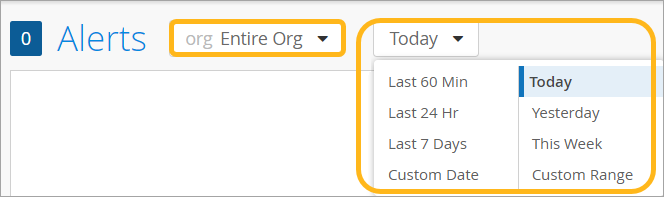
The Alerts page displays data as recent as the past 60 minutes or as far back as the last 7 days. If you purchase a Premium Analytics subscription, you can access up to 3 years' worth of wireless network insights and other data. To access the information available through your Premium Analytics subscription, select Analytics > Premium Analytics from the left menu.
Page Overview
Get familiar with the major elements of the Alerts dashboard.
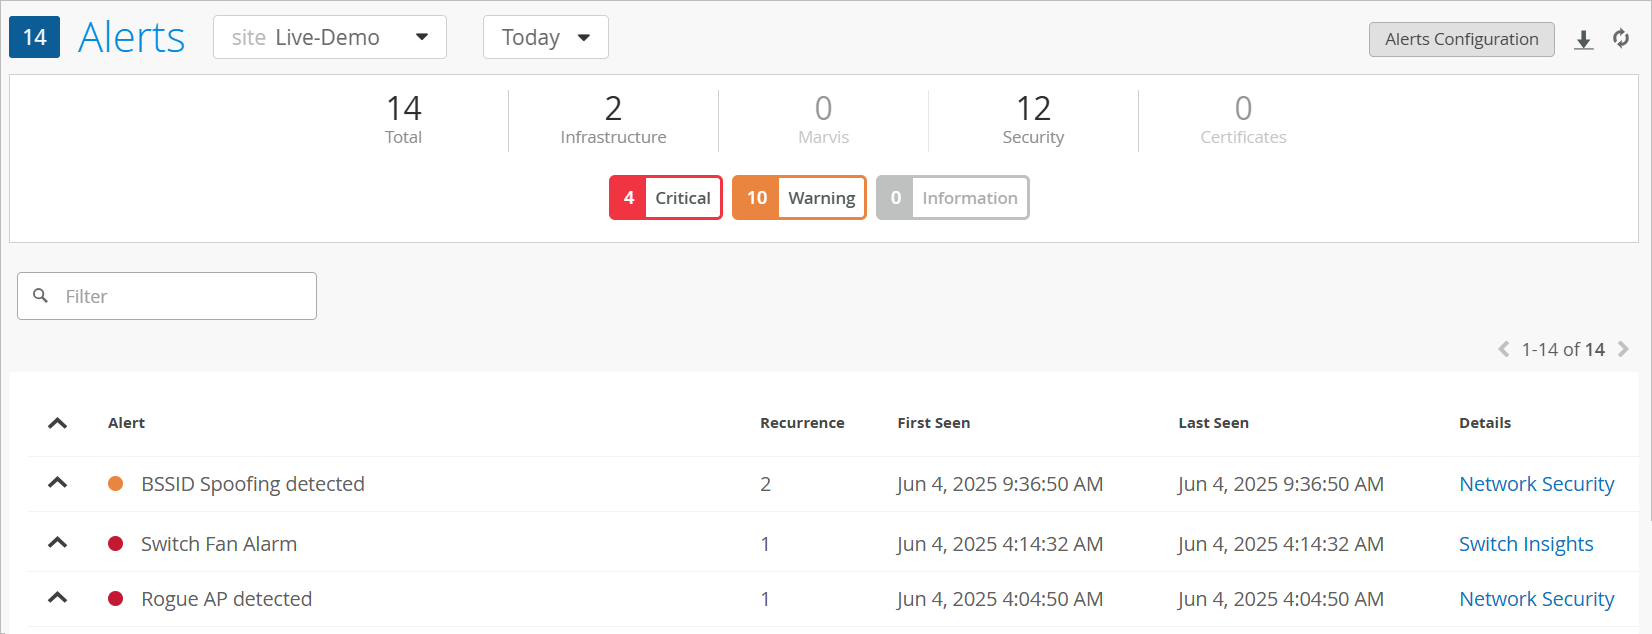
At the top, the current alerts are summarized by type and severity level. All these summary blocks are buttons that you can use to filter the alerts list.
The alerts list includes this information:
-
Alert—The name of the alert, along with an icon representing the severity level. For more information about the color codes and severity levels, see the Severity Filters table later in this topic.
-
Site—The name of the site where this issue occurred. Appears only if you've selected Entire Org as the context at the top of the page.
-
Recurrence—The number of times that this issue occurred.
-
First Seen and Last Seen—The time period when this issue occurred.
-
Details—The affected component (as listed below), with a link that you can click for more details.
The displayed link corresponds to the alert type. The links include:
-
Device Insights—Click the link to view the Insights page for the selected site. This page shows a timeline of events and full details for client events, AP events, and site events. You'll also see details for all applications.
-
Marvis—Click the link to view the Marvis Actions page.
-
Network Security—Click the link to view the Wireless Security page. This page shows all security issues for each SSID. You'll see information such as the type of issue, number of affected clients, band, channel, RSSI, and floorplan location.
-
WAN Edge Details—Click the link to view the Insights page for WAN Edges at the selected site. This page shows details for WAN Edge events, applications, application policies, WAN Edge devices, ports, peer path stats, and more.
-
Filters
You can apply filters to show only the alerts that you want to see.
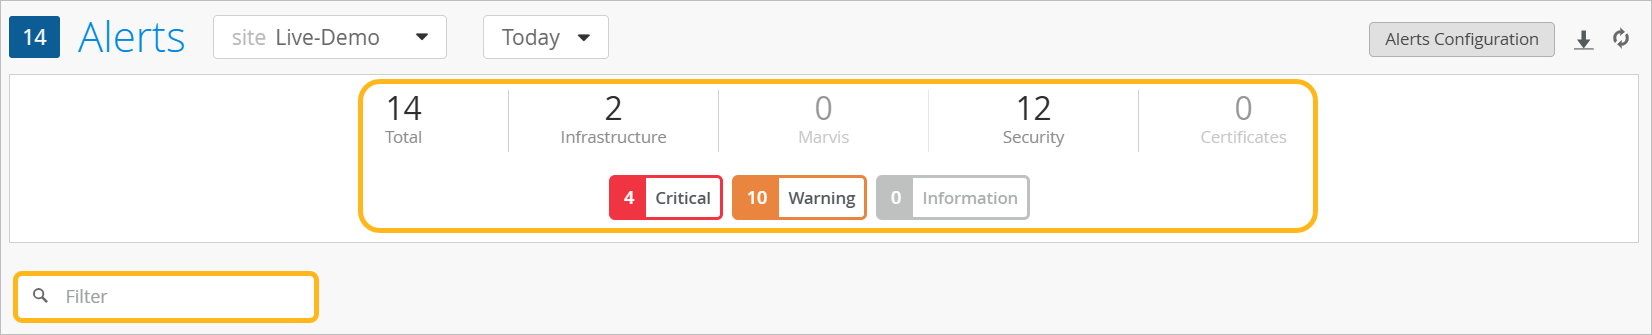
Alert Type Filters
Juniper Mist categorizes alerts by type. The alert type buttons at the top of the Alerts page show the current number of issues for each type. Click a button to show only the alerts of that type.
Severity Filters
Juniper Mist ranks alerts by severity. The severity buttons at the top of the Alerts page show the current number of issues for each severity level. Click a button to show only the alerts for that severity level.
| Severity | Color Code | Recommended Action |
|---|---|---|
| Critical | Red | Take immediate action. |
| Warning | Orange | Continue monitoring if the event continues. |
| Informational | Blue | No action is required. |
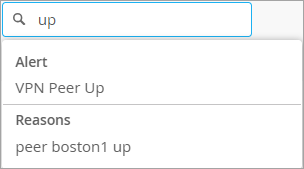
Filter Box
Above the list of alerts, you can use the Filter box to narrow down the alerts to view. Start typing the name of an alert, and then click a matching alert in the drop-down list.