Marvis Large Experience Model
Understand how the Marvis Large Experience Model (LEM) leverages live telemetry and the Shapley model to predict, optimize, and proactively diagnose user experience issues across the network before they impact users.
The Marvis Large Experience Model (LEM) is an AI-driven engine that predicts bad user experiences and ranks their root causes for collaboration applications such as Microsoft Teams and Zoom across the network. By continuously ingesting live network telemetry and processing the data using a Shapley-based data science model, Marvis LEM can proactively detect and diagnose emerging issues—often before users notice any impact.
The LEM evaluates wireless network behavior and provides:
-
Client-experience focused predictive analytics that leverages historical and real-time data to forecast potential user experience degradation.
-
SHAP (Shapley Additive Explanations) values that quantify how much each feature—such as signal strength, latency, interference—contributes to the predicted experience.
-
Detailed client and AP listings with LEM-computed feature contribution
-
Insights at multiple levels (site-wide, AP-specific, and client-specific)
-
A breakdown of the percentage of good and bad user minutes for the selected duration.
Good user minutes represent the duration when users did not experience any disruptions. Bad user minutes represent the duration when users experienced issues such as poor audio or video, lag, or disruptions. By comparing these metrics, LEM enables you to assess the overall call quality, identify patterns, and troubleshoot issues.
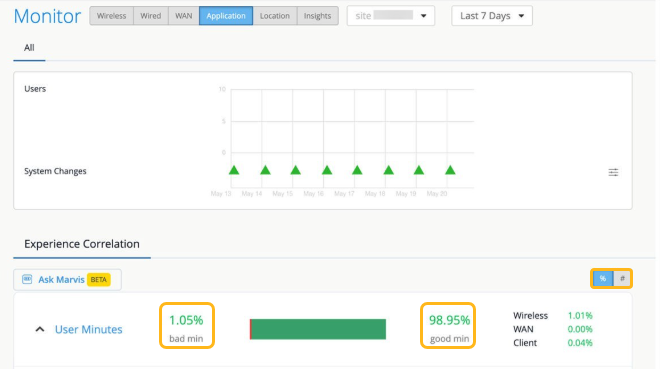
By default, the user minutes are displayed as a percentage. Click # to view the exact number of minutes.
LEM displays user experience correlation —independent of Zoom or Microsoft Teams integration. If you have integrated Zoom and Teams, then LEM utilizes the user minutes from the Zoom and Teams sessions to calculate the experience correlation. If you have not enabled Zoom and Teams integration, then LEM utilizes all user minutes for all clients connected on the network to predict the user experience.
Shapley Feature Ranking
The Shapley feature ranking method quantifies the average contribution each factor makes to the overall user experience. The features represent network conditions such as RSSI, interference, site latency, and total clients connected to the AP.
Using the Shapley model, Marvis LEM provides intuitive visualizations that:
-
Highlight key features contributing to a bad user experience
-
Quantify how much each feature contributes to a degraded user experience
-
Correlate these features across APs and clients
The LEM evaluates all possible combinations of the features to determine how strongly each one influences performance. Shapley values are computed for every minute of user experience and each feature is ranked based on the severity of their impact. This ranking highlights issues across the WAN, the wireless network, and client devices.
View the Marvis LEM Shapley Feature Ranking
You can access the Shapley feature ranking from the Monitor>Service Levels>Application page.
Here's an example showing the Shapley feature ranking graph on the Application page. The page displays the user minutes categorized as good and bad. The feature ranking graph displays the network features classified under three categories—Client, Wireless, and WAN. You can clearly identify which feature has the greatest impact on the overall user experience.
By default, the feature ranking is displayed at the site level. You can filter the view based on APs or clients. A bad user minute can have multiple features highlighted as root causes.
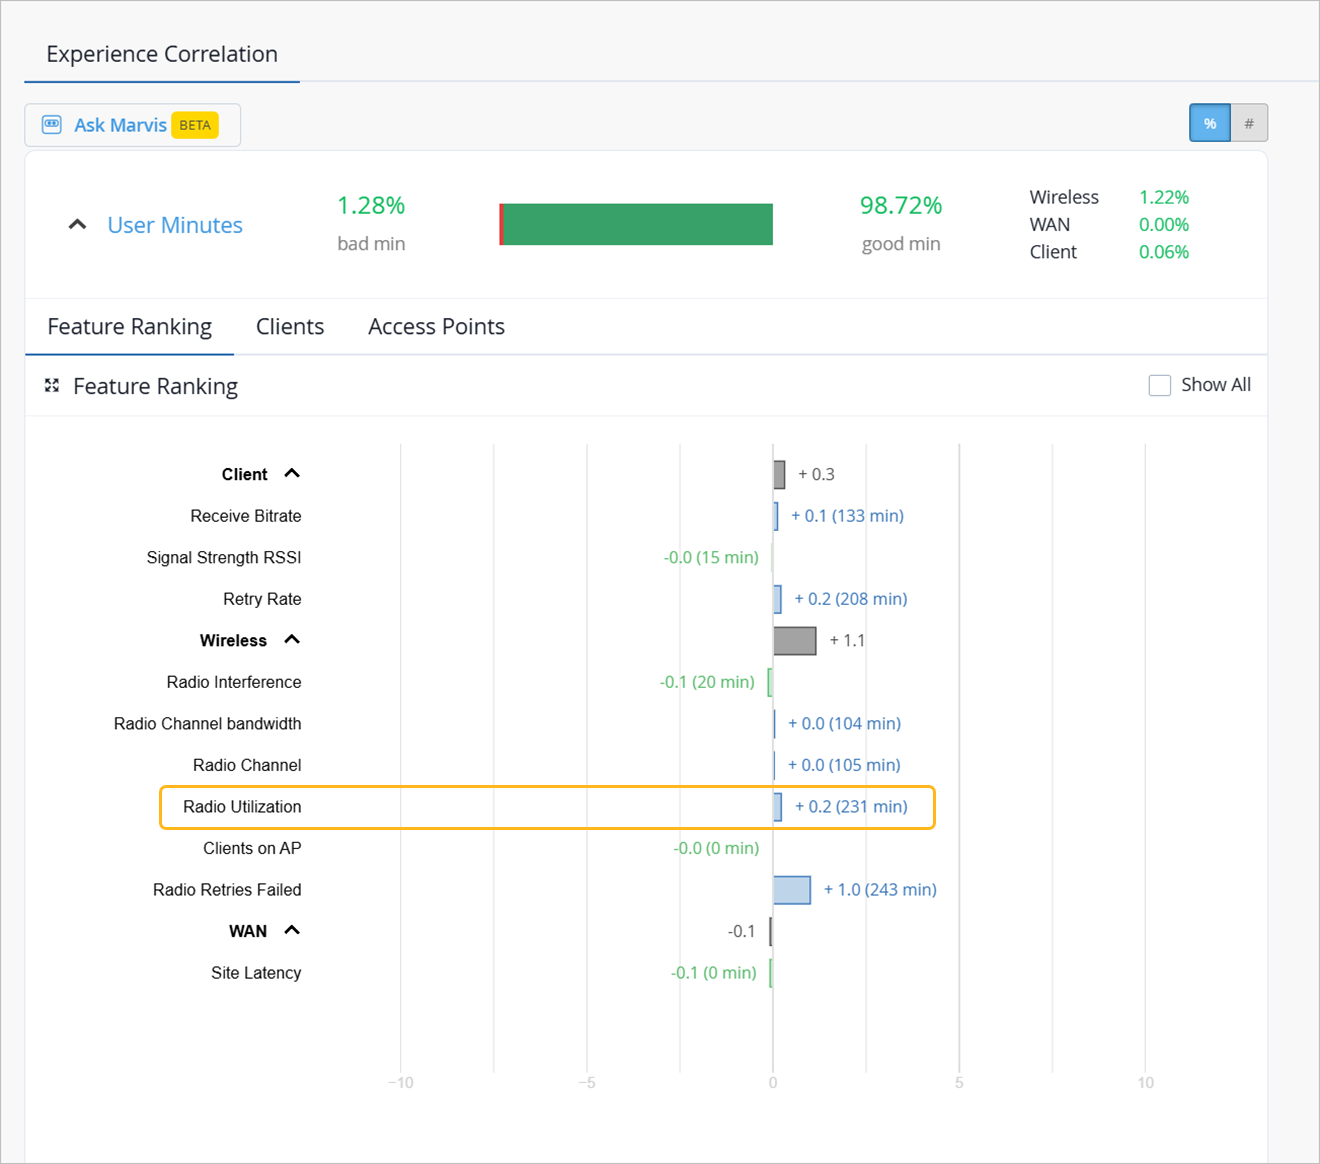
The following table provides details about each feature and its impact on user experience:
| Feature | Description | Impact on User Experience |
|---|---|---|
| Client | ||
| Received Bitrate | Client’s receive bit rate in Mbps | Directly impacts ability to handle video or audio streams. |
| Signal Strength RSSI | Average RSSI for a client | Poor RSSI indicates a coverage issue, while excessively strong ("too good") RSSI can also degrade performance |
| Retry Rate | Rate of retries during client reception | High retry rates indicate wireless issues |
| Wireless | ||
| Radio Interference | Percentage of interference experienced by the radio | High interference disrupts consistent data flow and can result in increased latency and packet loss. |
| Radio Channel Bandwidth | Channel bandwidth used (for example 20 MHz, 40 MHz, 80 MHz) | Wider bandwidth enables higher throughput, provided interference levels remain low |
| Radio Channel | Operating Wi-Fi channel for the radio | Suboptimal or congested channels can lead to interference and increased latency |
| Radio Utilization | Total utilization of the radio interface | High utilization indicates AP capacity issues |
| Clients on AP | Total number of clients connected to an AP | Higher values indicate a capacity issue, resulting in degraded performance. |
| Radio Retries Failed | Number of packet transmissions that were unsuccessful. | High numbers indicate wireless issues |
| WAN | ||
| Site Latency | Last measured RTT for the AP | A high RTT can introduce a lag in video or audio streams |
For more information, see Application SLEs.
Subscription Requirements for LEM
A Marvis for Wireless subscription is required for LEM to evaluate the user experience for wireless clients.
Key Benefits of Marvis LEM
The combination of LEM with Shapley feature ranking helps you to:
- Quickly isolate root causes of performance degradation
- Understand the underlying factors driving performance degradation
- Prioritize troubleshooting on the most impactful factors
- Proactively enhance overall user experience