WAN Edge Insights
Investigate issues affecting WAN Edges.
Finding the Insights for WAN Edges
Go to the Insights page, click the site menu at the top of the page, then click WAN Edge on the left, and then click the WAN Edge that you want to view.
WAN Edge Events
Click an event to see a summary on the right side of the page.
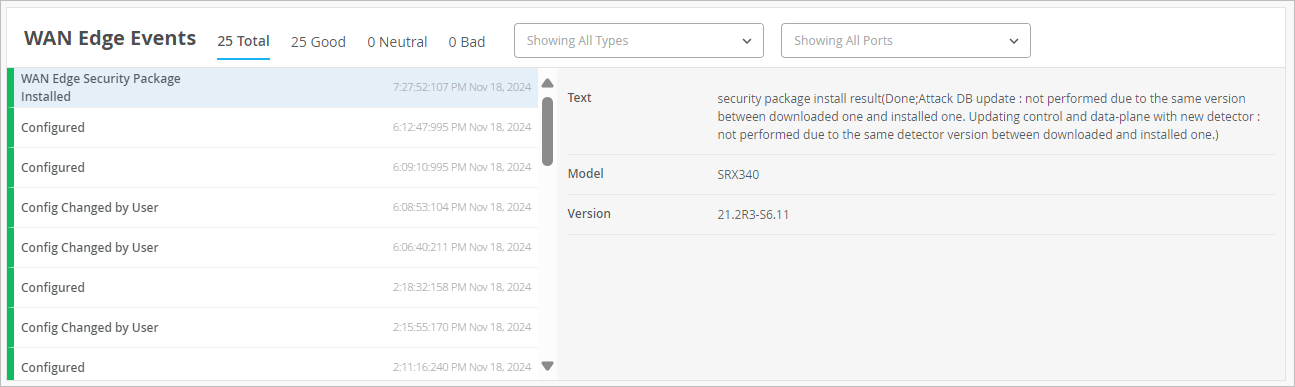
Other options:
-
Use the tabs at the top of this section to show all, good, neutral, or bad events.
-
Use the Types drop-down menu to show all types or select an event type. You can add multiple types, clicking them one by one. For more information, see WAN Edge Event Types.
-
Use the Ports drop-down menu to show all ports or select a port.
WAN Edge Event Types
At the top of the WAN Edge Events section, use the Types drop-down menu to show all types or select an event type. The even types include:
-
Assigned
-
BGP Peer State Changed
-
Bounce Port
-
Claimed
-
Config Changed by Mist
-
Config Changed by User
-
Config Failed
-
Configuration Error in Additional CLI
-
Configured
-
Get Support Files
-
HA control Link Down
-
HA Control Link Up
-
HA Health Weight Low
-
HA Health Weight Recovery
-
OSPF Neighbor Down
-
OSPF Neighbor Up
-
Path Down
-
Path Up
-
Peer Down
-
Peer Up
-
Port Down
-
Port Up
-
Reassigned
-
Restarted by User
-
RG State Change
-
Unassigned
-
Unclaimed
-
WAN Edge Alarm
-
WAN Edge App package Install Failed
-
WAN Edge ARP Failure
-
WAN Edge ARP Success
-
WAN Edge BGP Neighbor Down
-
WAN Edge BGP Neighbor Up
-
WAN Edge Certificate Regenerated
-
WAN Edge Chassis Hot
-
WAN Edge Conductor Connected
-
WAN Edge Conductor Disconnected
-
WAN Edge Config Lock Failed
-
WAN Edge Connected
-
WAN Edge DHCP Failure
-
WAN Edge DHCP Pool Exhausted
-
WAN Edge DCHP Success
-
WAN Edge Disconnected
-
WAN Edge Disconnected Long
-
WAN Edge Download Initiated (from Scheduled Operation)
-
WAN Edge Download Initiated by User
-
WAN Edge Fib Count Returned to Normal
-
WAN Edge Fib Count Threshold Exceeded
-
WAN Edge Firmware Downloaded
-
WAN Edge Flow Count Returned to Normal
-
WAN Edge Flow Count Threshold Succeeded
-
WAN Edge OSPF Neighbor Adjacency Failed
-
WAN Edge PoE Controller Upgrade Available Alarm
-
WAN Edge Port Redundancy Group State Changed
-
WAN Edge Process Start
-
WAN Edge Rebooting for Upgrade
-
WAN Edge Recovery Snapshot Failed
-
WAN Edge Recovery Snapshot Not Needed
-
WAN Edge Recovery Snapshot Not Supported
-
WAN Edge Recovery Snapshot Requested
-
WAN Edge Recovery Snapshot Succeeded
-
WAN Edge Redundancy Group State Changed
-
WAN Edge Restarted
-
WAN Edge Security Package Install Failed
-
WAN Edge Security Package Installed
-
WAN Edge Source NAT Pool Threshold Succeeded
-
WAN Edge SSH Reject Error
-
WAN Edge Support Files Upload Failed
-
WAN Edge Support Files Uploaded Successfully
-
WAN Edge Tunnel Auto Provision Failed
-
WAN Edge Tunnel Auto Provision Succeeded
-
WAN Edge Tunnel Down
-
WAN Edge Tunnel Up
-
WAN Edge Upgrade by Mist
-
WAN Edge Upgrade Complete
-
WAN Edge Upgrade Failed
-
WAN Edge Upgrade Image Uploaded
-
WAN Edge Upgrade Initiated (from Scheduled Operation)
-
WAN Edge Upgrade Initiated by User
-
WAN Edge Upgrade Pending
-
WAN Edge Upgrade Software Add
-
WAN Edge Upgrade Software Add Retry
-
WAN Edge Upgrade Storage Cleanup
-
ZTP Configuration Applied
-
ZTP Configuration Failed
-
ZTP Failed
-
ZTP Finished
-
ZTP Post Script Success
-
ZTP Post Script Complete
-
ZTP Started
Application Path Insights (Beta)
Application Path Insights are available to beta customers.
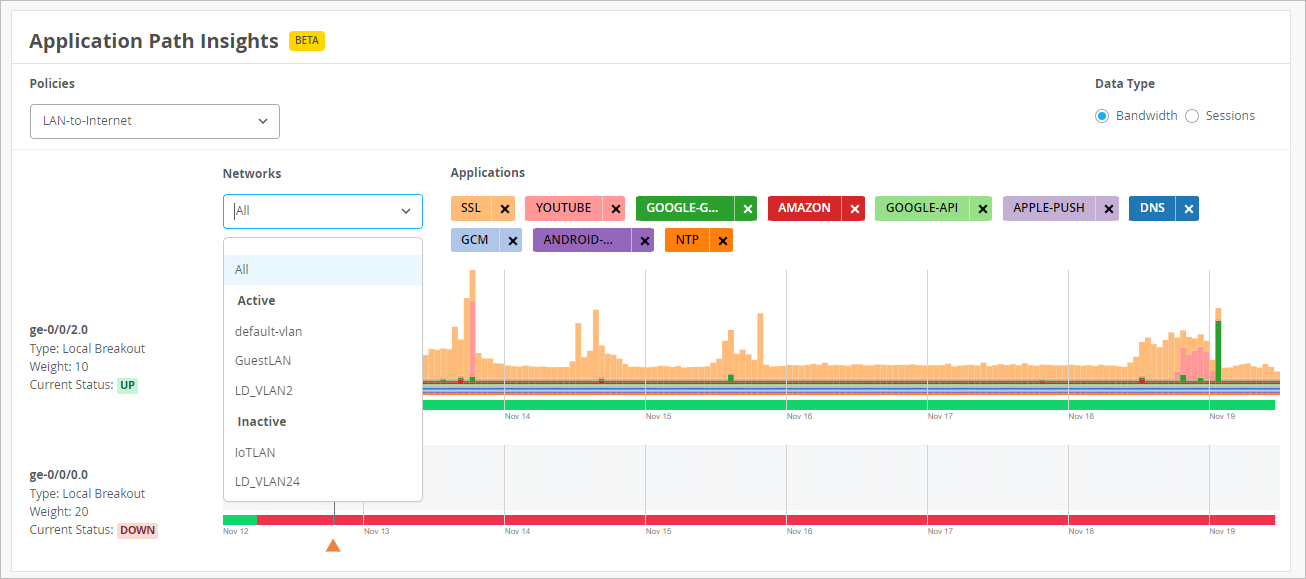
You can select the information to show the chart:
-
Policies—Select the policy to show.
-
Data Type—Select Bandwidth or Sessions.
-
Networks—Select all networks or one network.
-
Applications—Click X to remove an application. Click + to add an application. (The + button appears only if applications are hidden.)
WAN Edge Device Charts
Explore these charts to gain insights into device status.
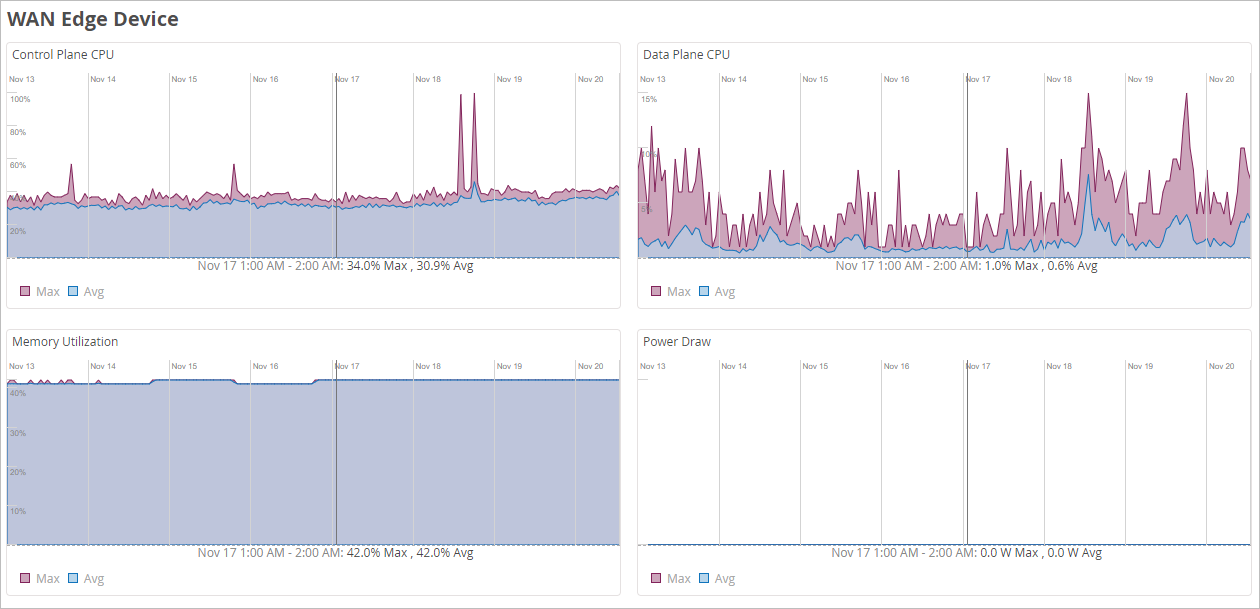
These charts include:
-
Control Plane CPU
-
Data Plane CPU
-
Memory Utilization
-
Power Draw
WAN Edge Ports
Explore these charts to gain insights into activity on each port.
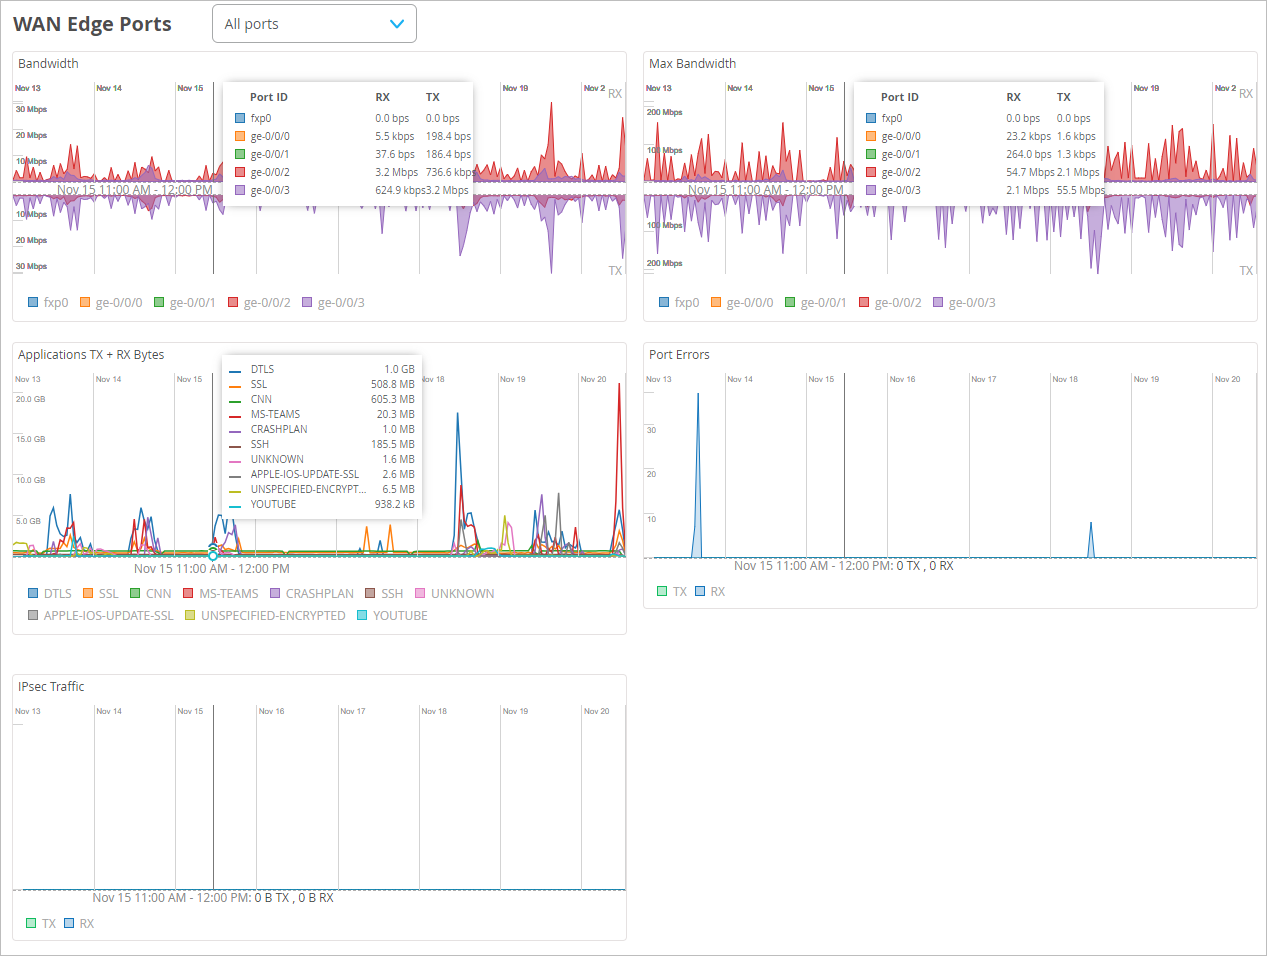
At the top of this section, select All Ports or a specific port.
In each chart, hover your mouse pointer over any data point to see the details in a pop-up box.
The charts include:
-
Bandwidth—Displays bandwidth utilization metrics in megabits per second (Mbps) for that particular interface.
-
Max Bandwidth—Displays insights into the highest point of link utilization recorded for received power signal (RX) and transmitted power signal (TX) packets in megabits per second (Mbps) on each port during the day.
-
Applications TX + RX Bytes—Displays transmit and receive data information at application-level. You can click the application name at the bottom of the chart to see clients, MAC address, IP address, device type, and bytes for bandwidth utilization.
-
Port Errors—The Port Errors graph displays port errors detected on the WAN Edge device over a period of time. It includes all possible ethernet errors reported by the port device driver. Exact types of errors vary by device driver, and the total may include but is not limited to CRC errors, collisions, etc. Errors are counted in both the transmit (TX) and receive (RX) direction. The graph displays the total for all ports, or for a particular port based on the WAN Edge Ports selection.
-
IPSec Traffic—Displays the IPsec traffic for transmit and receive packets during the day in kilobytes or megabytes.
Probe Stats
Explore latency, loss, jitter, and Mean Opinion Score for all peer paths or the worst three peer paths.
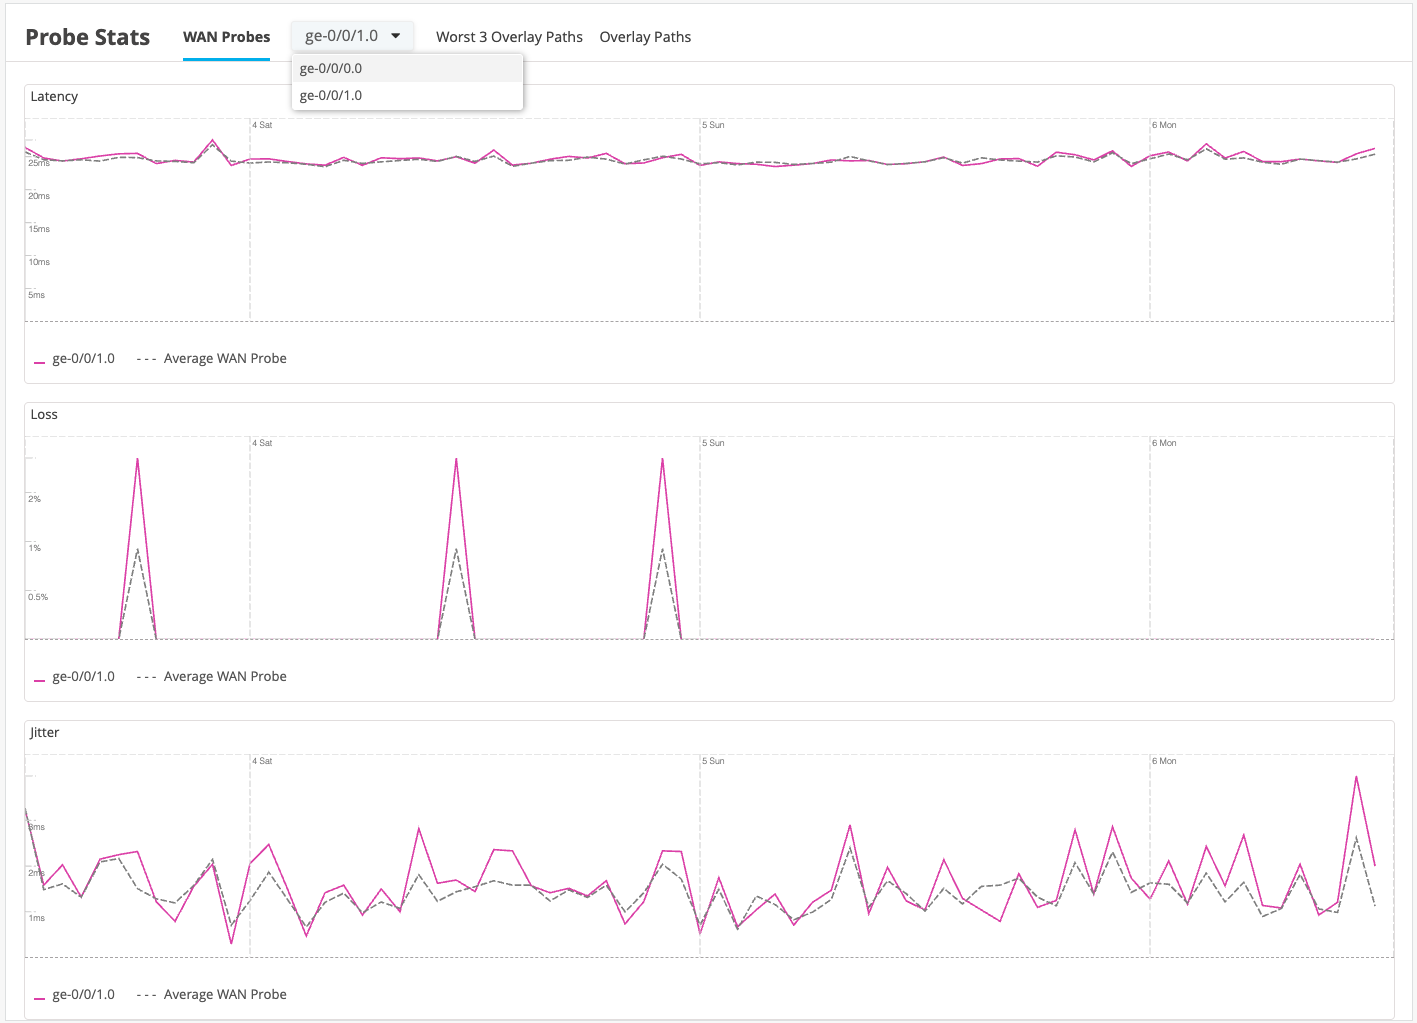
At the top of this section, use the tabs to show only the worst three paths or all paths.
In each chart, hover your mouse pointer over any data point to see the details in a pop-up box.
The charts include:
-
Latency
-
Loss
-
Jitter
-
MOS (Mean Opinion Score)
Current Values for WAN Edges
The Current Values section appears toward the bottom of the Insights page.
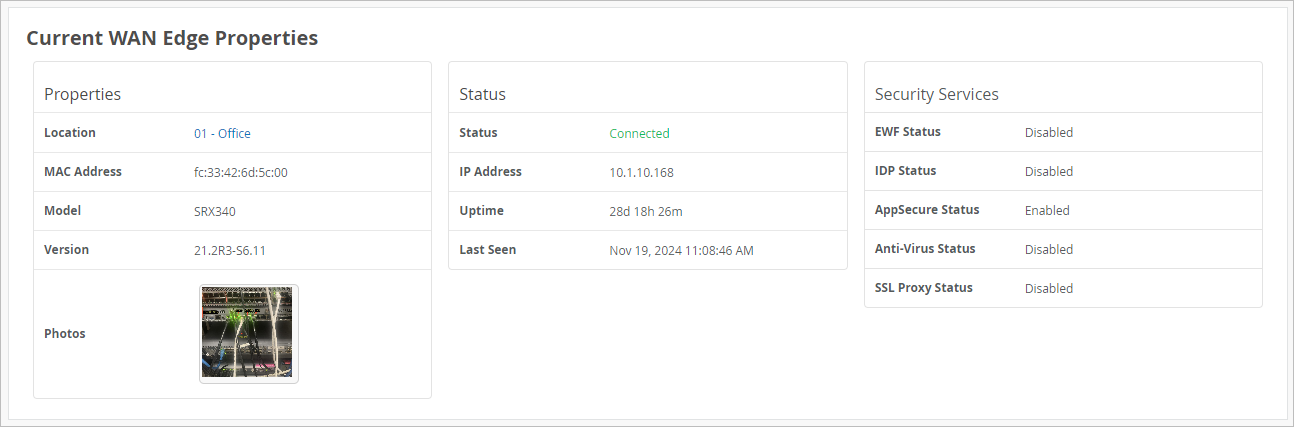
The values in this section don't change when you adjust the time range selection at the top of the page.
When you select a WAN Edge as the context, the Current Values section includes the Current WAN Edge Properties:
-
Properties—Location, MAC address, model, and firmware version
-
Status—Current status, IP address, and uptime
-
Security Services enabled or disabled