NAC Client Insights
Investigate issues affecting NAC clients.
Finding the NAC Client Insights
Go to the Insights page, click the context menu at the top of the page, then click NAC Client on the left, and then click the client that you want to view.
NAC Client Events
Click an event to see a summary on the right side of the page.
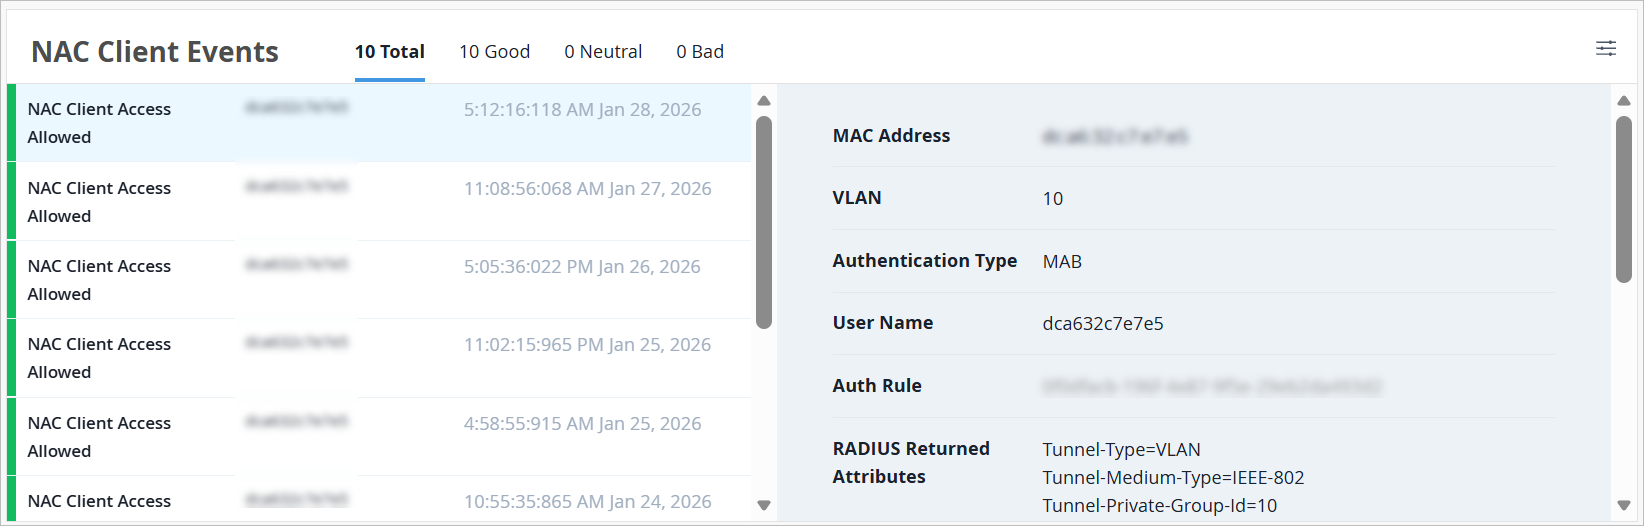
NAC Client Events appear on the Insights page when you select a NAC client as the context.
Options:
-
Use the tabs at the top of this section to show all, good, neutral, or bad events.
-
To select the event types to include, click the settings button at the top-right corner of the NAC Client Events section. For more information, see NAC Client Event Types.
-
Links—Click a link to view more information.
NAC Client Event Types
To select the event types to include, click the settings button at the top-right corner of the NAC Client Events section. In the Event Filter pop-up window, select or clear the check boxes to show or hide the events. Click OK to save your settings.
|
Positive Client Events |
Neutral Client Events |
Negative Client Events |
|---|---|---|
|
|
|
Current Values for NAC Clients
The Current Values section appears toward the bottom of the Insights page.
The values in this section don't change when you adjust the time range selection at the top of the page.
When you select a NAC client as the context, this section includes:
-
Properties—Details such as User, MAC address, Auth Type, Client Type, VLAN ID, and more
-
Connection Status—Details such as State, Client Type, and NAS Vendor