Configuring IP Monitoring
SUMMARY This section describes how to keep track of the status of the system in use.
IP Monitoring Overview
This feature monitors IP on standalone SRX Series Firewalls or a chassis cluster redundant Ethernet (reth) interface. Existing RPM probes are sent to an IP address to check for reachability. The user takes action based on the reachability result. Supported action currently is preferred static route injection to system route table.
The actions supported are:
Adding or deleting a new static route that has a higher priority (lower preference) value than a route configured through the CLI command
set routing-options static routeDefining multiple probe names under the same IP monitoring policy. If any probe fails, the action is taken. If all probes are reachable, the action is reverted
Configuring multiple tests in one RPM probe. All tests must fail for the RPM probe to be considered unreachable. If at least one test reaches its target, the RPM probe is considered reachable
Configuring multiple failure thresholds in one RPM test. If one threshold is reached, the test fails. If no thresholds are reached, the test succeeds.
Specifying the no-preempt option. If the no-preempt option is specified, the policy does not perform preemptive failback when it is in a failover state or when the RPM probe test recovers from a failure.
Setting preferred metric values. If the preferred metric value is set, during failover, the route is injected with the set preferred metric value.
Enabling and disabling interfaces.
Interface-Enable—On a physical or logical interface, when the interface-enable action is configured, the initial state of the interface is disable after startup, and it continues to remain in the disable state as long as the associated RPM probe is in the pass state. When the associated RPM probe fails, the configured physical and logical interfaces are enabled.
Interface-Disable—On a physical or logical interface, when the interface-disable action is configured, the interface state remains unchanged. When the associated RPM probe fails, the physical and logical interfaces are disabled.
Multiple probe names and actions can be defined for the same IP monitoring policy.
Understanding IP Monitoring Test Parameters
Each probed target is monitored over the course of a test, which represents a collection of probes during which statistics such as standard deviation and jitter are collected are calculated. During a test, probes are generated and responses collected at a rate defined by the probe interval, the number of seconds between probes.
To avoid flap, an action is reverted only at the end of a test cycle. During the test cycle, if no threshold is reached, the action is reverted. Although action-failover takes place based on a predefined condition of a monitored IP, when the condition is reversed, the IP becomes reachable on the original route, and the newly added route is deleted. Recovery is performed only when all RPM probes report the IP as reachable.
Table 1 lists the test parameters and its default values:
Parameter |
Default Value |
|---|---|
probe-count |
1 |
probe-interval |
3 seconds |
test-interval |
1 second |
Table 2 lists the supported threshold and its description:
Threshold |
Description |
|---|---|
Successive-Loss |
Successive loss count of probes |
Total-Loss |
Total probe lost count |
Understanding IP Monitoring Through Redundant Ethernet Interface Link Aggregation Groups
IP monitoring checks the reachability of an upstream device. It is designed to check the end-to-end connectivity of configured IP addresses and allows a redundancy group (RG) to automatically failover when the monitored IP address is not reachable through the redundant Ethernet. Both the primary and secondary devices in the chassis cluster monitor specific IP addresses to determine whether an upstream device in the network is reachable.
A redundant Ethernet interface contains physical interfaces from both the primary and secondary nodes in the SRX Series chassis cluster. In a redundant Ethernet interface, two physical interfaces are configured with each node contributing one physical interface. In a redundant Ethernet interface LAG, more than two physical interfaces are configured in the redundant Ethernet interface.
Example: Configuring IP Monitoring on SRX5000 line
This example shows how to monitor SRX Series Firewalls with chassis cluster enabled.
Requirements
You need two SRX5800 Services Gateways with identical hardware configurations, one SRX Series Firewall and one EX8208 Ethernet Switch.
Physically connect the two SRX5800 devices (back-to-back for the fabric and control ports) and ensure that they are the same models. Configure/add these two devices in a cluster.
Overview
IP address monitoring checks end-to-end reachability of configured IP address and allows a redundancy group to automatically fail over when not reachable through the child link of redundant Ethernet interface (known as a reth) interface. Redundancy groups on both devices in a cluster can be configured to monitor specific IP addresses to determine whether an upstream device in the network is reachable.
When you configure multiple IP addresses on the reth Interface in a chassis cluster setup, IP monitoring uses the first IP address from the list of IP addresses configured for that reth interface on the primary node, and the first IP address from the list of secondary IP addresses configured for that reth interface on the backup node. The first IP address is the one with smallest prefix (netmask).
This example shows how to set up IP monitoring on an SRX Series Firewall.
IP monitoring is not supported on an NP-IOC card.
IP monitoring does not support MIC online/offline status on SRX Series Firewalls.
Topology
Figure 1 shows the topology used in this example.
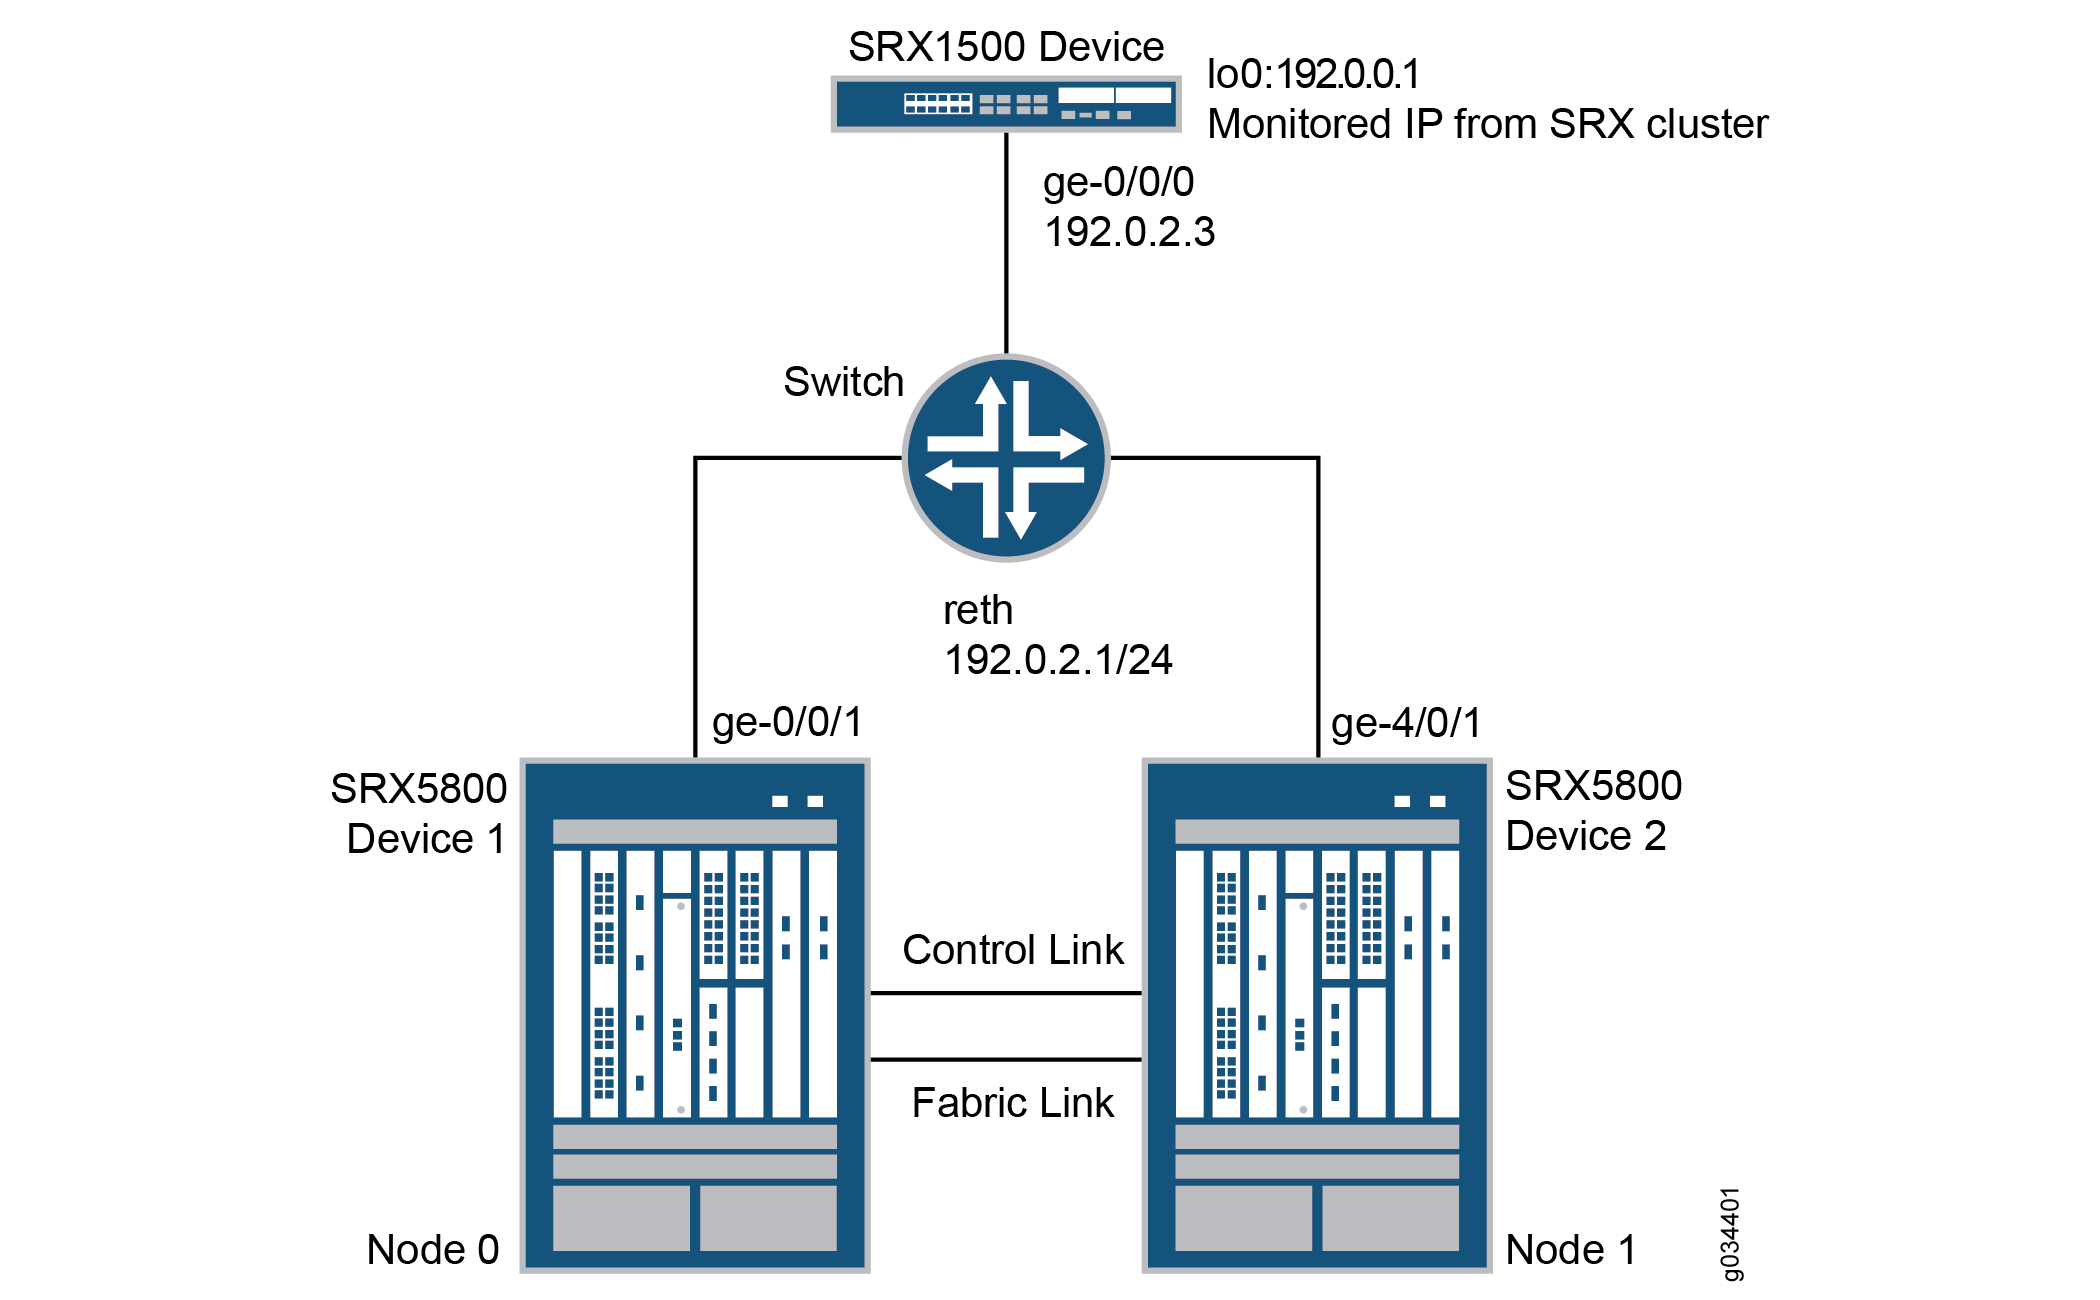
In this example, two SRX5800 devices in a chassis cluster are connected to an SRX1500 device through an EX8208 Ethernet Switch. The example shows how the redundancy groups can be configured to monitor key upstream resources reachable through redundant Ethernet interfaces on either node in a cluster.
Configuration
CLI Quick Configuration
To quickly configure this example, copy the
following commands, paste them into a text file, remove any line breaks,
change any details to match your network configuration, copy and paste
the commands into the CLI at the [edit] hierarchy level,
and then enter commit from configuration mode.
set chassis cluster reth-count 1
set chassis cluster redundancy-group 0 node 0 priority 254
set chassis cluster redundancy-group 0 node 1 priority 1
set chassis cluster redundancy-group 1 node 0 priority 200
set chassis cluster redundancy-group 1 node 1 priority 199
set chassis cluster redundancy-group 1 ip-monitoring global-weight 255
set chassis cluster redundancy-group 1 ip-monitoring global-threshold 80
set chassis cluster redundancy-group 1 ip-monitoring retry-interval 3
set chassis cluster redundancy-group 1 ip-monitoring retry-count 10
set chassis cluster redundancy-group 1 ip-monitoring family inet 192.0.0.1 weight 80
set chassis cluster redundancy-group 1 ip-monitoring family inet 192.0.0.1 interface reth0.0 secondary-ip-address 192.0.2.2
set interfaces ge-0/0/1 gigether-options redundant-parent reth0
set interfaces ge-4/0/1 gigether-options redundant-parent reth0
set interfaces reth0 redundant-ether-options redundancy-group 1
set interfaces reth0 unit 0 family inet address 192.0.2.1/24
set routing-options static route 192.0.0.1/32 next-hop 192.0.2.3
Configuring IP Monitoring on SRX Series Firewall
Step-by-Step Procedure
The following example requires you to navigate various levels in the configuration hierarchy. For instructions on how to do that, see Using the CLI Editor in Configuration Mode in the Junos OS CLI User Guide .
To configure IP monitoring on an SRX Series Firewall:
Specify the number of redundant Ethernet interfaces.
{primary:node0}[edit]
user@host# set chassis cluster reth-count 1
Specify a redundancy group's priority for primacy on each node of the cluster. The higher number takes precedence.
{primary:node0}[edit]
user@host# set chassis cluster redundancy-group 0 node 0 priority 254
user@host# set chassis cluster redundancy-group 0 node 1 priority 1
user@host# set chassis cluster redundancy-group 1 node 0 priority 200
user@host# set chassis cluster redundancy-group 1 node 1 priority 199
Configure the redundant Ethernet interfaces to redundancy-group 1.
{primary:node0}[edit]
user@host# set interfaces reth0 redundant-ether-options redundancy-group 1
user@host# set interfaces reth0 unit 0 family inet address 192.0.2.1/24
Assign child interfaces for the redundant Ethernet interfaces from node 0 and node 1.
{primary:node0}[edit]
user@host# set interfaces ge-0/0/1 gigether-options redundant-parent reth0
user@host# set interfaces ge-4/0/1 gigether-options redundant-parent reth0
Configure the static route to the IP address that is to be monitored.
{primary:node0}[edit]
user@host# set routing-options static route 192.0.0.1/32 next-hop 192.0.2.3
Configure IP monitoring under redundancy-group 1 with global weight and global threshold.
{primary:node0}[edit]
user@host# set chassis cluster redundancy-group 1 ip-monitoring global-weight 255
user@host# set chassis cluster redundancy-group 1 ip-monitoring global-threshold 80
Specify the retry interval.
{primary:node0}[edit]
user@host# set chassis cluster redundancy-group 1 ip-monitoring retry-interval 3
Specify the retry count.
{primary:node0}[edit]
user@host# set chassis cluster redundancy-group 1 ip-monitoring retry-count 10
Assign a weight to the IP address to be monitored, and configure a secondary IP address that will be used to send ICMP packets from the secondary node to track the IP being monitored.
{primary:node0}[edit] user@host# set chassis cluster redundancy-group 1 ip-monitoring family inet 192.0.0.1 weight 80 user@host# set chassis cluster redundancy-group 1 ip-monitoring family inet 192.0.0.1 interface reth0.0 secondary-ip-address 192.0.2.2Note:The redundant Ethernet (reth0) IP address, 192.0.2.1/24, is used to send ICMP packets from node 0 to check the reachability of the monitored IP.
The secondary IP address, 192.0.2.2, should belong to the same network as the reth0 IP address.
The secondary IP address is used to send ICMP packets from node 1 to check the reachability of the monitored IP.
Verification
Confirm the configuration is working properly.
- Verifying Chassis Cluster Status— Before Failover
- Verifying Chassis Cluster IP Monitoring Status— Before Failover
- Verifying Chassis Cluster Status— After Failover
- Verifying Chassis Cluster IP Monitoring Status— After Failover
Verifying Chassis Cluster Status— Before Failover
Purpose
Verify the chassis cluster status, failover status, and redundancy group information before failover.
Action
From operational mode, enter the show chassis cluster
status command.
show chassis cluster status Cluster ID: 11 Node Priority Status Preempt Manual failover Redundancy group: 0 , Failover count: 0 node0 254 primary no no node1 1 secondary no no Redundancy group: 1 , Failover count: 0 node0 200 primary no no node1 199 secondary no no
Verifying Chassis Cluster IP Monitoring Status— Before Failover
Purpose
Verify the IP status being monitored from both nodes and the failover count for both nodes before failover.
Action
From operational mode, enter the show chassis cluster
ip-monitoring status redundancy-group 1 command.
show chassis cluster ip-monitoring status redundancy-group 1 node0: -------------------------------------------------------------------------- Redundancy group: 1 IP address Status Failure count Reason 192.0.0.1 reachable 0 n/a node1: -------------------------------------------------------------------------- Redundancy group: 1 IP address Status Failure count Reason 192.0.0.1 reachable 0 n/a
Verifying Chassis Cluster Status— After Failover
Purpose
Verify the chassis cluster status, failover status, and redundancy group information after failover.
If the IP address is not reachable, the following output will be displayed.
Action
From operational mode, enter the show chassis cluster
status command.
show chassis cluster status Cluster ID: 11 Node Priority Status Preempt Manual failover Redundancy group: 0 , Failover count: 0 node0 254 primary no no node1 1 secondary no no Redundancy group: 1 , Failover count: 1 node0 0 secondary no no node1 199 primary no no
Verifying Chassis Cluster IP Monitoring Status— After Failover
Purpose
Verify the IP status being monitored from both nodes and the failover count for both nodes after failover.
Action
From operational mode, enter the show chassis cluster
ip-monitoring status redundancy-group 1 command.
show chassis cluster ip-monitoring status redundancy-group 1 node0: -------------------------------------------------------------------------- Redundancy group: 1 IP address Status Failure count Reason 192.0.0.1 unreachable 1 unknown node1: -------------------------------------------------------------------------- Redundancy group: 1 IP address Status Failure count Reason 192.0.0.1 reachable 0 n/a
Example: Configuring IP Monitoring on SRX Series Firewalls
This example shows how to monitor IP on an SRX Series Firewall.
Requirements
Before you begin:
Configure the following RPM options for RPM test:
target-address
probe-count
probe-interval
test-interval
thresholds
next-hop
Overview
This example shows how to set up IP monitoring on an SRX Series Firewall.
Configuration
Procedure
CLI Quick Configuration
To quickly configure this example, copy the
following commands, past them into a text file, remove any line breaks,
change any details to match your network configuration, copy and paste
the commands into the CLI at the [edit] hierarchy level,
and then enter commit from configuration mode.
set services rpm probe Probe-Payment-Server test paysvr target address 1.1.1.10
set services rpm probe Probe-Payment-Server test paysvr probe-count 10
set services rpm probe Probe-Payment-Server test paysvr probe-interval 5
set services rpm probe Probe-Payment-Server test paysvr test-interval 5
set services rpm probe Probe-Payment-Server test paysvr thresholds successive-loss 10
set services rpm probe Probe-Payment-Server test paysvr next-hop 2.2.2.1
set services ip-monitoring policy Payment-Server-Tracking match rpm-probe Probe-Payment-Server
set services ip-monitoring policy Payment-Server-Tracking then preferred-route route 1.1.1.0/24 next-hop 1.1.1.99
Step-by-Step Procedure
The following example requires you to navigate various levels in the configuration hierarchy. For instructions on how to do that, see Using the CLI Editor in Configuration Mode in the Junos OS CLI User Guide .
To configure IP monitoring on an SRX Series Firewall:
Configure the target address under the RPM probe.
[edit ]
user@host# set services rpm probe Probe-Payment-Server test paysvr target address 1.1.1.10
Configure the probe count under the RPM probe.
[edit ]
user@host# set services rpm probe Probe-Payment-Server test paysvr probe-count 10
Configure the probe interval (in seconds) under the RPM probe.
[edit ]
user@host# set services rpm probe Probe-Payment-Server test paysvr probe-interval 5
Configure the test interval (in seconds) under the RPM probe.
[edit ]
user@host# set services rpm probe Probe-Payment-Server test paysvr test-interval 5
Configure the threshold successive loss count under the RPM
[edit ]
user@host# set services rpm probe Probe-Payment-Server test paysvr thresholds successive-loss 10
Configure the next-hop IP address under the RPM probe.
[edit ]
user@host# set services rpm probe Probe-Payment-Server test paysvr next-hop 2.2.2.1
Configure the IP monitoring policy under services.
[edit ]
user@host# set services ip-monitoring policy Payment-Server-Tracking match rpm-probe Probe-Payment-Server
Note:The following steps are not mandatory. You can configure interface actions and route actions independently, or you can configure both the interface action and the route action together in one IP monitoring policy.
Configure the IP monitoring preferred route under services.
[edit ]
user@host# set services ip-monitoring policy Payment-Server-Tracking then preferred-route route 1.1.1.0/24 preferred-metric 4
Configure the IP monitoring interface actions.
Enable
[edit ]
user@host# set services ip-monitoring policy Payment-Server-Tracking then interface ge-0/0/1 enable
Disable
[edit ]
user@host# set services ip-monitoring policy Payment-Server-Tracking then interface fe-0/0/[4-6] disable
Configure the no-preempt option.
[edit ]
user@host# set services ip-monitoring policy Payment-Server-Tracking no-preempt
Example: Configuring Chassis Cluster Redundancy Group IP Address Monitoring
This example shows how to configure redundancy group IP address monitoring for an SRX Series Firewall in a chassis cluster.
Requirements
Before you begin:
Set the chassis cluster node ID and cluster ID. See Example: Setting the Node ID and Cluster ID for Security Devices in a Chassis Cluster
Configure the chassis cluster management interface. See Example: Configuring the Chassis Cluster Management Interface.
Configure the chassis cluster fabric. See Example: Configuring the Chassis Cluster Fabric Interfaces.
Overview
You can configure redundancy groups to monitor upstream resources by pinging specific IP addresses that are reachable through redundant Ethernet interfaces on either node in a cluster. You can also configure global threshold, weight, retry interval, and retry count parameters for a redundancy group. When a monitored IP address becomes unreachable, the weight of that monitored IP address is deducted from the redundancy group IP address monitoring global threshold. When the global threshold reaches 0, the global weight is deducted from the redundancy group threshold. The retry interval determines the ping interval for each IP address monitored by the redundancy group. The pings are sent as soon as the configuration is committed. The retry count sets the number of allowed consecutive ping failures for each IP address monitored by the redundancy group.
In this example, you configure the following settings for redundancy group 1:
IP address to monitor—10.1.1.10
IP address monitoring global-weight—100
IP address monitoring global-threshold—200
The threshold applies cumulatively to all IP addresses monitored by the redundancy group.
IP address retry-interval—3 seconds
IP address retry-count—10
Weight—100
Redundant Ethernet interface—reth1.0
Secondary IP address—10.1.1.101
Configuration
Procedure
CLI Quick Configuration
To quickly configure this example, copy the
following commands, paste them into a text file, remove any line breaks,
change any details necessary to match your network configuration,
copy and paste the commands into the CLI at the [edit] hierarchy
level, and then enter commit from configuration mode.
{primary:node0}[edit]
user@host#
set chassis cluster redundancy-group 1 ip-monitoring global-weight 100
set chassis cluster redundancy-group 1 ip-monitoring global-threshold 200
set chassis cluster redundancy-group 1 ip-monitoring retry-interval 3
set chassis cluster redundancy-group 1 ip-monitoring retry-count 10
set chassis cluster redundancy-group 1 ip-monitoring family inet 10.1.1.10 weight 100 interface reth1.0 secondary-ip-address 10.1.1.101
Step-by-Step Procedure
To configure redundancy group IP address monitoring:
Specify a global monitoring weight.
{primary:node0}[edit]
user@host# set chassis cluster redundancy-group 1 ip-monitoring global-weight 100
Specify the global monitoring threshold.
{primary:node0}[edit]
user@host# set chassis cluster redundancy-group 1 ip-monitoring global-threshold 200
Specify the retry interval.
{primary:node0}[edit]
user@host# set chassis cluster redundancy-group 1 ip-monitoring retry-interval 3
Specify the retry count.
{primary:node0}[edit]
user@host# set chassis cluster redundancy-group 1 ip-monitoring retry-count 10
Specify the IP address to be monitored, weight, redundant Ethernet interface, and secondary IP address.
{primary:node0}[edit]
user@host# set chassis cluster redundancy-group 1 ip-monitoring family inet 10.1.1.10 weight 100 interface reth1.0 secondary-ip-address 10.1.1.101
Results
From configuration mode, confirm your configuration
by entering the show chassis cluster redundancy-group 1 command. If the output does not display the intended configuration,
repeat the configuration instructions in this example to correct it.
For brevity, this show command output includes only
the configuration that is relevant to this example. Any other configuration
on the system has been replaced with ellipses (...).
{primary:node0}[edit]
user@host# show chassis cluster redundancy-group 1
ip-monitoring {
    global-weight 100;
    global-threshold 200;
    family {
        inet {
            10.1.1.10 {
                weight 100;
                interface reth1.0 secondary-ip-address 10.1.1.101;
            }
        }
    }
}
If you are done configuring the device, enter commit from configuration mode.
Verification
Verifying the Status of Monitored IP Addresses for a Redundancy Group
Purpose
Verify the status of monitored IP addresses for a redundancy group.
Action
From operational mode, enter the show chassis cluster
ip-monitoring status command. For information about a specific
group, enter the show chassis cluster ip-monitoring status redundancy-group command.
{primary:node0}
user@host> show chassis cluster ip-monitoring status
node0:
--------------------------------------------------------------------------

Redundancy group: 1
Global threshold: 200
Current threshold: -120

IP address                Status        Failure count  Reason    Weight
10.1.1.10                 reachable       0            n/a       100
10.1.1.101                reachable       0            n/a       100

node1:
--------------------------------------------------------------------------

Redundancy group: 1
Global threshold: 200
Current threshold: -120

IP address                Status        Failure count  Reason    Weight
10.1.1.10                 reachable       0            n/a       100
10.1.1.101                reachable       0            n/a       100