Perform Loopback Test for Gigabit Ethernet Interfaces
Learn how to effectively perform loopback testing for Gigabit Ethernet interfaces. This guide provides a comprehensive checklist for diagnosing hardware and circuit problems, creating and verifying loopbacks, configuring ARP entries, clearing interface statistics, and troubleshooting through pings and error checks.
Checklist to Use Loopback Test for Gigabit Ethernet Interfaces
Purpose
To use loopback testing to isolate Gigabit Ethernet Interface problems.
Action
The table below provides links and commands for using loopback testing for Gigabit Ethernet Interfaces.
Tasks |
Command or Action |
|---|---|
| Diagnose a Suspected Hardware Problem with a Gigabit Ethernet Interface | |
Connect the transmit port to the receive port. |
|
Cross pin 1 (TX+) and pin 3 (RX+) together, and pin 2 (TX-) and pin 6 (RX-) together. |
|
|
|
|
|
|
|
|
|
|
|
|
|
Perform Steps 2 through 8 from Diagnose a Suspected Hardware Problem with a Gigabit Ethernet Interface. |
|
Diagnose a Suspected Hardware Problem with a Gigabit Ethernet Interface
Problem
When you suspect a hardware problem, take the following steps to help verify if there is a problem.
Solution
To diagnose a suspected hardware problem with the Ethernet interface, follow these steps:
-
Create a Loopback
-
Verify That the Gigabit Ethernet Interface Is Up
-
Configure a Static Address Resolution Protocol Table Entry
- Clear Gigabit Ethernet Interface Statistics
-
Check for Gigabit Ethernet Interface Error Statistics
Create a Loopback
You can create a physical loopback or configure a local loopback to help diagnose a suspected hardware problem. Creating a physical loopback is recommended because it allows you to test and verify the transmit and receive ports. If a field engineer is not available to create the physical loopback, you can configure a local loopback for the interface. The local loopback creates a loopback internally in the Physical Interface Card (PIC).
- Create a Physical Loopback for a Fiber-Optic Interface
- Create a Loopback Plug for an RJ-45 Ethernet Interface
- Configure a Local Loopback
Create a Physical Loopback for a Fiber-Optic Interface
Purpose
To verify the functionality of the fiber-optic interface by testing both the transmit and receive ports. This test is typically performed by a field engineer to confirm the integrity of the connection.
Action
To create a physical loopback at the port, connect the transmit port to the receive port using a known good fiber cable.
Use single-mode fiber for a single-mode port and multimode fiber for a multimode port.
Meaning
When you create and test a physical loopback, you are effectively testing the transmit and receive capabilities of the PIC. This procedure provides a comprehensive test of the PIC, confirming that both ports are operational and the fiber-optic connection is functioning as expected.
See Also
Create a Loopback Plug for an RJ-45 Ethernet Interface
Purpose
To verify the functionality of an RJ-45 Ethernet interface by creating a physical loopback plug that allows for the testing of the interface's transmit and receive capabilities.
Action
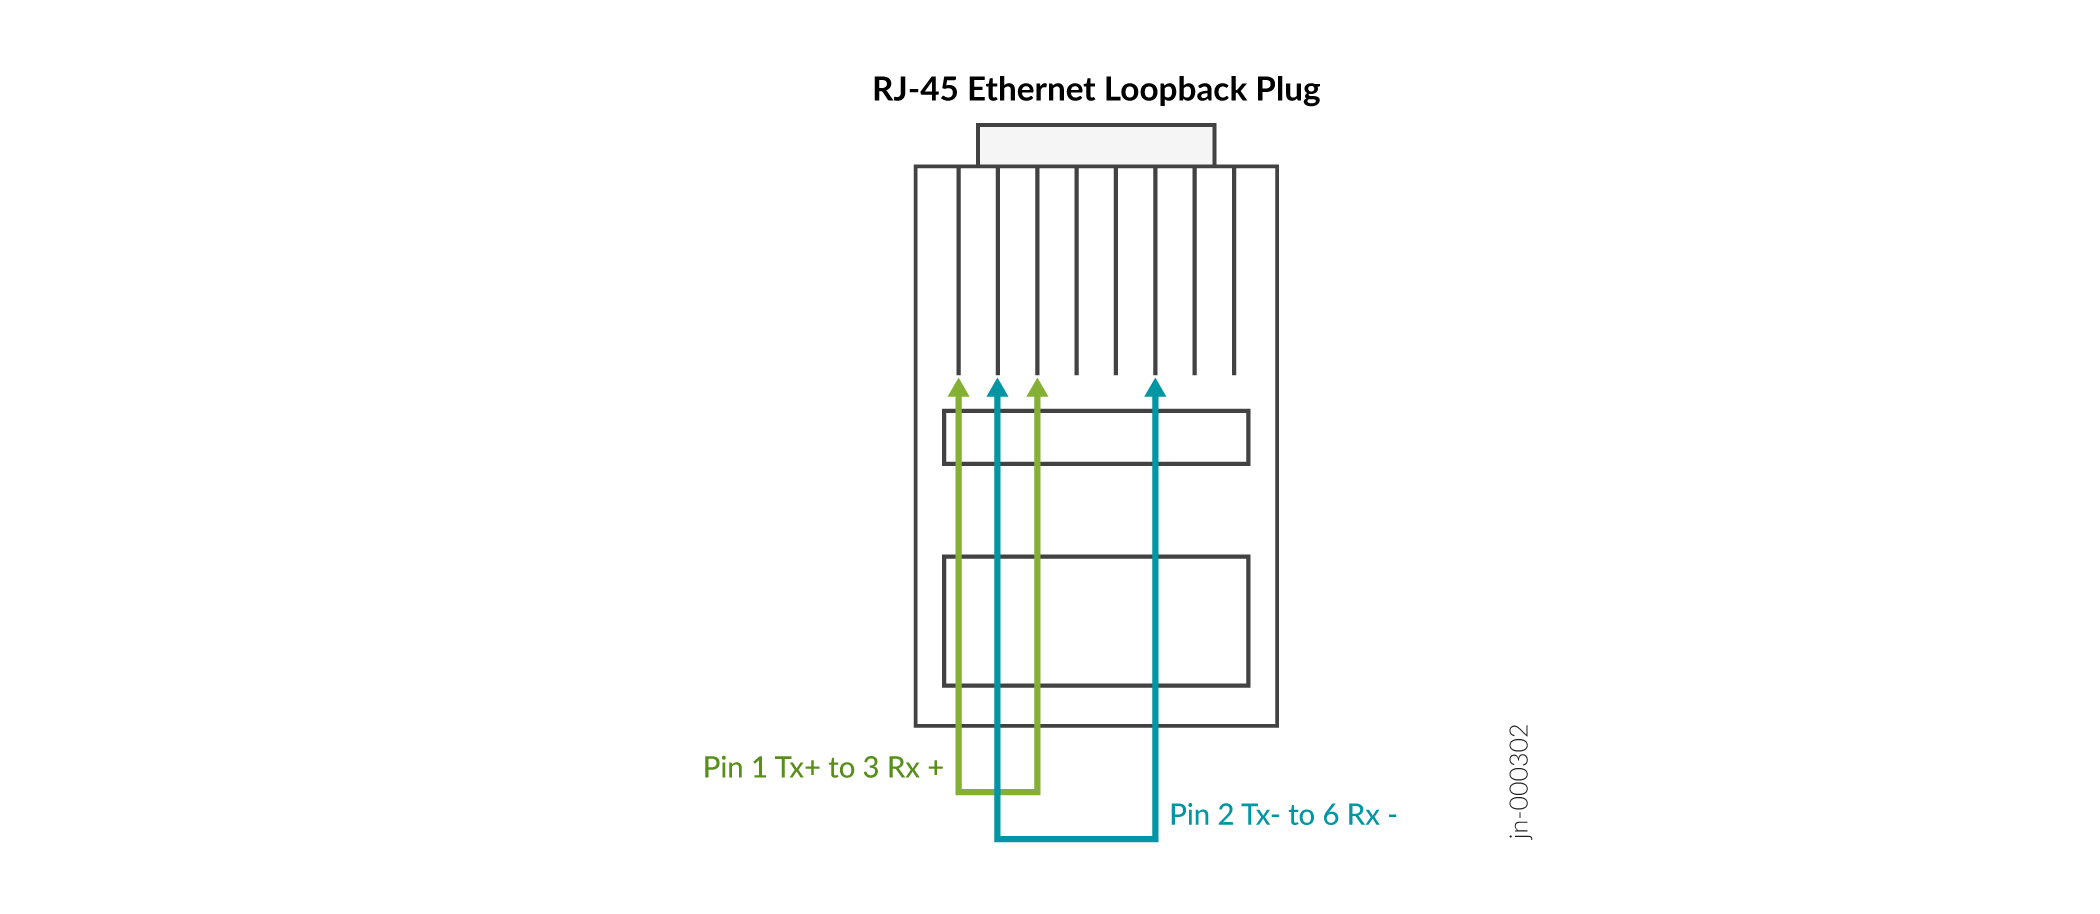
To create a loopback plug, cross pin 1 (TX+) and pin 3 (RX+) together, and cross pin 2 (TX-) and pin 6 (RX-) together. You need the following equipment to create the loopback:
-
A 6-inch long CAT5 cable
-
An RJ-45 connector
-
A crimping tool
Figure 1 illustrates how to create a loopback plug for an RJ-45 Ethernet interface.
Meaning
When you create and then test a physical loopback, you are testing the RJ-45 interface of the PIC. This action is recommended if a field engineer is available to create the physical loop as it provides a more complete test of the PIC.
See Also
Configure a Local Loopback
Purpose
To configure a local loopback on an Ethernet interface for testing the internal functionality of the PIC without a physical connection between the transmit and receive ports.
Action
To configure a local loopback without physically connecting the transmit port to the receive port, follow these steps:
In configuration mode, go to the following hierarchy level:
[edit] user@host# edit interfaces
interface-name(gigether-options)Configure the local loopback:
 [edit interfaces
                                        interface-name
(gigether-options)] user@host# set loopbackVerify the configuration:
user@host# show
For example:
[edit interfaces fe-1/0/0 gigether-options]
user@host# show loopback
Commit the change:
user@host# commit
For example:
[edit interfaces fe-1/0/0 gigether-options]
user@host# commit
commit complete
When you create a local loopback, you create an internal loop on the interface being tested. A
local loopback loops the traffic internally on that PIC. A local loopback tests the
interconnection of the PIC but does not test the transmit and receive ports. On an
Ethernet interface, you cannot create a remote loopback, therefore there is no
option to use a local or remote statement. Simply
including the loopback statement at the [edit interfaces
interface-name
(gigether-options] hierarchy level, places the interface into local
loopback mode.
Delete the loopback statement after completing the test.
Meaning
Configuring a local loopback internally loops traffic on the interface, verifying the PIC's internal connections. The show command will display the loopback statement in the interface configuration, confirming that the interface is in loopback mode. Remember to delete the loopback configuration after testing.
Verify That the Gigabit Ethernet Interface Is Up
Purpose
Display the status of the Gigabit Ethernet Interface to provide the information you need to determine whether the physical link is up or down.
Action
To verify that the status of the Gigabit Ethernet Interface is up, use the following Junos OS command-line interface (CLI) operational mode command:
user@host> show interfaces (fe-fpc/port|ge-fpc/pic/port)
Sample Output
user@host# show interfaces ge-4/0/6 extensivePhysical interface: ge-4/0/6, Enabled, Physical link is UpInterface index: 144, SNMP ifIndex: 516, Generation: 147 Link-level type: Ethernet, MTU: 1514, Speed: 1000mbps, BPDU Error: None, MAC-REWRITE Error: None,Loopback: Enabled, Source filtering: Disabled, Flow control: Enabled, Auto-negotiation: Enabled, Remote fault: Online Device flags : Present Running Loop-Detected Interface flags: SNMP-Traps Internal: 0x4000 Link flags : None CoS queues : 8 supported, 4 maximum usable queues Schedulers : 0 Hold-times : Up 0 ms, Down 0 ms Current address: 00:1f:12:fe:c5:2e, Hardware address: 00:1f:12:fe:c5:2e Last flapped : 2015-01-20 23:40:04 PST (00:02:12 ago) Statistics last cleared: Never Traffic statistics: Input bytes : 0 0 bps Output bytes : 0 0 bps Input packets: 0 0 pps Output packets: 0 0 pps IPv6 transit statistics: Input bytes : 0 Output bytes : 0 Input packets: 0 Output packets: 0 Dropped traffic statistics due to STP State: Input bytes : 0 Output bytes : 0 Input packets: 0 Output packets: 0 Input errors: Errors: 0, Drops: 0, Framing errors: 0, Runts: 0, Policed discards: 0, L3 incompletes: 0, L2 channel errors: 0, L2 mismatch timeouts: 0, FIFO errors: 0, Resource errors: 0 Output errors: Carrier transitions: 1, Errors: 0, Drops: 0, Collisions: 0, Aged packets: 0, FIFO errors: 0, HS link CRC errors: 0, MTU errors: 0, Resource errors: 0 Egress queues: 8 supported, 4 in use Queue counters: Queued packets Transmitted packets Dropped packets 0 best-effort 0 0 0 1 expedited-fo 0 0 0 2 assured-forw 0 0 0 3 network-cont 0 0 0 Queue number: Mapped forwarding classes 0 best-effort 1 expedited-forwarding 2 assured-forwarding 3 network-controlActive alarms : NoneActive defects : None MAC statistics: Receive Transmit Total octets 0 0 Total packets 0 0 Unicast packets 0 0 Broadcast packets 0 0 Multicast packets 0 0 CRC/Align errors 0 0 FIFO errors 0 0 MAC control frames 0 0 MAC pause frames 0 0 Oversized frames 0 Jabber frames 0 Fragment frames 0 VLAN tagged frames 0 Code violations 0 Filter statistics: Input packet count 0 Input packet rejects 0 Input DA rejects 0 Input SA rejects 0 Output packet count 0 Output packet pad count 0 Output packet error count 0 CAM destination filters: 0, CAM source filters: 0 Autonegotiation information: Negotiation status: Complete Link partner: Link mode: Full-duplex, Flow control: Symmetric/Asymmetric, Remote fault: OK Local resolution: Flow control: Symmetric, Remote fault: Link OK Packet Forwarding Engine configuration: Destination slot: 4 CoS information: Direction : Output CoS transmit queue Bandwidth Buffer Priority Limit % bps % usec 0 best-effort 95 950000000 95 0 low none 3 network-control 5 50000000 5 0 low none Interface transmit statistics: Disabled
Meaning
The sample output shows that the link is up and there are no alarms in this loopback configuration. When an internal loopback is configured, the physical loopback should come up without an alarm.
Sample Output
When you see that the physical link is down, there may be a problem with the port. The following output is an example of the show interfaces fe-fpc/pic/port command when the physical link is down:
user@router> show interfaces fe-1/3/0
Physical interface: fe-1/3/0, Enabled, Physical link is Down
  Interface index: 44, SNMP ifIndex: 35
  Link-level type: Ethernet, MTU: 1514, Source filtering: Disabled
  Speed: 100mbps, Loopback: Disabled, Flow control: Enabled
  Device flags   : Present Running Down
  Interface flags: Hardware-Down SNMP-Traps
  Link flags     : None
  Current address: 00:90:69:8d:2c:db, Hardware address: 00:90:69:8d:2c:db
  Input rate     : 0 bps (0 pps), Output rate: 0 bps (0 pps)
  Active alarms  : LINK
  Active defects : LINK
  MAC statistics:
    Input octets: 0, Input packets: 0, Output octets: 0, Output packets: 0
  Filter statistics:
    Filtered packets: 0, Padded packets: 0, Output packet errors: 0
  Autonegotiation information:
    Negotiation status: Incomplete, Link partner status: Down
    Reason: Link partner autonegotiation failure
    Link partner: Half-duplex, Flow control: None
Meaning
The sample output shows that the physical link is down and there are active alarms and defects.
Table 2 presents problem situations and actions for a physical link that is down.
Problem |
Action |
|---|---|
Cable mismatch |
Verify that the fiber connection is correct. |
Damaged and/or dirty cable |
Verify that the fiber can successfully loop a known good port of the same type. |
Too much or too little optical attenuation |
Verify that the attenuation is correct per the PIC optical specifications. |
The transmit port is not transmitting within the dBm optical range per the specifications |
Verify that the Tx power of the optics is within range of the PIC optical specification. |
Mismatch between the cable type and the port |
Verify that a single-mode fiber cable is connected to a single-mode interface and that a multimode fiber cable is connected to a multimode interface. (This problem does not always cause the physical link to go down; errors and dropped packets are sometimes the result.) |
Configure a Static Address Resolution Protocol Table Entry
Purpose
Configure a static Address Resolution Protocol (ARP) entry to allow a packet to be sent out of a looped Ethernet interface.
Remove the static ARP entry at the end of the loop test after you have completed the tests and monitored interface traffic.
Action
To configure a static ARP table entry for a Gigabit Ethernet interface, follow these steps. You can follow the same procedure to configure a static ARP entry for a Gigabit Ethernet interface.
Find the Media Access Control (MAC) address for the Gigabit Ethernet interface:
user@host>
show interfaces ge-fpc/pic/portPhysical interface: ge-4/0/6, Enabled, Physical link is Up Interface index: 144, SNMP ifIndex: 516, Generation: 147 Link-level type: Ethernet, MTU: 1514, Speed: 1000mbps, BPDU Error: None, MAC-REWRITE Error: None, Loopback: Enabled, Source filtering: Disabled, Flow control: Enabled, Auto-negotiation: Enabled, Remote fault: Online Device flags : Present Running Loop-Detected Interface flags: SNMP-Traps Internal: 0x4000 Link flags : None CoS queues : 8 supported, 4 maximum usable queues Schedulers : 0 Hold-times : Up 0 ms, Down 0 ms
Current address: 00:1f:12:fe:c5:2e, Hardware address: 00:1f:12:fe:c5:2eLast flapped : 2015-01-20 23:40:04 PST (00:13:49 ago) Statistics last cleared: 2015-01-20 23:46:15 PST (00:07:38 ago) Traffic statistics: Input bytes : 125500 0 bps Output bytes : 125482 0 bps Input packets: 1281 0 pps Output packets: 1281 0 pps IPv6 transit statistics: Input bytes : 0 Output bytes : 0 Input packets: 0 Output packets: 0 Dropped traffic statistics due to STP State: Input bytes : 0 Output bytes : 0 Input packets: 0 Output packets: 0 Input errors: Errors: 0, Drops: 0, Framing errors: 0, Runts: 0, Policed discards: 0, L3 incompletes: 0, L2 channel errors: 0, L2 mismatch timeouts: 0, FIFO errors: 0, Resource errors: 0 Output errors: Carrier transitions: 0, Errors: 0, Drops: 0, Collisions: 0, Aged packets: 0, FIFO errors: 0, HS link CRC errors: 0, MTU errors: 0, Resource errors: 0 Egress queues: 8 supported, 4 in use Queue counters: Queued packets Transmitted packets Dropped packets 0 best-effort 1260 1260 0 1 expedited-fo 0 0 0 2 assured-forw 0 0 0 3 network-cont 0 0 0 Queue number: Mapped forwarding classes 0 best-effort 1 expedited-forwarding 2 assured-forwarding 3 network-control Active alarms : None Active defects : None MAC statistics: Receive Transmit Total octets 130624 130624 Total packets 1281 1281 Unicast packets 1280 1280 Broadcast packets 1 1 Multicast packets 0 0 CRC/Align errors 0 0 FIFO errors 0 0 MAC control frames 0 0 MAC pause frames 0 0 Oversized frames 0 Jabber frames 0 Fragment frames 0 VLAN tagged frames 0 Code violations 0 Filter statistics: Input packet count 1281 Input packet rejects 0 Input DA rejects 0 Input SA rejects 0 Output packet count 1281 Output packet pad count 0 Output packet error count 0 CAM destination filters: 0, CAM source filters: 0 Autonegotiation information: Negotiation status: Complete Link partner: Link mode: Full-duplex, Flow control: Symmetric/Asymmetric, Remote fault: OK Local resolution: Flow control: Symmetric, Remote fault: Link OK Packet Forwarding Engine configuration: Destination slot: 4 CoS information: Direction : Output CoS transmit queue Bandwidth Buffer Priority Limit % bps % usec 0 best-effort 95 950000000 95 0 low none 3 network-control 5 50000000 5 0 low none Interface transmit statistics: Disabled Logical interface ge-4/0/6.0 (Index 72) (SNMP ifIndex 573) (Generation 137) Flags: SNMP-Traps 0x4004000 Encapsulation: ENET2 Traffic statistics: Input bytes : 125500 Output bytes : 123480 Input packets: 1281 Output packets: 1260 Local statistics: Input bytes : 60 Output bytes : 2002 Input packets: 1 Output packets: 21 Transit statistics: Input bytes : 0 0 bps Output bytes : 0 0 bps Input packets: 0 0 pps Output packets: 0 0 pps Security: Zone: HOST Allowed host-inbound traffic : any-service bfd bgp dvmrp igmp ldp msdp nhrp ospf pgm pim rip router-discovery rsvp sap vrrp Flow Statistics : Flow Input statistics : Self packets : 0 ICMP packets : 40 VPN packets : 0 Multicast packets : 0 Bytes permitted by policy : 107520 Connections established : 20 Flow Output statistics: Multicast packets : 0 Bytes permitted by policy : 107520 Flow error statistics (Packets dropped due to): Address spoofing: 0 Authentication failed: 0 Incoming NAT errors: 0 Invalid zone received packet: 0 Multiple user authentications: 0 Multiple incoming NAT: 0 No parent for a gate: 0 No one interested in self packets: 0 No minor session: 0 No more sessions: 0 No NAT gate: 0 No route present: 11 No SA for incoming SPI: 0 No tunnel found: 0 No session for a gate: 0 No zone or NULL zone binding 0 Policy denied: 0 Security association not active: 0 TCP sequence number out of window: 0 Syn-attack protection: 0 User authentication errors: 0 Protocol inet, MTU: 1500, Generation: 158, Route table: 0 Flags: Sendbcast-pkt-to-re Addresses, Flags: Is-Preferred Is-Primary Destination: 10.108.120.0/30, Local: 10.108.120.1, Broadcast: 10.108.120.3, Generation: 158 Protocol multiservice, MTU: Unlimited, Generation: 159, Route table: 0 Policer: Input: __default_arp_policer__In configuration mode, go to the following hierarchy level:
[edit] user@host# edit interfaces
interface-nameunitlogical-unit-numberfamily inet addressaddressConfigure the static ARP entry:
user@host# set arp
ip-addressmacmac-addressCommit the configuration:
user@host# commit
Verify that the static ARP entry is installed:
[edit interfaces ge-4/0/6 unit 0 family inet address 10.108.120.1/30]
user@host# run show arp no-resolve
MAC Address       Address         Interface     Flags
00:1f:12:fe:c5:2e 10.108.120.2    ge-4/0/6.0           permanent
52:54:00:7d:33:4c 10.204.128.35   fxp0.0               none
52:54:00:65:11:50 10.204.128.36   fxp0.0               none
52:54:00:da:30:82 10.204.128.37   fxp0.0               none
52:54:00:3a:cf:4b 10.204.128.38   fxp0.0               none
52:54:00:de:88:5f 10.204.128.45   fxp0.0               none
52:54:00:48:03:b7 10.204.128.46   fxp0.0               none
Meaning
The sample output is for Step 1 through Step 5 and shows that a static ARP entry was
configured on Gigabit Ethernet interface ge-4/0/6.
Clear Gigabit Ethernet Interface Statistics
Purpose
You can reset the Gigabit Ethernet Interface statistics. Resetting the statistics provides a clean start so that previous input/output errors and packet statistics do not interfere with the current diagnostics.
Action
To clear all statistics for the interface, use the following Junos OS CLI operational mode
command:
user@host> clear interfaces statistics (fe-fpc/pic/port| ge-fpc/pic/port)
Sample Output
user@host> clear interfaces statistics ge-4/0/6
user@host>
Meaning
This command clears the interface statistics counters for the Gigabit Ethernet Interface only.
Ping the Gigabit Ethernet Interface
Purpose
Use the ping command to verify the loopback connection.
Action
To send ping packets from the Ethernet interface, use the following Junos OS CLI operational mode command:
user@host> pingremote-IP-addressbypass-routing interface (fe-fpc/pic/port| ge-fpc/pic/port) count 100 rapid
Sample Output
user@router> ping 10.108.120.2 bypass-routing interface ge-7/2/1 count 100 rapid
PING 10.108.120.2 (10.108.120.2): 56 data bytes
36 bytes from 10.108.120.1: Time to live exceeded
Vr HL TOS  Len   ID Flg  off TTL Pro  cks      Src      Dst
 4  5  00 0054 e871   0 0000  01  01 cc5c 10.108.120.1  10.108.120.2
.36 bytes from 10.108.120.1: Time to live exceeded
Vr HL TOS  Len   ID Flg  off TTL Pro  cks      Src      Dst
 4  5  00 0054 e874   0 0000  01  01 cc59 10.108.120.1  10.108.120.2
.36 bytes from 10.108.120.1: Time to live exceeded
Vr HL TOS  Len   ID Flg  off TTL Pro  cks      Src      Dst
 4  5  00 0054 e878   0 0000  01  01 cc55 10.108.120.1  10.108.120.2
.36 bytes from 10.108.120.1: Time to live exceeded
Vr HL TOS  Len   ID Flg  off TTL Pro  cks      Src      Dst
 4  5  00 0054 e87c   0 0000  01  01 cc51 10.108.120.1  10.108.120.2
.36 bytes from 10.108.120.1: Time to live exceeded
Vr HL TOS  Len   ID Flg  off TTL Pro  cks      Src      Dst
 4  5  00 0054 e880   0 0000  01  01 cc4d 10.108.120.1  10.108.120.2
.36 bytes from 10.108.120.1: Time to live exceeded
Vr HL TOS  Len   ID Flg  off TTL Pro  cks      Src      Dst
 4  5  00 0054 e884   0 0000  01  01 cc49 10.108.120.1  10.108.120.2
.36 bytes from 10.108.120.1: Time to live exceeded
Meaning
-
The sample output shows that the time to live (TTL) expired, indicating that the link is receiving frames from the ping test.
- The MAC address matches the physical address of the port being tested, which allows the port to accept frames from the ping test.
-
As the packet loops over the link, a "TTL exceeded" message is expected for each ping sent.
-
These messages are generated because the ping packets repeatedly loop between the router and the physical loopback.
-
When the packet reaches the other end of the link (which doesn't exist), the loopback sends it back to the same interface, where the Packet Forwarding Engine fabric routes it again.
-
After each route lookup, the TTL decreases, and the packet is sent out through the looped interface until the TTL expires, triggering the "TTL expired" message.
-
If any errors occur, the packet is discarded, and a time-out error is displayed instead of the TTL expired message.
-
By default, the TTL for ICMP echo packets in Junos OS is 64, meaning the packet must loop 63 times before a “TTL expired” message is generated; however, you can adjust the TTL value to change the test’s tolerance for loss, such as setting it to 255, which requires the packet to loop 254 times without error before a “TTL expired” message occurs.
Check for Gigabit Ethernet Interface Error Statistics
Purpose
Persistent interface error statistics indicate that you need to open a case with the Juniper Networks Technical Assistance Center (JTAC).
Action
To check the local interface for error statistics, use the following Junos OS CLI operational mode command:
user@host>show interfaces (fe-fpc/pic/port| ge-fpc/pic/port) extensive
Sample Output
user@router> show interfaces ge-4/0/6 extensivePhysical interface: ge-4/0/6, Enabled, Physical link is UpInterface index: 144, SNMP ifIndex: 516, Generation: 147 Link-level type: Ethernet, MTU: 1514, Speed: 1000mbps, BPDU Error: None, MAC-REWRITE Error: None,Loopback: Enabled, Source filtering: Disabled, Flow control: Enabled, Auto-negotiation: Enabled, Remote fault: Online Device flags : Present Running Loop-Detected Interface flags: SNMP-Traps Internal: 0x4000 Link flags : None CoS queues : 8 supported, 4 maximum usable queues Schedulers : 0 Hold-times : Up 0 ms, Down 0 ms Current address: 00:1f:12:fe:c5:2e, Hardware address: 00:1f:12:fe:c5:2e Last flapped : 2015-01-20 23:40:04 PST (00:02:12 ago) Statistics last cleared: Never Traffic statistics: Input bytes : 0 0 bps Output bytes : 0 0 bps Input packets: 0 0 pps Output packets: 0 0 pps IPv6 transit statistics: Input bytes : 0 Output bytes : 0 Input packets: 0 Output packets: 0 Dropped traffic statistics due to STP State: Input bytes : 0 Output bytes : 0 Input packets: 0 Output packets: 0 Input errors: Errors: 0, Drops: 0, Framing errors: 0, Runts: 0, Policed discards: 0, L3 incompletes: 0, L2 channel errors: 0, L2 mismatch timeouts: 0, FIFO errors: 0, Resource errors: 0 Output errors: Carrier transitions: 1, Errors: 0, Drops: 0, Collisions: 0, Aged packets: 0, FIFO errors: 0, HS link CRC errors: 0, MTU errors: 0, Resource errors: 0 Egress queues: 8 supported, 4 in use Queue counters: Queued packets Transmitted packets Dropped packets 0 best-effort 0 0 0 1 expedited-fo 0 0 0 2 assured-forw 0 0 0 3 network-cont 0 0 0 Queue number: Mapped forwarding classes 0 best-effort 1 expedited-forwarding 2 assured-forwarding 3 network-controlActive alarms : NoneActive defects : None MAC statistics: Receive Transmit Total octets 0 0 Total packets 0 0 Unicast packets 0 0 Broadcast packets 0 0 Multicast packets 0 0 CRC/Align errors 0 0 FIFO errors 0 0 MAC control frames 0 0 MAC pause frames 0 0 Oversized frames 0 Jabber frames 0 Fragment frames 0 VLAN tagged frames 0 Code violations 0 Filter statistics: Input packet count 0 Input packet rejects 0 Input DA rejects 0 Input SA rejects 0 Output packet count 0 Output packet pad count 0 Output packet error count 0 CAM destination filters: 0, CAM source filters: 0 Autonegotiation information: Negotiation status: Complete Link partner: Link mode: Full-duplex, Flow control: Symmetric/Asymmetric, Remote fault: OK Local resolution: Flow control: Symmetric, Remote fault: Link OK Packet Forwarding Engine configuration: Destination slot: 4 CoS information: Direction : Output CoS transmit queue Bandwidth Buffer Priority Limit % bps % usec 0 best-effort 95 950000000 95 0 low none 3 network-control 5 50000000 5 0 low none Interface transmit statistics: Disabled
Meaning
Check for any error statistics. There should not be
any input or output errors. If there are any persistent input or output
errors, open a case with the Juniper Networks Technical Assistance
Center (JTAC) at support@juniper.net, or at 1-888-314-JTAC
(within the United States) or 1-408-745-9500 (from outside the United
States).
Diagnose a Suspected Circuit Problem
Purpose
When you suspect a circuit problem, it is important to work with the transport-layer engineer to resolve the problem. The transport-layer engineer may create a loop to the router from various points in the network. You can then perform tests to verify the connection from the router to that loopback in the network.
Action
After the transport-layer engineer has created the loop to the router from the network, you must verify the connection from the router to the loopback in the network. Follow Step 2 through Step 8 in Diagnose a Suspected Hardware Problem with a Gigabit Ethernet Interface. Any problems encountered in the test indicate a problem with the connection from the router to the loopback in the network.
By performing tests to loopbacks at various points in the network, you can isolate the source of the problem.