Understanding CoS Congestion Management
A congestion in a network occurs because of various parameters and some packets must be dropped to avoid congestion and to facilitate easy flow of traffic in the network. On Juniper Networks EX Series Ethernet Switches, class of service (CoS) provides congestion management mechanisms for a switch to drop arriving packets based on certain parameters when a queue is full. Based on the EX Series switch that you are using, packets are dropped depending on either the priority of a packet or on both priority and drop probability of a packet.
You can specify parameters at the [edit class-of-service
drop-profiles] hierarchy level for dropping packets and reference
the parameters in a scheduler configuration.
Weighted Tail Drop Congestion Management
Weighted tail drop (WTD) is a congestion management mechanism to drop packets from the tail of the queue when the queue reaches a certain buffer capacity (that is, fill level). Hence the name weighted tail drop. The packets that are dropped are based on priority and are those marked with a packet loss priority (PLP) of high. You can configure a WTD profile (a WTD mechanism) usually on edge devices in a network.
When you configure a WTD profile, you are essentially setting the value for queue fullness. The queue fullness represents a percentage of the memory, known as delay-buffer bandwidth, that is used to store packets in relation to the total amount of memory that has been allocated for that specific queue. The delay-buffer bandwidth provides packet buffer space to absorb burst traffic up to the specified duration of delay. When the specified delay buffer becomes full, packets are dropped from the tail of the buffer.
By default, if you do not configure any drop profile, WTD profile is in effect and functions as the primary mechanism for managing congestion.
The default WTD profile associated with the packets whose PLP is low cannot be modified. You can configure custom drop profile only for those packets whose PLP is high.
Weighted Random Early Detection Congestion Management
In weighted random early detection (WRED) congestion management, random packets with a PLP of low or high are gradually dropped (based on drop probability) when the queue reaches a certain buffer capacity.
The WRED mechanism is supported only on Juniper Networks EX4300 standalone switches, EX4300 Virtual Chassis, EX4600 standalone switches, and EX9200 standalone switches.
Following are the different implementations of WRED:
-
Segmented Drop Profile
-
Interpolated Drop Profile
From a high level, segmented drop profile is a stair-step-like drop profile, whereas interpolated
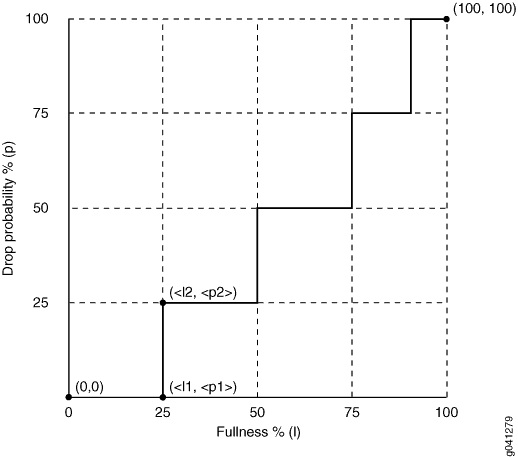
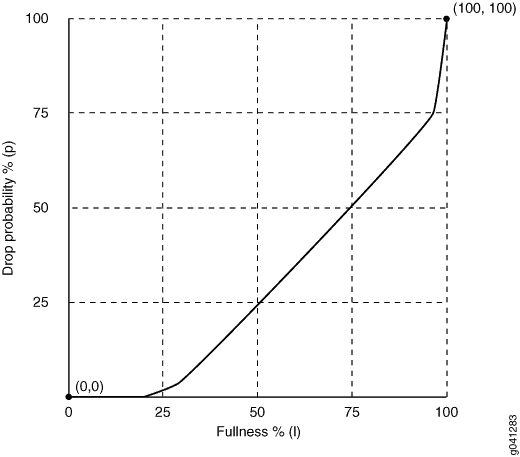
drop profile is a smother (curve) drop profile. Figure 1 and Figure 2
show a graphical representation of segmented and interpolated drop profiles.
Regardless of the implementation, a drop profile represents a graph where the
x-axis represents the percentage of fill level (l) and the
y-axis represents the percentage of drop probability (p). The
origin (0,0) represents the drop profile in which the drop probability is 0 percent
when the queue fullness is 0 percent, and the point (100,100) represents that the
drop probability is 100 percent when the queue fullness is 100 percent. Although the
formation of graph lines in Figure 1 and Figure 2
is different, the application of the profile is the same. When a packet reaches the
head of the queue, a random number between 0 and 100 is calculated. This random
number is plotted against the drop profile graph using the current queue fullness of
that particular queue. When the random number falls above the graph line, the packet
is transmitted. When the number falls below the graph line, the packet is dropped
from the network.
The following sections discuss the WRED drop profile implementations and parameters.
Segmented Drop Profile
In a segmented drop profile configuration, you can define multiple data points for fill level and drop probability. Figure 1 shows a graphical representation of a segmented drop profile.

To create the profile's graph line, the software begins at the bottom-left corner of the graph, representing a 0 percent fill level and a 0 percent drop probability (that is the point (0,0)). The configuration draws a line directly to the right until it reaches the first defined fill level (that is, 25 percent represented in the graph on the x-axis). The software then continues the line vertically until the first drop probability is reached (that is, 25 percent represented in the graph in the y-axis). This process is repeated for all of the defined fill levels and drop probabilities until the top-right corner of the graph is reached (that is point (100,100) in the graph).
Interpolated Drop Profile
An interpolated drop profile configuration forms a smoother graph line compared to the graph in a segmented drop profile configuration. In this method of congestion management also, a switch uses multiple drop profile values to drop incoming packets to reduce congestion in the output queue.
Following are interpolated drop profile configurations on EX Series switches:
Interpolated Drop Profile Configuration on EX Series Switches Except EX4300 Switches
An interpolated drop profile on all EX Series switches except EX4300 switches automatically generates 64 pairs of data points on the graph beginning at (0, 0) and ending at (100, 100). Along the way, the graph line intersects specific data points that you define for fullness and drop probability.
Figure 2 shows a graphical representation of an interpolated drop profile.

Interpolated Drop Profile Configuration on EX4300 Switches
On EX4300 switches, you can set two queue fill levels and two drop probabilities in each drop profile. The two fill levels and the two drop probabilities create two pairs of values. The first fill level and the first drop probability create one value pair. The second fill level and the second drop probability create the second value pair.
You can configure a maximum of 64 drop profiles on EX4300 switches.
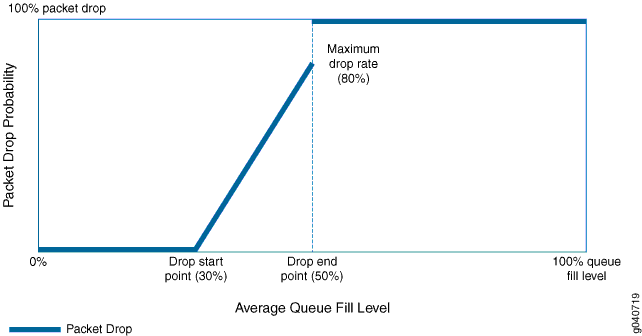
The first fill level value specifies the percentage of queue fullness at which packets begin to drop, known as the drop start point. Until the queue reaches this level of fullness, no packets are dropped. The second fill level value specifies the percentage of queue fullness at which all packets are dropped, known as the drop endpoint.
The first drop probability value is always 0 (zero). This pairs
with the drop start point and specifies that until the queue fullness level
reaches the first fill level, no packets drop. When the queue fullness exceeds
the drop start point, packets begin to drop until the queue exceeds the second
fill level, when all packets drop. The second drop probability value, known as
the maximum drop rate, specifies the likelihood of dropping packets when the
queue fullness reaches the drop end point. As the queue fills from the drop
start point to the drop end point, packets drop in a smooth, linear pattern
(called an interpolated graph) as shown in Figure 3. After the drop end point, all packets drop.

The thick line in Figure 3 shows the packet drop characteristics for a sample tail drop profile. At the drop start point, the queue reaches a fill level of 30 percent. At the drop end point, the queue fill level reaches 50 percent, and the maximum drop rate is 80 percent.
No packets drop until the queue fill level reaches the drop start point of 30 percent. When the queue reaches the 30 percent fill level, packets begin to drop. As the queue fills, the percentage of packets dropped increases in a linear fashion. When the queue fills to the drop endpoint of 50 percent, the rate of packet drop has increased to the maximum drop rate of 80 percent. When the queue fill level exceeds the drop endpoint of 50 percent, all of the packets drop until the queue fill level drops below 50 percent.
Drop Profile Parameters
You can specify the following two values in drop profile configuration:
-
Fill level—The queue fullness value, which represents a percentage of the memory used to store packets in relation to the total amount of memory allocated to the queue.
-
Drop probability—The percentage value that corresponds to the likelihood that an individual packet is dropped.
