Monitor Chassis Cluster Interfaces
Learn interface monitoring, which tracks the operational state of an interface by determining whether it is up or down. If one or more monitored interfaces fail, the associated redundancy group fails over to the other node in the cluster.
Chassis Cluster Redundancy Group Interface Monitoring
For a redundancy group to automatically failover to the peer node, its interfaces must be configured for monitoring. When you configure a redundancy group, you can specify a set of interfaces whose operational status (up or down) is monitored to determine the health of the group. A monitored interface can be a child interface of any redundant Ethernet interface.associated with the redundancy group. Each monitored interface is assigned a weight.
Every redundancy group has a threshold tolerance value, which is set to 255 by default. When a monitored interface becomes unavailable, its configured weight is subtracted from the redundancy group's threshold. When the threshold reaches 0, the redundancy group fails over to the other node. For example, if redundancy group 1 is primary on node 0, and its threshold reaches 0, redundancy group 1 fails over and becomes primary on node 1. At that point, all child interfaces of the redundant Ethernet interfaces associated with redundancy group 1 on node 1 begin forwarding traffic.
You can verify the interface weight by running the following operational mode commands:
-
show chassis cluster information
-
show chassis cluster interfaces
We do not recommend configuring data plane features, such as interface monitoring and IP monitoring, on redundancy group 0 (RG0) for Firewalls in a chassis cluster.
Use redundancy group 0 (RG0) manual failovers with caution. An RG0 failover results in a a Routing Engine (RE) failover, during which all processes running on the current primary node are terminated and then restarted on the new primary Routing Engine (RE). This process can cause loss of state, such as routing information, and may temporarily degrade system performance due to increased system churn.
A redundancy group failover occurs when the cumulative weight of the redundancy group's monitored interfaces reduces its threshold value to 0. If the monitored interfaces of a redundancy group on both nodes reach their thresholds at the same time, the redundancy group becomes primary on the node with the lower node ID. In a two-node cluster, this is node 0.
-
To reduce the frequency of failovers caused by interface monitoring failures, use the
hold-down-intervalstatement. -
If a failover occurs for redundancy group 0 (RG0), interface monitoring on the RG0 secondary node is disabled for 30 seconds. This behavior prevents other redundancy groups from failing over simultaneously with the RG0 failover.
Benefits of Monitoring Chassis Cluster Redundancy Group Interfaces
-
Determines the operational status of a specific interface in a chassis cluster as monitored by a given redundancy group.
-
Enables automatic failover of the interface to the peer node if the interface goes down.
See Also
Example: Configure Chassis Cluster Redundancy Group Interface Monitoring
This example shows how to configure an interface to be monitored by a specific redundancy group for automatic failover to the peer node. It also shows how to assign a weight to the monitored interface and how to verify the remaining threshold by configuring two interfaces on each node and associating them with redundancy groups.
Requirements
Before you begin, create a redundancy group. See Example: Configuring Chassis Cluster Redundancy Groups.
Overview
To determine the remaining redundancy group threshold after a monitored interface goes down, you can configure the system to monitor the health of the interfaces associated with a redundancy group. When you assign a weight to a monitored interface, the system continuously checks the interface's availability. If a physical interface fails, its configured weight is subtracted from the threshold of the associated redundancy group .
Each
redundancy group has a
default
threshold
value
of 255.
When
the threshold
is
reduced to 0, a failover is triggered, even if the redundancy
group is
configured
for
manual failover
and
the preempt option is not enabled.
In this example, you verify the remaining threshold behavior by configuring two interfaces on each node and associating them to redundancy group 1 (RG1), each with different weights. The interfaces on node 0 are assigned weights of 130 and 140, while the interfaces on node 1 are assigned weights of 150 and 120. Additionally, one interface from each node is configured and associated with redundancy group 2 (RG2), using the default interface weight of 255.
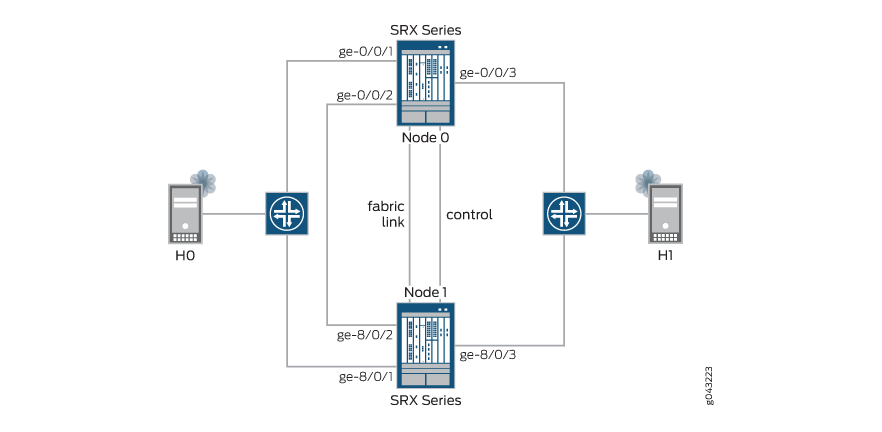
Figure 1 illustrates the network topology used in this example.
Topology
Configuration
CLI Quick Configuration
To quickly configure this example, copy the
following commands, paste them into a text file, remove any line breaks,
change any details necessary to match your network configuration,
copy and paste the commands into the CLI at the edit hierarchy
level, and then enter commit from configuration
mode.
set chassis cluster reth-count 3
set chassis cluster redundancy-group 0 node 0 priority 254
set chassis cluster redundancy-group 0 node 1 priority 1
set chassis cluster redundancy-group 1 node 0 priority 200
set chassis cluster redundancy-group 1 node 1 priority 100
set chassis cluster redundancy-group 1 interface-monitor ge-0/0/1 weight 130
set chassis cluster redundancy-group 1 interface-monitor ge-0/0/2 weight 140
set chassis cluster redundancy-group 1 interface-monitor ge-8/0/1 weight 150
set chassis cluster redundancy-group 1 interface-monitor ge-8/0/2 weight 120
set chassis cluster redundancy-group 2 node 0 priority 200
set chassis cluster redundancy-group 2 node 1 priority 100
set chassis cluster redundancy-group 2 interface-monitor ge-0/0/3 weight 255
set chassis cluster redundancy-group 2 interface-monitor ge-8/0/3 weight 255
set interfaces ge-0/0/1 gigether-options redundant-parent reth0
set interfaces ge-0/0/2 gigether-options redundant-parent reth1
set interfaces ge-0/0/3 gigether-options redundant-parent reth2
set interfaces ge-8/0/1 gigether-options redundant-parent reth0
set interfaces ge-8/0/2 gigether-options redundant-parent reth1
set interfaces ge-8/0/3 gigether-options redundant-parent reth2
set interfaces reth0 redundant-ether-options redundancy-group 1
set interfaces reth0 unit 0 family inet address 10.1.1.1/24
set interfaces reth1 redundant-ether-options redundancy-group 1
set interfaces reth1 unit 0 family inet address 10.2.2.2/24
set interfaces reth2 redundant-ether-options redundancy-group 2
set interfaces reth2 unit 0 family inet address 10.3.3.3/24
Procedure
Step-by-Step Procedure
The following example requires you to navigate various levels in the configuration hierarchy. For instructions on how to do that, see Using the CLI Editor in Configuration Mode in the Junos OS CLI User Guide.
To configure chassis cluster interface monitoring:
-
Specify the number of redundant Ethernet interfaces.
[edit chassis cluster]
user@host# set reth-count 3
-
Set up redundancy group 0 for the Routing Engine failover properties, and set up RG1 and RG2 (all interfaces are in one redundancy group in this example) to define the failover properties for the redundant Ethernet interfaces.
[edit chassis cluster]
user@host# set redundancy-group 0 node 0 priority 254
user@host# set redundancy-group 0 node 1 priority 1
user@host# set redundancy-group 1 node 0 priority 200
user@host# set redundancy-group 1 node 1 priority 100
user@host# set redundancy-group 2 node 0 priority 200
user@host# set redundancy-group 2 node 1 priority 100
-
Set up interface monitoring to monitor the health of the interfaces and trigger redundancy group failover.
We do not recommend enabling interface monitoring for RG0, because interface flaps can cause the control plane to switch between nodes.
[edit chassis cluster]
user@host# set redundancy-group 1 interface-monitor ge-0/0/1 weight 130
user@host# set redundancy-group 1 interface-monitor ge-0/0/2 weight 140
user@host# set redundancy-group 1 interface-monitor ge-8/0/1 weight 150
user@host# set redundancy-group 1 interface-monitor ge-0/0/2 weight 120
user@host# set redundancy-group 2 interface-monitor ge-0/0/3 weight 255
user@host# set redundancy-group 2 interface-monitor ge-8/0/3 weight 255
Interface failover occurs only when the redundancy group's threshold reaches zero.
-
Set up the redundant Ethernet (reth) interfaces and assign them to a zone.
[edit interfaces]
user@host# set ge-0/0/1 gigether-options redundant-parent reth0
user@host# set ge-0/0/2 gigether-options redundant-parent reth1
user@host# set ge-0/0/3 gigether-options redundant-parent reth2
user@host# set ge-8/0/1 gigether-options redundant-parent reth0
user@host# set ge-8/0/2 gigether-options redundant-parent reth1
user@host# set ge-8/0/3 gigether-options redundant-parent reth2
user@host# set reth0 redundant-ether-options redundancy-group 1
user@host# set reth0 unit 0 family inet address 10.1.1.1/24
user@host# set reth1 redundant-ether-options redundancy-group 1
user@host# set reth1 unit 0 family inet address 10.2.2.2/24
user@host# set reth2 redundant-ether-options redundancy-group 2
user@host# set reth2 unit 0 family inet address 10.3.3.3/24
Results
From configuration mode, confirm your configuration
by entering the show chassis and show interfaces commands. If the output does not display the intended configuration,
repeat the configuration instructions in this example to correct it.
[edit]
user@host# show chassis
    cluster {
        reth-count 3;
        redundancy-group 0 {
            node 0 priority 254;
            node 1 priority 1;
        }
        redundancy-group 1 {
            node 0 priority 200;
            node 1 priority 100;
            interface-monitor {
                ge-0/0/1 weight 130;
                ge-0/0/2 weight 140;
                ge-8/0/1 weight 150;
                ge-8/0/2 weight 120;
            }
        }
        redundancy-group 2 {
            node 0 priority 200;
            node 1 priority 100;
            interface-monitor {
                ge-0/0/3 weight 255;
                ge-8/0/3 weight 255;
            }
        }
    }
[edit]
user@host# show interfaces
ge-0/0/1 {
    gigether-options {
        redundant-parent reth0;
    }
}
ge-0/0/2 {
    gigether-options {
        redundant-parent reth1;
    }
}
ge-0/0/3 {
    gigether-options {
        redundant-parent reth2;
    }
}
ge-8/0/1 {
    gigether-options {
        redundant-parent reth0;
    }
}
ge-8/0/2 {
    gigether-options {
        redundant-parent reth1;
    }
}
ge-8/0/3 {
    gigether-options {
        redundant-parent reth2;
    }
}
reth0 {
    redundant-ether-options {
        redundancy-group 1;
    }
    unit 0 {
        family inet {
            address 10.1.1.1/24;
        }
    }
}
reth1 {
    redundant-ether-options {
        redundancy-group 1;
    }
    unit 0 {
        family inet {
            address 10.2.2.2/24;
        }
    }
}
reth2 {
    redundant-ether-options {
        redundancy-group 2;
    }
    unit 0 {
        family inet {
            address 10.3.3.3/24;
        }
    }
}
If you are done configuring the device, enter commit from configuration mode.
Verification
The following sections guide you through verifying and, when necessary , troubleshooting interface status. The process shows how to check the status of each interface in a redundancy group, verify the status after interfaces are disabled, and review detailed information for each interface until all interfaces in the redundancy group have been examined.
- Verify Chassis Cluster Status
- Verify Chassis Cluster Interfaces
- Verify Chassis Cluster Information
- Verifyi Interface ge-0/0/1 Status After Disabling Interface ge-0/0/1 of RG1 in Node 0 with a Weight of 130
- Verify Chassis Cluster Status After Disabling Interface ge-0/0/1 of RG1 in Node 0 with a Weight of 130
- Verify Chassis Cluster Interfaces After Disabling Interface ge-0/0/1 of RG1 in Node 0 with a Weight of 130
- Verify Chassis Cluster Information After Disabling Interface ge-0/0/1 of RG1 in Node 0 with a Weight of 130
- Verify Interface ge-0/0/2 Is Disabled
- Verify Chassis Cluster Status After Disabling Interface ge-0/0/2
- Verify Chassis Cluster Interfaces After Disabling Interface ge-0/0/2
- Verify Chassis Cluster Information After Disabling Interface ge-0/0/2
- Verify Interface Status After Disabling ge-0/0/3
- Verify Chassis Cluster Status After Disabling Interface ge-0/0/3
- Verify Chassis Cluster Interfaces After Disabling Interface ge-0/0/3
- Verify Chassis Cluster Information After Disabling Interface ge-0/0/3
- Verify Interface ge-0/0/2 Is Enabled
- Verify Chassis Cluster Status After Enabling Interface ge-0/0/2
- Verify Chassis Cluster Interfaces After Enabling Interface ge-0/0/2
- Verify Chassis Cluster Information After Enabling Interface ge-0/0/2
- Verify Chassis Cluster RG2 Preempt
- Verify Chassis Cluster Status After Preempting RG2
- Verify Interface ge-0/0/3 Is Enabled
- Verify Chassis Cluster Status After Enabling Interface ge-0/0/3
- Verify Chassis Cluster Interfaces After Enabling Interface ge-0/0/3
- Verify Chassis Cluster Information After Enabling Interface ge-0/0/3
Verify Chassis Cluster Status
Purpose
Verify the chassis cluster status, failover status, and redundancy group information.
Action
From operational mode, enter the show chassis cluster status
command.
{primary:node0}
user@host> show chassis cluster status
Monitor Failure codes:
    CS  Cold Sync monitoring        FL  Fabric Connection monitoring
    GR  GRES monitoring             HW  Hardware monitoring
    IF  Interface monitoring        IP  IP monitoring
    LB  Loopback monitoring         MB  Mbuf monitoring
    NH  Nexthop monitoring          NP  NPC monitoring
    SP  SPU monitoring              SM  Schedule monitoring
    CF  Config Sync monitoring

Cluster ID: 2
Node   Priority Status         Preempt Manual   Monitor-failures

Redundancy group: 0 , Failover count: 1
node0  254      primary        no      no       None
node1  1        secondary      no      no       None

Redundancy group: 1 , Failover count: 1
node0  200      primary        no      no       None
node1  100      secondary      no      no       None

Redundancy group: 2 , Failover count: 1
node0  200      primary        no      no       None
node1  100      secondary      no      no       None
Meaning
Use the show chassis cluster status command to confirm that
devices in the chassis cluster are communicating properly, with one device
functioning as the primary node and the other as the secondary node.
Verify Chassis Cluster Interfaces
Purpose
Verify information about the statistics of the different objects being synchronized, the fabric and control interface hellos, and the status of the monitoring interfaces in the cluster.
Action
From operational mode, enter the show chassis cluster
interfaces command.
{primary:node0}
user@host> show chassis cluster interfaces
Control link status: Up

Control interfaces:
    Index   Interface   Monitored-Status   Internal-SA
    0       em0         Up                 Disabled
    1       em1         Down               Disabled

Fabric link status: Up

Fabric interfaces:
    Name    Child-interface    Status
                               (Physical/Monitored)
    fab0    ge-0/0/0           Up   / Up
    fab0
    fab1    ge-8/0/0           Up   / Up
    fab1

Redundant-ethernet Information:
    Name         Status      Redundancy-group
    reth0        Up          1
    reth1        Up          1
    reth2        Up          2

Redundant-pseudo-interface Information:
    Name         Status      Redundancy-group
    lo0          Up          0

Interface Monitoring:
    Interface         Weight    Status    Redundancy-group
    ge-8/0/2          120       Up        1
    ge-8/0/1          150       Up        1
    ge-0/0/2          140       Up        1
    ge-0/0/1          130       Up        1
    ge-8/0/3          255       Up        2
    ge-0/0/3          255       Up        2
Meaning
The sample output confirms that monitoring interfaces are up and that the
weight of each interface being monitored is displayed correctly as
configured. These values do not change if the interface goes up or down. The
weights only change for the redundant group and can be viewed when you use
the show chassis cluster information command.
Verify Chassis Cluster Information
Purpose
Verify information about the statistics of the different objects being synchronized, the fabric and control interface hellos, and the status of the monitoring interfaces in the cluster.
Action
From operational mode, enter the show chassis cluster
information command.
{primary:node0}
user@host> show chassis cluster information

node0:
--------------------------------------------------------------------------
Redundancy Group Information:

    Redundancy Group 0 , Current State: primary, Weight: 255

        Time            From           To             Reason
        Feb 24 22:56:27 hold           secondary      Hold timer expired
        Feb 24 22:56:34 secondary      primary        Better priority (254/1)

    Redundancy Group 1 , Current State: primary, Weight: 255

        Time            From           To             Reason
        Feb 24 23:16:12 hold           secondary      Hold timer expired
        Feb 24 23:16:12 secondary      primary        Remote yield (0/0)

    Redundancy Group 2 , Current State: primary, Weight: 255

        Time            From           To             Reason
        Feb 24 23:16:12 hold           secondary      Hold timer expired
        Feb 24 23:16:13 secondary      primary        Remote yield (0/0)

Chassis cluster LED information:
    Current LED color: Green
    Last LED change reason: No failures

node1:
--------------------------------------------------------------------------
Redundancy Group Information:

    Redundancy Group 0 , Current State: secondary, Weight: 255

        Time            From           To             Reason
        Feb 24 22:56:34 hold           secondary      Hold timer expired

    Redundancy Group 1 , Current State: secondary, Weight: 255

        Time            From           To             Reason
        Feb 24 23:16:10 hold           secondary      Hold timer expired

    Redundancy Group 2 , Current State: secondary, Weight: 255

        Time            From           To             Reason
        Feb 24 23:16:10 hold           secondary      Hold timer expired

Chassis cluster LED information:
    Current LED color: Green
    Last LED change reason: No failures
Meaning
The sample output confirms that node 0 and node 1 are healthy, and the green LED on the device indicates that there are no failures. Also, the default weight of the redundancy group (255) is displayed. The default weight is deducted whenever an interface mapped to the corresponding redundancy group goes down.
Refer to the following verification sections to observe how the redundancy group value changes when a monitored interface goes down or comes back up.
Verifyi Interface ge-0/0/1 Status After Disabling Interface ge-0/0/1 of RG1 in Node 0 with a Weight of 130
Purpose
Verify that the interface ge-0/0/1 is disabled on node 0.
Action
From configuration mode, enter the set interface ge-0/0/1
disable command.
{primary:node0}
user@host# set interface ge-0/0/1 disable
user@host# commit

node0:
configuration check succeeds
node1:
commit complete
node0:
commit complete

{primary:node0}
user@host# show interfaces ge-0/0/1
disable;
gigether-options {
    redundant-parent reth0;
}
Meaning
The sample output confirms that interface ge-0/0/1 is disabled.
Verify Chassis Cluster Status After Disabling Interface ge-0/0/1 of RG1 in Node 0 with a Weight of 130
Purpose
Verify the chassis cluster status, failover status, and redundancy group information.
Action
From operational mode, enter the show chassis cluster status
command.
{primary:node0}
user@host> show chassis cluster status
Monitor Failure codes:
    CS  Cold Sync monitoring        FL  Fabric Connection monitoring
    GR  GRES monitoring             HW  Hardware monitoring
    IF  Interface monitoring        IP  IP monitoring
    LB  Loopback monitoring         MB  Mbuf monitoring
    NH  Nexthop monitoring          NP  NPC monitoring
    SP  SPU monitoring              SM  Schedule monitoring
    CF  Config Sync monitoring

Cluster ID: 2
Node   Priority Status         Preempt Manual   Monitor-failures

Redundancy group: 0 , Failover count: 1
node0  254      primary        no      no       None
node1  1        secondary      no      no       None

Redundancy group: 1 , Failover count: 1
node0  200      primary        no      no       None
node1  100      secondary      no      no       None

Redundancy group: 2 , Failover count: 1
node0  200      primary        no      no       None
node1  100      secondary      no      no       None
Meaning
Use the show chassis cluster status command to confirm that
devices in the chassis cluster are communicating properly, with one device
functioning as the primary node and the other as the secondary node.
Verify Chassis Cluster Interfaces After Disabling Interface ge-0/0/1 of RG1 in Node 0 with a Weight of 130
Purpose
Verify information about the statistics of the different objects being synchronized, the fabric and control interface hellos, and the status of the monitoring interfaces in the cluster.
Action
From operational mode, enter the show chassis cluster
interfaces command.
{primary:node0}
user@host> show chassis cluster interfaces
Control link status: Up

Control interfaces:
    Index   Interface   Monitored-Status   Internal-SA
    0       em0         Up                 Disabled
    1       em1         Down               Disabled

Fabric link status: Up

Fabric interfaces:
    Name    Child-interface    Status
                               (Physical/Monitored)
    fab0    ge-0/0/0           Up   / Up
    fab0
    fab1    ge-8/0/0           Up   / Up
    fab1

Redundant-ethernet Information:
    Name         Status      Redundancy-group
    reth0        Down        1
    reth1        Up          1
    reth2        Up          2

Redundant-pseudo-interface Information:
    Name         Status      Redundancy-group
    lo0          Up          0

Interface Monitoring:
    Interface         Weight    Status    Redundancy-group
    ge-8/0/2          120       Up        1
    ge-8/0/1          150       Up        1
    ge-0/0/2          140       Up        1
    ge-0/0/1          130       Down      1
    ge-8/0/3          255       Up        2
    ge-0/0/3          255       Up        2
Meaning
The sample output confirms that monitoring interface ge-0/0/1 is down.
Verify Chassis Cluster Information After Disabling Interface ge-0/0/1 of RG1 in Node 0 with a Weight of 130
Purpose
Verify information about the statistics of the different objects being synchronized, the fabric and control interface hellos, and the status of the monitoring interfaces in the cluster.
Action
From operational mode, enter the show chassis cluster
information command.
{primary:node0}
user@host> show chassis cluster information

node0:
--------------------------------------------------------------------------
Redundancy Group Information:

    Redundancy Group 0 , Current State: primary, Weight: 255

        Time            From           To             Reason
        Feb 24 22:56:27 hold           secondary      Hold timer expired
        Feb 24 22:56:34 secondary      primary        Better priority (254/1)

    Redundancy Group 1 , Current State: primary, Weight: 125

        Time            From           To             Reason
        Feb 24 23:16:12 hold           secondary      Hold timer expired
        Feb 24 23:16:12 secondary      primary        Remote yield (0/0)

    Redundancy Group 2 , Current State: primary, Weight: 255

        Time            From           To             Reason
        Feb 24 23:16:12 hold           secondary      Hold timer expired
        Feb 24 23:16:13 secondary      primary        Remote yield (0/0)

Chassis cluster LED information:
    Current LED color: Green
    Last LED change reason: No failures

Failure Information:

    Interface Monitoring Failure Information:
        Redundancy Group 1, Monitoring status: Unhealthy
          Interface                 Status
          ge-0/0/1                  Down

node1:
--------------------------------------------------------------------------
Redundancy Group Information:

    Redundancy Group 0 , Current State: secondary, Weight: 255

        Time            From           To             Reason
        Feb 24 22:56:34 hold           secondary      Hold timer expired

    Redundancy Group 1 , Current State: secondary, Weight: 255

        Time            From           To             Reason
        Feb 24 23:16:10 hold           secondary      Hold timer expired

    Redundancy Group 2 , Current State: secondary, Weight: 255

        Time            From           To             Reason
        Feb 24 23:16:10 hold           secondary      Hold timer expired

Chassis cluster LED information:
    Current LED color: Amber
    Last LED change reason: Monitored objects are down
Meaning
The sample output confirms that in node 0, the RG1 weight is reduced to 125 (that is, 255 minus 130) because monitoring interface ge-0/0/1 (weight of 130) went down. The monitoring status is unhealthy, the device LED is amber, and the interface status of ge-0/0/1 is down.
If interface ge-0/0/1 is brought back up, the weight of RG1 in node 0 becomes 255. Conversely, if interface ge-0/0/2 is also disabled, the weight of RG1 in node 0 becomes 0 or less (in this example, 125 minus 140 = -15) and triggers failover, as indicated in the next verification section.
Verify Interface ge-0/0/2 Is Disabled
Purpose
Verify that interface ge-0/0/2 is disabled on node 0.
Action
From configuration mode, enter the set interface ge-0/0/2
disable command.
{primary:node0}
user@host# set interface ge-0/0/2 disable
user@host# commit

node0:
configuration check succeeds
node1:
commit complete
node0:
commit complete

{primary:node0}
user@host# show interfaces ge-0/0/2
disable;
gigether-options {
    redundant-parent reth1;
}
Meaning
The sample output confirms that interface ge-0/0/2 is disabled.
Verify Chassis Cluster Status After Disabling Interface ge-0/0/2
Purpose
Verify the chassis cluster status, failover status, and redundancy group information.
Action
From operational mode, enter the show chassis cluster status
command.
{primary:node0}
user@host> show chassis cluster status
Monitor Failure codes:
    CS  Cold Sync monitoring        FL  Fabric Connection monitoring
    GR  GRES monitoring             HW  Hardware monitoring
    IF  Interface monitoring        IP  IP monitoring
    LB  Loopback monitoring         MB  Mbuf monitoring
    NH  Nexthop monitoring          NP  NPC monitoring
    SP  SPU monitoring              SM  Schedule monitoring
    CF  Config Sync monitoring

Cluster ID: 2
Node   Priority Status         Preempt Manual   Monitor-failures

Redundancy group: 0 , Failover count: 1
node0  254      primary        no      no       None
node1  1        secondary      no      no       None

Redundancy group: 1 , Failover count: 2
node0  0        secondary      no      no       IF
node1  100      primary        no      no       None

Redundancy group: 2 , Failover count: 1
node0  200      primary        no      no       None
node1  100      secondary      no      no       None
Meaning
Use the show chassis cluster status command to confirm that
devices in the chassis cluster are communicating properly, with one device
functioning as the primary node and the other as the secondary node. On RG1,
you see interface failure, because both interfaces mapped to RG1 on node 0
failed during interface monitoring.
Verify Chassis Cluster Interfaces After Disabling Interface ge-0/0/2
Purpose
Verify information about chassis cluster interfaces.
Action
From operational mode, enter the show chassis cluster
interfaces command.
{primary:node0}
user@host> show chassis cluster interfaces
Control link status: Up

Control interfaces:
    Index   Interface   Monitored-Status   Internal-SA
    0       em0         Up                 Disabled
    1       em1         Down               Disabled

Fabric link status: Up

Fabric interfaces:
    Name    Child-interface    Status
                               (Physical/Monitored)
    fab0    ge-0/0/0           Up   / Up
    fab0
    fab1    ge-8/0/0           Up   / Up
    fab1

Redundant-ethernet Information:
    Name         Status      Redundancy-group
    reth0        Up          1
    reth1        Up          1
    reth2        Up          2

Redundant-pseudo-interface Information:
    Name         Status      Redundancy-group
    lo0          Up          0

Interface Monitoring:
    Interface         Weight    Status    Redundancy-group
    ge-8/0/2          120       Up        1
    ge-8/0/1          150       Up        1
    ge-0/0/2          140       Down      1
    ge-0/0/1          130       Down      1
    ge-8/0/3          255       Up        2
    ge-0/0/3          255       Up        2
Meaning
The sample output confirms that monitoring interfaces ge-0/0/1 and ge-0/0/2 are down.
Verify Chassis Cluster Information After Disabling Interface ge-0/0/2
Purpose
Verify information about the statistics of the different objects being synchronized, the fabric and control interface hellos, and the status of the monitoring interfaces in the cluster.
Action
From operational mode, enter the show chassis cluster
information command.
{primary:node0}
user@host> show chassis cluster information

node0:
--------------------------------------------------------------------------
Redundancy Group Information:

    Redundancy Group 0 , Current State: primary, Weight: 255

        Time            From           To             Reason
        Feb 24 22:56:27 hold           secondary      Hold timer expired
        Feb 24 22:56:34 secondary      primary        Better priority (254/1)

    Redundancy Group 1 , Current State: secondary, Weight: -15

        Time            From           To             Reason
        Feb 24 23:16:12 hold           secondary      Hold timer expired
        Feb 24 23:16:12 secondary      primary        Remote yield (0/0)
        Feb 24 23:31:36 primary        secondary-hold Monitor failed: IF
        Feb 24 23:31:37 secondary-hold secondary      Ready to become secondary

    Redundancy Group 2 , Current State: primary, Weight: 255

        Time            From           To             Reason
        Feb 24 23:16:12 hold           secondary      Hold timer expired
        Feb 24 23:16:13 secondary      primary        Remote yield (0/0)

Chassis cluster LED information:
    Current LED color: Amber
    Last LED change reason: Monitored objects are down

Failure Information:

    Interface Monitoring Failure Information:
        Redundancy Group 1, Monitoring status: Failed
          Interface                 Status
          ge-0/0/2                  Down
          ge-0/0/1                  Down

node1:
--------------------------------------------------------------------------
Redundancy Group Information:

    Redundancy Group 0 , Current State: secondary, Weight: 255

        Time            From           To             Reason
        Feb 24 22:56:34 hold           secondary      Hold timer expired

    Redundancy Group 1 , Current State: primary, Weight: 255

        Time            From           To             Reason
        Feb 24 23:16:10 hold           secondary      Hold timer expired
        Feb 24 23:31:36 secondary      primary        Remote is in secondary hold

    Redundancy Group 2 , Current State: secondary, Weight: 255

        Time            From           To             Reason
        Feb 24 23:16:10 hold           secondary      Hold timer expired

Chassis cluster LED information:
    Current LED color: Amber
    Last LED change reason: Monitored objects are down
Meaning
The sample output confirms that in node 0, monitoring interfaces ge-0/0/1 and
ge-0/0/2 are down. The weight of RG1 on node 0 reached zero value, which
triggered RG1 failover during use of the show chassis cluster
status command.
For RG2, the default weight of 255 is set for redundant Ethernet interface 2 (reth2). When interface monitoring is required, we recommend that you use the default weight when you do not have backup links like those in RG1. That is, if interface ge-0/0/3 is disabled, it immediately triggers failover because the weight becomes 0 (255 minus 225), as indicated in the next verification section.
Verify Interface Status After Disabling ge-0/0/3
Purpose
Verify that interface ge-0/0/3 is disabled on node 0.
Action
From configuration mode, enter the set interface ge-0/0/3
disable command.
{primary:node0}
user@host# set interface ge-0/0/3 disable
user@host# commit

node0:
configuration check succeeds
node1:
commit complete
node0:
commit complete

{primary:node0}
user@host# show interfaces ge-0/0/3
disable;
gigether-options {
    redundant-parent reth2;
}
Meaning
The sample output confirms that interface ge-0/0/3 is disabled.
Verify Chassis Cluster Status After Disabling Interface ge-0/0/3
Purpose
Verify the chassis cluster status, failover status, and redundancy group information.
Action
From operational mode, enter the show chassis cluster status
command.
{primary:node0}
user@host> show chassis cluster status
Monitor Failure codes:
    CS  Cold Sync monitoring        FL  Fabric Connection monitoring
    GR  GRES monitoring             HW  Hardware monitoring
    IF  Interface monitoring        IP  IP monitoring
    LB  Loopback monitoring         MB  Mbuf monitoring
    NH  Nexthop monitoring          NP  NPC monitoring
    SP  SPU monitoring              SM  Schedule monitoring
    CF  Config Sync monitoring

Cluster ID: 2
Node   Priority Status         Preempt Manual   Monitor-failures

Redundancy group: 0 , Failover count: 1
node0  254      primary        no      no       None
node1  1        secondary      no      no       None

Redundancy group: 1 , Failover count: 2
node0  0        secondary      no      no       IF
node1  100      primary        no      no       None

Redundancy group: 2 , Failover count: 2
node0  0        secondary      no      no       IF
node1  100      primary        no      no       None
Meaning
Use the show chassis cluster status command to confirm that
devices in the chassis cluster are communicating properly, with one device
functioning as the primary node and the other as the secondary node.
Verify Chassis Cluster Interfaces After Disabling Interface ge-0/0/3
Purpose
Verify information about chassis cluster interfaces.
Action
From operational mode, enter the show chassis cluster
interfaces command.
{primary:node0}
user@host> show chassis cluster interfaces
Control link status: Up

Control interfaces:
    Index   Interface   Monitored-Status   Internal-SA
    0       em0         Up                 Disabled
    1       em1         Down               Disabled

Fabric link status: Up

Fabric interfaces:
    Name    Child-interface    Status
                               (Physical/Monitored)
    fab0    ge-0/0/0           Up   / Up
    fab0
    fab1    ge-8/0/0           Up   / Up
    fab1

Redundant-ethernet Information:
    Name         Status      Redundancy-group
    reth0        Up          1
    reth1        Up          1
    reth2        Up          2

Redundant-pseudo-interface Information:
    Name         Status      Redundancy-group
    lo0          Up          0

Interface Monitoring:
    Interface         Weight    Status    Redundancy-group
    ge-8/0/2          120       Up        1
    ge-8/0/1          150       Up        1
    ge-0/0/2          140       Down      1
    ge-0/0/1          130       Down      1
    ge-8/0/3          255       Up        2
    ge-0/0/3          255       Down      2
Meaning
The sample output confirms that monitoring interfaces ge-0/0/1, ge-0/0/2, and ge-0/0/3 are down.
Verify Chassis Cluster Information After Disabling Interface ge-0/0/3
Purpose
Verify information about the statistics of the different objects being synchronized, the fabric and control interface hellos, and the status of the monitoring interfaces in the cluster.
Action
From operational mode, enter the show chassis cluster
information command.
{primary:node0}
user@host> show chassis cluster information

node0:
--------------------------------------------------------------------------
Redundancy Group Information:

    Redundancy Group 0 , Current State: primary, Weight: 255

        Time            From           To             Reason
        Feb 24 22:56:27 hold           secondary      Hold timer expired
        Feb 24 22:56:34 secondary      primary        Better priority (254/1)

    Redundancy Group 1 , Current State: secondary, Weight: -15

        Time            From           To             Reason
        Feb 24 23:16:12 hold           secondary      Hold timer expired
        Feb 24 23:16:12 secondary      primary        Remote yield (0/0)
        Feb 24 23:31:36 primary        secondary-hold Monitor failed: IF
        Feb 24 23:31:37 secondary-hold secondary      Ready to become secondary

    Redundancy Group 2 , Current State: secondary, Weight: 0

        Time            From           To             Reason
        Feb 24 23:16:12 hold           secondary      Hold timer expired
        Feb 24 23:16:13 secondary      primary        Remote yield (0/0)
        Feb 24 23:35:57 primary        secondary-hold Monitor failed: IF
        Feb 24 23:35:58 secondary-hold secondary      Ready to become secondary

Chassis cluster LED information:
    Current LED color: Amber
    Last LED change reason: Monitored objects are down

Failure Information:

    Interface Monitoring Failure Information:
        Redundancy Group 1, Monitoring status: Failed
          Interface                 Status
          ge-0/0/2                  Down
          ge-0/0/1                  Down
        Redundancy Group 2, Monitoring status: Failed
          Interface                 Status
          ge-0/0/3                  Down

node1:
--------------------------------------------------------------------------
Redundancy Group Information:

    Redundancy Group 0 , Current State: secondary, Weight: 255

        Time            From           To             Reason
        Feb 24 22:56:34 hold           secondary      Hold timer expired

    Redundancy Group 1 , Current State: primary, Weight: 255

        Time            From           To             Reason
        Feb 24 23:16:10 hold           secondary      Hold timer expired
        Feb 24 23:31:36 secondary      primary        Remote is in secondary hold

    Redundancy Group 2 , Current State: primary, Weight: 255

        Time            From           To             Reason
        Feb 24 23:16:10 hold           secondary      Hold timer expired
        Feb 24 23:35:57 secondary      primary        Remote is in secondary hold

Chassis cluster LED information:
    Current LED color: Amber
    Last LED change reason: Monitored objects are down
Meaning
The sample output confirms that in node 0, monitoring interfaces ge-0/0/1, ge-0/0/2, and ge-0/0/3 are down.
In regard to RG1, allowing any interface in node 0 go up triggers a failover
only if the preempt option is enabled. In the example,
preempt is not enabled. Therefore the node should
return to normal, with no monitor failure showing for RG1.
Verify Interface ge-0/0/2 Is Enabled
Purpose
Verify that interface ge-0/0/2 is enabled on node 0.
Action
From configuration mode, enter the delete interfaces ge-0/0/2
disable command.
{primary:node0}
user@host# delete interfaces ge-0/0/2 disable
user@host# commit

node0:
configuration check succeeds
node1:
commit complete
node0:
commit complete
Meaning
The sample output confirms that interface ge-0/0/2 disable is deleted.
Verify Chassis Cluster Status After Enabling Interface ge-0/0/2
Purpose
Verify the chassis cluster status, failover status, and redundancy group information.
Action
From operational mode, enter the show chassis cluster status
command.
{primary:node0}
user@host> show chassis cluster status
Monitor Failure codes:
    CS  Cold Sync monitoring        FL  Fabric Connection monitoring
    GR  GRES monitoring             HW  Hardware monitoring
    IF  Interface monitoring        IP  IP monitoring
    LB  Loopback monitoring         MB  Mbuf monitoring
    NH  Nexthop monitoring          NP  NPC monitoring
    SP  SPU monitoring              SM  Schedule monitoring
    CF  Config Sync monitoring

Cluster ID: 2
Node   Priority Status         Preempt Manual   Monitor-failures

Redundancy group: 0 , Failover count: 1
node0  254      primary        no      no       None
node1  1        secondary      no      no       None

Redundancy group: 1 , Failover count: 2
node0  200      secondary      no      no       None
node1  100      primary        no      no       None

Redundancy group: 2 , Failover count: 2
node0  0        secondary      no      no       IF
node1  100      primary        no      no       None
Meaning
Use the show chassis cluster status command to confirm that
devices in the chassis cluster are communicating properly, with as one
device functioning as the primary node and the other as the secondary
node.
Verify Chassis Cluster Interfaces After Enabling Interface ge-0/0/2
Purpose
Verify information about chassis cluster interfaces.
Action
From operational mode, enter the show chassis cluster
interfaces command.
{primary:node0}
user@host> show chassis cluster interfaces
Control link status: Up

Control interfaces:
    Index   Interface   Monitored-Status   Internal-SA
    0       em0         Up                 Disabled
    1       em1         Down               Disabled

Fabric link status: Up

Fabric interfaces:
    Name    Child-interface    Status
                               (Physical/Monitored)
    fab0    ge-0/0/0           Up   / Up
    fab0
    fab1    ge-8/0/0           Up   / Up
    fab1

Redundant-ethernet Information:
    Name         Status      Redundancy-group
    reth0        Up          1
    reth1        Up          1
    reth2        Up          2

Redundant-pseudo-interface Information:
    Name         Status      Redundancy-group
    lo0          Up          0

Interface Monitoring:
    Interface         Weight    Status    Redundancy-group
    ge-8/0/2          120       Up        1
    ge-8/0/1          150       Up        1
    ge-0/0/2          140       Up        1
    ge-0/0/1          130       Down      1
    ge-8/0/3          255       Up        2
    ge-0/0/3          255       Down      2
Meaning
The sample output confirms that monitoring interfaces ge-0/0/1 and ge-0/0/3 are down. Monitoring interface ge-0/0/2 is up after the disable has been deleted.
Verify Chassis Cluster Information After Enabling Interface ge-0/0/2
Purpose
Verify information about the statistics of the different objects being synchronized, the fabric and control interface hellos, and the status of the monitoring interfaces in the cluster.
Action
From operational mode, enter the show chassis cluster
information command.
{primary:node0}
user@host> show chassis cluster information

node0:
--------------------------------------------------------------------------
Redundancy Group Information:

    Redundancy Group 0 , Current State: primary, Weight: 255

        Time            From           To             Reason
        Feb 24 22:56:27 hold           secondary      Hold timer expired
        Feb 24 22:56:34 secondary      primary        Better priority (254/1)

    Redundancy Group 1 , Current State: secondary, Weight: 125

        Time            From           To             Reason
        Feb 24 23:16:12 hold           secondary      Hold timer expired
        Feb 24 23:16:12 secondary      primary        Remote yield (0/0)
        Feb 24 23:31:36 primary        secondary-hold Monitor failed: IF
        Feb 24 23:31:37 secondary-hold secondary      Ready to become secondary

    Redundancy Group 2 , Current State: secondary, Weight: 0

        Time            From           To             Reason
        Feb 24 23:16:12 hold           secondary      Hold timer expired
        Feb 24 23:16:13 secondary      primary        Remote yield (0/0)
        Feb 24 23:35:57 primary        secondary-hold Monitor failed: IF
        Feb 24 23:35:58 secondary-hold secondary      Ready to become secondary

Chassis cluster LED information:
    Current LED color: Amber
    Last LED change reason: Monitored objects are down

Failure Information:

    Interface Monitoring Failure Information:
        Redundancy Group 1, Monitoring status: Unhealthy
          Interface                 Status
          ge-0/0/1                  Down
        Redundancy Group 2, Monitoring status: Failed
          Interface                 Status
          ge-0/0/3                  Down

node1:
--------------------------------------------------------------------------
Redundancy Group Information:

    Redundancy Group 0 , Current State: secondary, Weight: 255

        Time            From           To             Reason
        Feb 24 22:56:34 hold           secondary      Hold timer expired

    Redundancy Group 1 , Current State: primary, Weight: 255

        Time            From           To             Reason
        Feb 24 23:16:10 hold           secondary      Hold timer expired
        Feb 24 23:31:36 secondary      primary        Remote is in secondary hold

    Redundancy Group 2 , Current State: primary, Weight: 255

        Time            From           To             Reason
        Feb 24 23:16:10 hold           secondary      Hold timer expired
        Feb 24 23:35:57 secondary      primary        Remote is in secondary hold

Chassis cluster LED information:
    Current LED color: Amber
    Last LED change reason: Monitored objects are down
Meaning
The sample output confirms that in node 0, monitoring interfaces ge-0/0/1 and ge-0/0/3 are down. Monitoring interface ge-0/0/2 is active after the disable has been deleted.
Verify Chassis Cluster RG2 Preempt
Purpose
Verify that the chassis cluster RG2 is preempted on node 0.
Action
From configuration mode, enter the set chassis cluster
redundancy-group 2 preempt command.
{primary:node0}
user@host# set chassis cluster redundancy-group 2 preempt
user@host# commit

node0:
configuration check succeeds
node1:
commit complete
node0:
commit complete
Meaning
The sample output confirms that chassis cluster RG2 preempted on node 0.
In the next section, you check that RG2 fails over back to node 0 when preempt is enabled when the disabled node 0 interface is brought online.
Verify Chassis Cluster Status After Preempting RG2
Purpose
Verify the chassis cluster status, failover status, and redundancy group information.
Action
From operational mode, enter the show chassis cluster status
command.
{primary:node0}
user@host> show chassis cluster status
Monitor Failure codes:
    CS  Cold Sync monitoring        FL  Fabric Connection monitoring
    GR  GRES monitoring             HW  Hardware monitoring
    IF  Interface monitoring        IP  IP monitoring
    LB  Loopback monitoring         MB  Mbuf monitoring
    NH  Nexthop monitoring          NP  NPC monitoring
    SP  SPU monitoring              SM  Schedule monitoring
    CF  Config Sync monitoring

Cluster ID: 2
Node   Priority Status         Preempt Manual   Monitor-failures

Redundancy group: 0 , Failover count: 1
node0  254      primary        no      no       None
node1  1        secondary      no      no       None

Redundancy group: 1 , Failover count: 2
node0  200      secondary      no      no       None
node1  100      primary        no      no       None

Redundancy group: 2 , Failover count: 2
node0  0        secondary      yes     no       IF
node1  100      primary        yes     no       None
Meaning
Use the show chassis cluster status command to confirm that
devices in the chassis cluster are communicating properly, with one device
functioning as the primary node and the other as the secondary node.
Verify Interface ge-0/0/3 Is Enabled
Purpose
Verify that interface ge-0/0/3 is enabled on node 0.
Action
From configuration mode, enter the delete interfaces ge-0/0/3
disable command.
{primary:node0}
user@host# delete interfaces ge-0/0/3 disable
user@host# commit

node0:
configuration check succeeds
node1:
commit complete
node0:
commit complete
Meaning
The sample output confirms that interface ge-0/0/3 disable has been deleted.
Verify Chassis Cluster Status After Enabling Interface ge-0/0/3
Purpose
Verify the chassis cluster status, failover status, and redundancy group information.
Action
From operational mode, enter the show chassis cluster status
command.
{primary:node0}
user@host> show chassis cluster status
Monitor Failure codes:
    CS  Cold Sync monitoring        FL  Fabric Connection monitoring
    GR  GRES monitoring             HW  Hardware monitoring
    IF  Interface monitoring        IP  IP monitoring
    LB  Loopback monitoring         MB  Mbuf monitoring
    NH  Nexthop monitoring          NP  NPC monitoring
    SP  SPU monitoring              SM  Schedule monitoring
    CF  Config Sync monitoring

Cluster ID: 2
Node   Priority Status         Preempt Manual   Monitor-failures

Redundancy group: 0 , Failover count: 1
node0  254      primary        no      no       None
node1  1        secondary      no      no       None

Redundancy group: 1 , Failover count: 2
node0  200      secondary      no      no       None
node1  100      primary        no      no       None

Redundancy group: 2 , Failover count: 3
node0  200      primary        yes     no       None
node1  100      secondary      yes     no       None
Meaning
Use the show chassis cluster status command to confirm that
devices in the chassis cluster are communicating properly, with one device
functioning as the primary node and the other as the secondary node.
Verify Chassis Cluster Interfaces After Enabling Interface ge-0/0/3
Purpose
Verify information about chassis cluster interfaces.
Action
From operational mode, enter the show chassis cluster
interfaces command.
{primary:node0}
user@host> show chassis cluster interfaces
Control link status: Up

Control interfaces:
    Index   Interface   Monitored-Status   Internal-SA
    0       em0         Up                 Disabled
    1       em1         Down               Disabled

Fabric link status: Up

Fabric interfaces:
    Name    Child-interface    Status
                               (Physical/Monitored)
    fab0    ge-0/0/0           Up   / Up
    fab0
    fab1    ge-8/0/0           Up   / Up
    fab1

Redundant-ethernet Information:
    Name         Status      Redundancy-group
    reth0        Up          1
    reth1        Up          1
    reth2        Up          2

Redundant-pseudo-interface Information:
    Name         Status      Redundancy-group
    lo0          Up          0

Interface Monitoring:
    Interface         Weight    Status    Redundancy-group
    ge-8/0/2          120       Up        1
    ge-8/0/1          150       Up        1
    ge-0/0/2          140       Up        1
    ge-0/0/1          130       Down      1
    ge-8/0/3          255       Up        2
    ge-0/0/3          255       Up        2
Meaning
The sample output confirms that monitoring interface ge-0/0/1 is down. Monitoring interfaces ge-0/0/2, and ge-0/0/3 are up after deleting the disable.
Verify Chassis Cluster Information After Enabling Interface ge-0/0/3
Purpose
Verify information about the statistics of the different objects being synchronized, the fabric and control interface hellos, and the status of the monitoring interfaces in the cluster.
Action
From operational mode, enter the show chassis cluster
information command.
{primary:node0}
user@host> show chassis cluster information

node0:
--------------------------------------------------------------------------
Redundancy Group Information:

    Redundancy Group 0 , Current State: primary, Weight: 255

        Time            From           To             Reason
        Feb 24 22:56:27 hold           secondary      Hold timer expired
        Feb 24 22:56:34 secondary      primary        Better priority (254/1)

    Redundancy Group 1 , Current State: secondary, Weight: 125

        Time            From           To             Reason
        Feb 24 23:16:12 hold           secondary      Hold timer expired
        Feb 24 23:16:12 secondary      primary        Remote yield (0/0)
        Feb 24 23:31:36 primary        secondary-hold Monitor failed: IF
        Feb 24 23:31:37 secondary-hold secondary      Ready to become secondary

    Redundancy Group 2 , Current State: primary, Weight: 255

        Time            From           To             Reason
        Feb 24 23:16:12 hold           secondary      Hold timer expired
        Feb 24 23:16:13 secondary      primary        Remote yield (0/0)
        Feb 24 23:35:57 primary        secondary-hold Monitor failed: IF
        Feb 24 23:35:58 secondary-hold secondary      Ready to become secondary
        Feb 24 23:45:45 secondary      primary        Remote is in secondary hold

Chassis cluster LED information:
    Current LED color: Green
    Last LED change reason: No failures

Failure Information:

    Interface Monitoring Failure Information:
        Redundancy Group 1, Monitoring status: Unhealthy
          Interface                 Status
          ge-0/0/1                  Down

node1:
--------------------------------------------------------------------------
Redundancy Group Information:

    Redundancy Group 0 , Current State: secondary, Weight: 255

        Time            From           To             Reason
        Feb 24 22:56:34 hold           secondary      Hold timer expired

    Redundancy Group 1 , Current State: primary, Weight: 255

        Time            From           To             Reason
        Feb 24 23:16:10 hold           secondary      Hold timer expired
        Feb 24 23:31:36 secondary      primary        Remote is in secondary hold

    Redundancy Group 2 , Current State: secondary, Weight: 255

        Time            From           To             Reason
        Feb 24 23:16:10 hold           secondary      Hold timer expired
        Feb 24 23:35:57 secondary      primary        Remote is in secondary hold
        Feb 24 23:45:45 primary        secondary-hold Preempt (100/200)
        Feb 24 23:45:46 secondary-hold secondary      Ready to become secondary

Chassis cluster LED information:
    Current LED color: Amber
    Last LED change reason: Monitored objects are down
Meaning
The sample output confirms that in node 0, monitoring interface ge-0/0/1 is down. RG2 on node 0 state is back to primary state (because of the preempt enable) with a healthy weight of 255 when interface ge-0/0/3 is back up.