Viewing the Junos Space Platform Dashboard
When you log in to Junos Space Network Management Platform, the home page is displayed. By default, the home page for Junos Space Platform is the Dashboard page. However, if you previously configured a different page as the home page, then the configured home page is displayed when you log in.
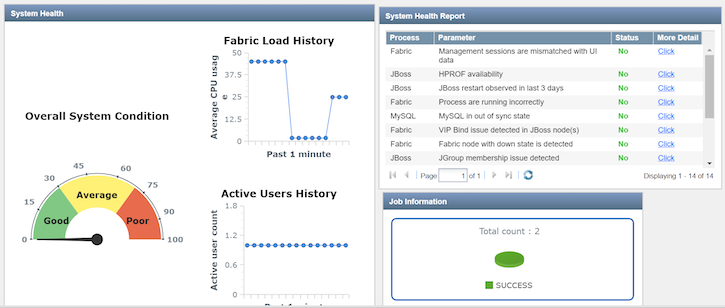
The Junos Space Platform dashboard, as shown in Figure 1, displays graphs that provide information about the overall system condition, the fabric load history, the active users history, and the percentage of jobs in different states. The charts are visible to all users and are updated in real time.
If you do not have user privileges to view detailed data, you might not be able to view detailed information if you select a gadget.
To access the Junos Space Dashboard page: