Help us improve your experience.

Let us know what you think.

Do you have time for a two-minute survey?


Viewing the Junos Space Platform Dashboard

When you log in to Junos Space Network Management Platform, the home page is displayed. By default, the home page for Junos Space Platform is the Dashboard page. However, if you previously configured a different page as the home page, then the configured home page is displayed when you log in.

The Junos Space Platform dashboard, as shown in Figure 1, displays graphs that provide information about the overall system condition, the fabric load history, the active users history, and the percentage of jobs in different states. The charts are visible to all users and are updated in real time.

Note:

If you do not have user privileges to view detailed data, you might not be able to view detailed information if you select a gadget.
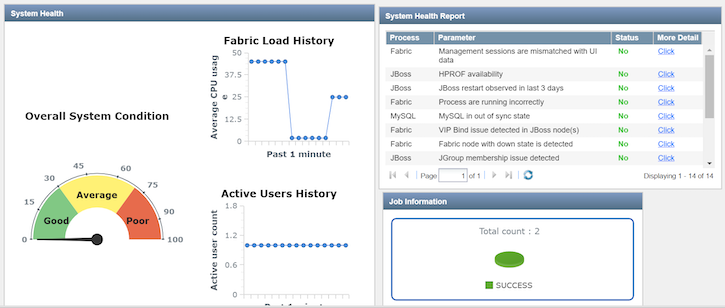
Figure 1: Junos Space Platform Dashboard PageJunos Space Platform Dashboard Page

To access the Junos Space Dashboard page:

  1. On the Junos Space Platform UI, select Dashboard.

    The Dashboard page is displayed.

  2. (Optional) To view more information related to the overall system condition, click Overall System Condition or the indicator needle.

    You are taken to the Fabric page, where you can view detailed information about the nodes in the fabric. For more information, see Viewing Nodes in the Fabric.

  3. (Optional) To view information related to the fabric load, on the Fabric Load History graph:
    • Mouse over a graph data point to view the average CPU usage percentage.

    • Click the blue line depicting the CPU usage to view detailed information.

      You are taken to the Fabric page, where you can view detailed information about the CPU, memory, and disk usage for the nodes in the fabric.

  4. (Optional) To view information related to the active users, on the Active Users History graph:
    • Mouse over a graph data point to view the total number of active users at that point.

    • Click a data point on the graph to view more information about the active users at that point.

      You are taken to the User Accounts page, where the active users are displayed. For more information, see Viewing User Statistics.

  5. (Optional) To view information related to the jobs, on the Job Information graph:
    • Mouse over a segment in the pie chart to view the percentage of jobs with a particular status; for example, cancelled jobs, successful jobs, or failed jobs.

    • Click a segment of the pie chart to view details of jobs with status corresponding to the segment.

      You are taken to the Job Management page, where the jobs filtered by the status are displayed. For more information, see Viewing Jobs.

  6. (Optional) You can view records about the health and performance of the Junos Space nodes in your Junos Space setup and the processes on these nodes in a system health report. The health and performance data collected from the nodes is displayed in the System Health Report table. For more information, see Viewing the Administration Statistics.
  7. (Optional) You can move any chart displayed on the Dashboard page by clicking inside the title bar and dragging the chart.
  8. (Optional) You can resize any chart displayed on the Dashboard page by hovering over an edge and clicking and dragging the edge.