Overall System Condition and Fabric Load History Overview
You can view the overall Junos Space system condition and fabric load from the Junos Space Network Management Platform Dashboard or the Administration statistics page.
Overall System Condition
To calculate the overall Junos Space system condition, Junos Space Platform uses a formula based on cluster health and node-function health:
-
Cluster health indicates the percentage of nodes in the fabric that are currently running.
For example, if only three nodes are reachable in a four-node fabric, cluster health is 75%.
-
Load-balancer health indicates the percentage of nodes (enabled for load balancing) that are running the load-balancing process.
For example, if two nodes are enabled for load balancing and the load-balancing process is running on only one node, the load-balancing health is 50%.
-
Database health indicates the percentage of nodes (enabled for database requests) that are running the database process.
For example, if two nodes are enabled as the database server and the database process is running on only one node, then database health is 50%.
-
Application-logic health indicates the percentage of nodes (enabled for application logic (DML and business logic) that are running the application-logic process.
For example, if three nodes are enabled for application logic and the application-logic process is running on only two nodes, then application-logic health is 67%.
Junos Space Platform retrieves data on the nodes and the node functions that are running, and then applies the following formula to determine the overall Junos Space system condition: Overall System Condition = [(Number of Nodes Running) / (Number of Nodes in Fabric)] * [(Number of Nodes Running Load_Balancing Process) / (Number of Nodes enabled for Load Balancing)] * [(Number of Nodes Running Database-Server Process) / (Number of Nodes Enabled As Database Server)] * [(Number of Nodes Running Application-Logic Process) / (Number of Nodes Enabled for Application Logic)]
The overall Junos Space system condition is expressed as a percentage. If we use the values in the preceding examples in this formula, then the overall system condition would be calculated as: Overall System Condition = 75% * 50%* 50% * 67% = 12.5%.
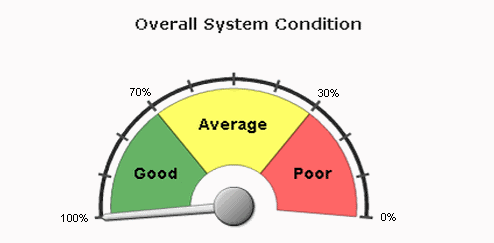
A value between 0 and 30% indicates that the system health is Poor, a value between 30% and 70% indicates that the system health is average, and a value between 70% and 100% indicates that the system health is good. The Overall System Condition chart displays the system health as shown in Figure 1

The overall system health indicates 0% (Poor) when any one of the following conditions is detected:
-
No nodes in the fabric are running.
-
No nodes enabled for load balancing are running the load-balancing process.
-
No nodes enabled for database requests are running the database process.
-
No nodes enabled for application logic are running the application-logic process.
Fabric Load History
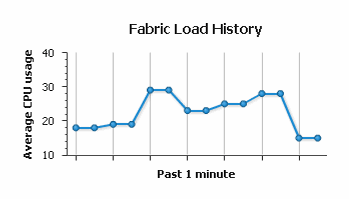
The Fabric Load History chart, as shown in Figure 2, displays the average CPU usage across all nodes that are running in the fabric.

Junos Space Platform uses the following formula to determine the fabric load: Fabric Load = (Total CPU Usage for All Nodes Running) / (Number of Nodes Running)
For example, for a fabric with three nodes running and CPU usage of 80%, 30%, and 10%, respectively, the fabric load is 40%.
Active Users History
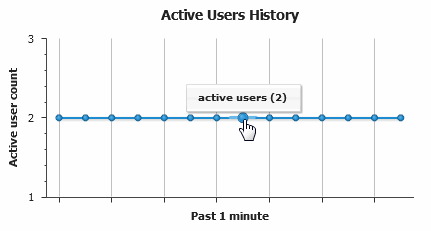
The Active Users History chart, as shown in Figure 3, displays the number of active users in the past one minute.

