ON THIS PAGE
Junos Space User Interface Overview
The Junos Space UI is designed to look and behave in a way that most users are familiar with. The left tree structure facilitates navigation and the right pane displays information about the workspace or task selected in the left pane. Multiple users can access the UI through Web browsers concurrently. All users have access to the same current information in the same system wide database. Access to tasks and objects is controlled by permissions assigned to each user.
The Junos Space UI is common to Junos Space Network Management Platform and Junos Space applications. The information displayed on the Junos Space UI changes according to the application you select. The examples shown here are from the Junos Space Platform UI. Other applications may have design variations.
When you log in to Junos Space Platform, the previously configured home page is displayed. The Junos Space Platform Dashboard, which is the default home page, is shown in Figure 1.
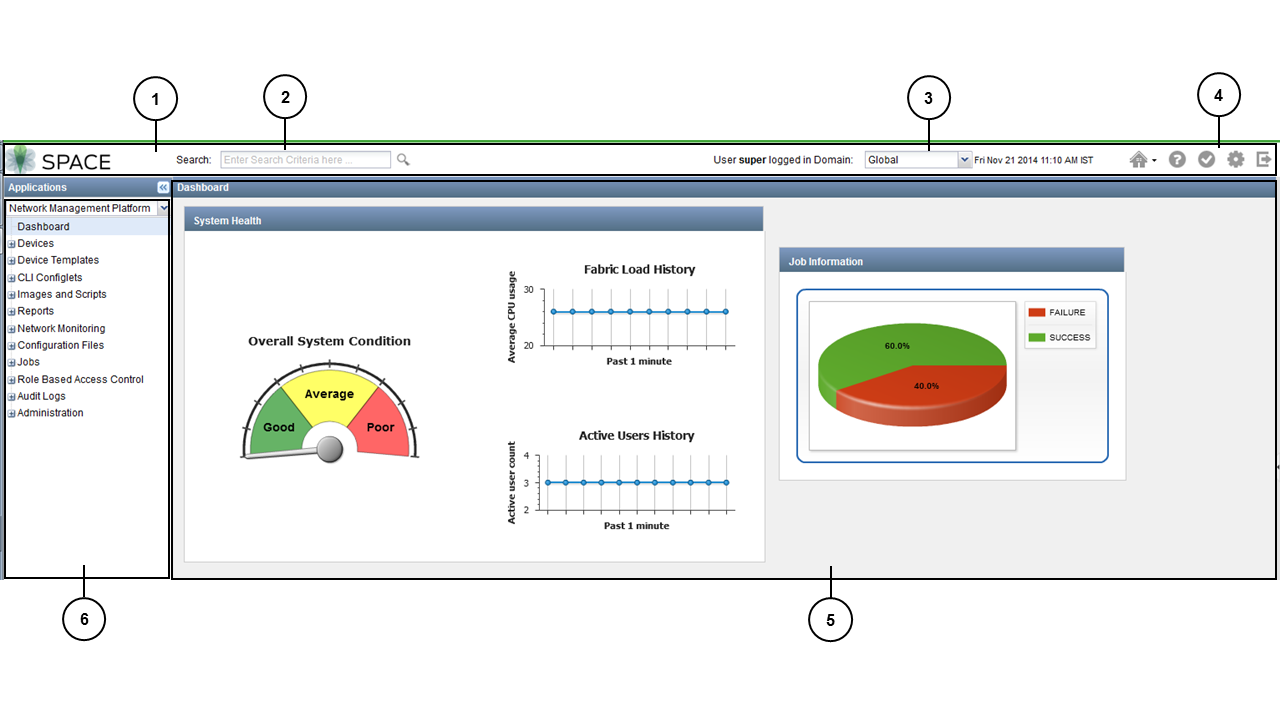
1 — Junos Space Banner | 4 — Global Action Icons |
2 — Global Search Text Box | 5 — Junos Space Dashboard |
3 — Domain Switcher | 6 — Task Tree |
This display contains three main parts: a task tree on the left, which is always available; a main window on the right, whose content changes as you select items from the task tree; and a banner across the top, which offers the date and time, the domain to which you are logged in, global search, and several icon buttons for frequently used actions. These parts are described in the following sections.
Junos Space Banner
The Junos Space banner, as indicated in Figure 1, displays the date and server time in the active time zone, the domain to which you are logged in, global search, and the global actions icons. This banner is always present. For more information about global search and domain features, see Using Global Search and the Domains Overview topic (in the Junos Space Network Management Platform Workspaces User Guide).
If you access the Junos Space Platform UI in two tabs of the same browser with two different domains selected and access the same page in both tabs, the information displayed on the page is based on the latest domain selected. To view pages that are accessible only in the Global domain, ensure that you are in the Global domain in the most recent tab in which you are accessing the UI.
Table 1 describes the global action icons on the right side of the banner.
Global Action Icon |
Description |
|---|---|
 |
Enables you to access the Junos Space home page or set the Junos Space home page. Refer to the Setting and Accessing the Junos Space Home Page for details. |
 |
Displays the application Help. To access workspace context-sensitive Help, click the Help icon after navigating to that workspace. See Accessing Help on Junos Space. |
 |
Displays the My Jobs dialog box from which you can view the progress and status of your current managed jobs. You can view all your completed, in-progress, canceled, and scheduled jobs in Junos Space Platform. See Viewing Your Jobs in the Junos Space Network Management Platform Workspaces User Guide. |
 |
Displays the Change User Settings dialog box from which you can change user preferences, such as the password. See Changing Your Password on Junos Space. |
 |
Logs you out of the system. See Logging Out of Junos Space. |
Task Tree
The task tree on the left side of the display is always present and facilitates navigation in the Junos Space Platform UI. As shown in Figure 1, when you first log in, the Application Selector list displays Network Management Platform by default. You can drop this list down to see all the Junos Space applications available on your system. (You can install other applications by using the Applications task group, as described in Managing Junos Space Applications Overview in the Junos Space Network Management Platform Workspaces User Guide.)
You can collapse the task tree to the left by clicking the double left arrow buttons in its header, and reexpand it by clicking the double right arrow buttons.
Below the application name is the word Dashboard, selected by default. It indicates that what you see in the right-hand window is the dashboard for the current application—in this case, Junos Space Platform. The dashboard shows several measures of overall system health.
Below the Dashboard item in the tree is a list of the workspaces available in the current application. This list forms the top level of the task tree. If you select a different application from the Applications list, you see the workspace list change. This topic describes the workspaces for Junos Space Platform; for the workspaces in other applications, see the documentation for those applications.
The workspaces in the Junos Space Platform are described at a high level in Table 2.
Workspace Name |
Function |
|---|---|
Devices |
Manage devices, including adding, discovering, importing, and updating them. See Device Management Overview (in the Junos Space Network Management Platform Workspaces User Guide). |
Device Templates |
Create configuration definitions and templates used to deploy configuration changes on multiple Juniper Networks devices. See Device Templates Overview (in the Junos Space Network Management Platform Workspaces User Guide). |
CLI Configlets |
Easily apply a configuration to a device. Configlets are configuration tools provided by Junos OS. See CLI Configlets Overview (in the Junos Space Network Management Platform Workspaces User Guide). |
Images and Scripts |
Deploy, verify, enable, disable, remove, and execute scripts deployed to devices. See Scripts Overview (in the Junos Space Network Management Platform Workspaces User Guide). Download a device image from the Juniper Networks Software download site to your local file system, upload it into Junos Space, and deploy it on one or more devices simultaneously. See Device Images Overview (in the Junos Space Network Management Platform Workspaces User Guide). |
Reports |
Generate customized reports for managing network resources. See Reports Overview (in the Junos Space Network Management Platform Workspaces User Guide). |
Network Monitoring |
Assess the performance of your network, not only at a point in time, but also over a period of time. See Network Monitoring Workspace Overview (in the Junos Space Network Management Platform Workspaces User Guide). |
Configuration Files |
See Managing Configuration Files Overview (in the Junos Space Network Management Platform Workspaces User Guide). |
Jobs |
Monitor the progress of ongoing jobs. See Jobs Overview (in the Junos Space Network Management Platform Workspaces User Guide). |
Role Based Access Control |
Add, manage, and delete users, custom roles, domains, and remote profiles. From this workspace, you can also manage user sessions. See Configuring Users to Manage Objects in Junos Space Overview (in the Junos Space Network Management Platform Workspaces User Guide). |
Audit Logs |
View and filter system audit logs, including those for user login and logout, tracking device-management tasks, and displaying services that were provisioned on devices. See Junos Space Audit Logs Overview (in the Junos Space Network Management Platform Workspaces User Guide). |
Administration |
Add network nodes, back up your database, manage licenses and applications, or troubleshoot. See Junos Space Administrators Overview, Maintenance Mode Overview, and other topics related to the Administration workspace in the (in the Junos Space Network Management Platform Workspaces User Guide). |
You can expand any of these workspaces by clicking the expansion symbol (+) to the left of its name. When you do so, the next level of the task tree for that workspace opens. Some items at this second level may also be expandable subgroups.
You can expand as many workspaces or task groups as you like; previously expanded ones remain open until you collapse them. The design of the task tree enables you to jump from area to area within an application with the minimum number of selections.
Main Window
When you log in to Junos Space Platform, the main window shows the application dashboard by default. If you have set another home page, the main window displays that page. See Setting and Accessing the Junos Space Home Page for more information.
When you select a workspace name (as opposed to expanding it), the main window changes and displays graphical statistics for that workspace. This display is called Workspace Statistics. It is similar in functionality to the overall system dashboard, but it pertains only to that workspace. See Workspace Statistics Page Overview for more information.
Selecting the name of a task group or task within the workspace causes the main window to display an inventory of the objects managed in tabular format. See Inventory Landing Page Overview for more information.