
Tests and Monitors Overview
Monitoring key performance indicators (KPIs) such as the response time, congestion, and reachability is important to gauge the quality of your network. To evaluate the KPIs, Active Assurance enables you to create and run Test and Monitors to measure common metrics such as delay, delay variance (jitter), packet loss, round-trip response time, and so on.
A Test is a set of verifications that is performed by one or more Test Agents for a finite amount of time. For more information on Tests, see Measuring Metrics Using Active Assurance Tests.
A Monitor is a set of verifications that is performed by one or more Test Agents for an infinite amount of time. For more information on Monitors, see Measuring Metrics Using Active Assurance Monitors.
Both Tests and Monitors entails Tasks. The Task contains the configuration to measure a specific metrics by using certain protocols. For information on the protocols that are supported in Routing Director, see Supported Protocols.
When you create and run a Test or Monitor, the Test Agent receives the measurement configuration that you have defined in the Test or Monitor. Based on the protocols that you have defined during the Task creation, the Test Agent downloads the required protocols from Routing Director, starts collecting the measurements, and shares the data in the form of streams that you can view in the Routing Director GUI. This information helps you to gain insights into your network's health, performance, and quality.
Measuring Metrics Using Active Assurance Tests
A Test is a set of verifications that are performed by one or more Test Agents for a finite amount of time. A Test contains one or more Steps and Tasks, which validates whether KPIs that are defined in the Tests can be considered as operational (pass) or not (fail).
A Test can consist of one or more Steps that are executed sequentially. Each Step can consist of one or more Tasks that run concurrently. A Task contain the configuration to measure specific metrics.
Figure 1 illustrates the relation between a Test, Steps, and Tasks in Routing Director.
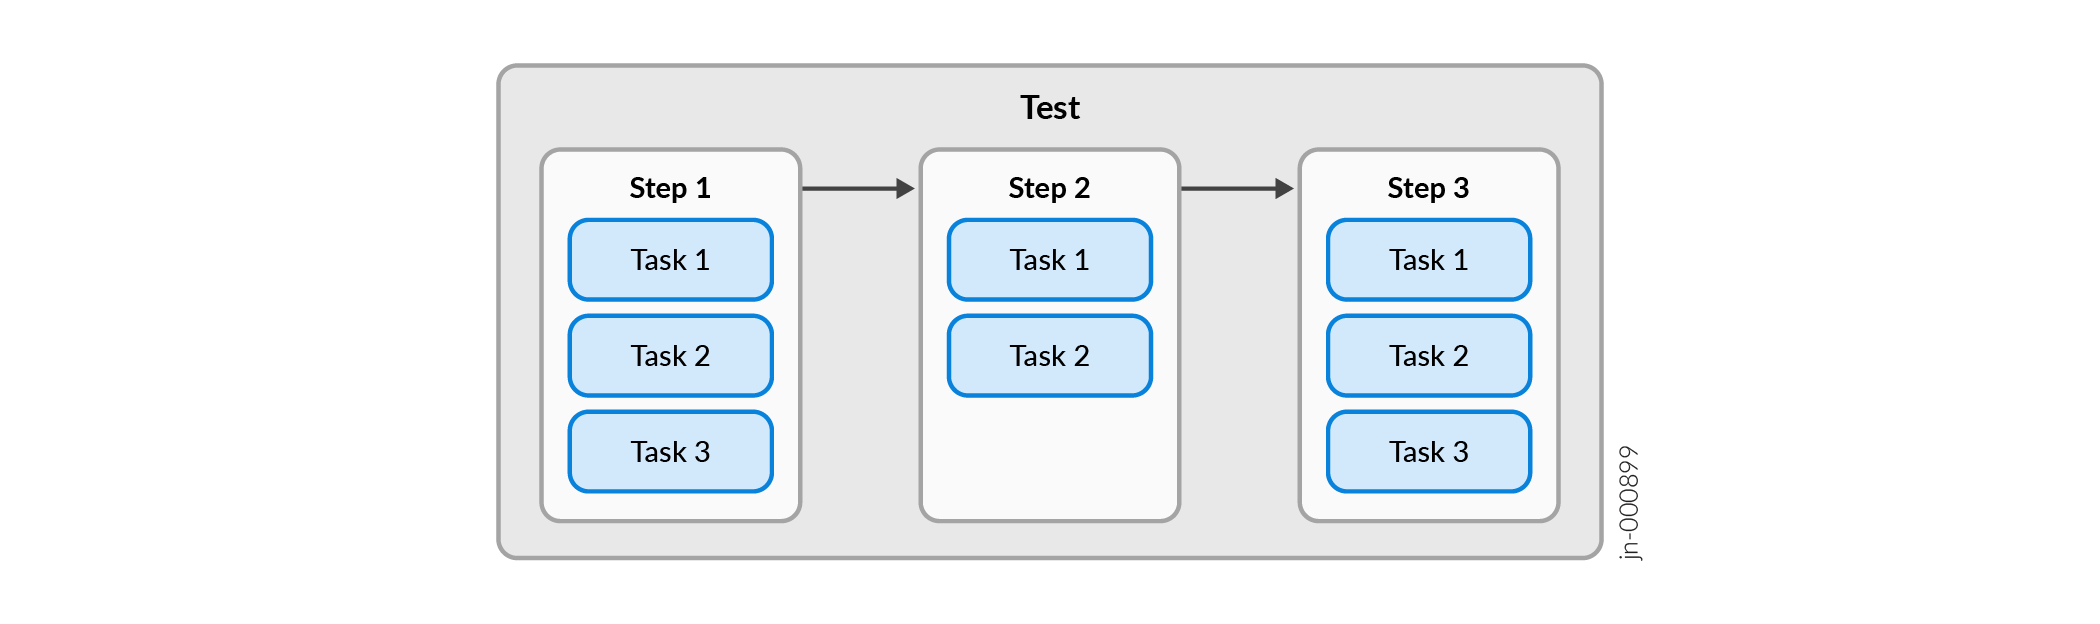
Test measures metrics in a time-bound manner and therefore you need to set the duration for each Step which determines the duration of the entire Test.
A Test delivers a binary result—Pass or Fail.
If any one Task with the Test fails, then Test status is displayed as Fail.
Measuring Metrics Using Active Assurance Monitors
A Monitor is a set of verifications that are performed by one or more Test Agents for an infinite amount of time. A Monitor can contain multiple Tasks, which run in parallel and continuously monitors the KPIs that are defined in the Monitor. A Task contains the configuration to measure specific metrics.
Figure 2 illustrates the relation between a Monitor and Tasks in Routing Director.

Monitors measure the metrics indefinitely until you decide to stop the Monitor. There is no limited time duration for which you want to stop a Monitor. Since you can start and stop a Monitor at will you need not set the duration.
A Monitor delivers a time-framed result as it runs continuously.
Supported Protocols
Routing Director enables you to configure the protocols listed in Table 1 for a Task.
|
Protocol |
Description |
|---|---|
|
Cisco IPSLA Ping |
The Cisco IP SLA Ping verification test is used to test and monitor IP reachability and network responsiveness, and measure packet loss. When the Measurement starts, Test Agents send ICMP Echo Requests to the configured target and collect statistics on response times and packet loss. Cisco IP SLA primarily uses the Internet Control Message Protocol (ICMP) to verify connectivity between the client and the destination. Cisco IP SLA Ping operations consist of an ICMP Echo Request from the client followed by an ICMP Echo Reply from the server. Running a Cisco IP SLA Ping verification test provides insight into network latency and path stability. Since high latency or packet loss directly impacts application performance and user experience, this Measurement helps in diagnosing connectivity and performance issues. This task supports both IPv4 and IPv6 network. |
|
Cisco IP SLA TWAMP Reflector |
The RPM Cisco TWAMP Reflector task configures a TWAMP (Two-Way Active Measurement Protocol) reflector on supported Cisco devices. This configuration enables the device to respond to TWAMP test packets sent by Test Agents, allowing measurement of metrics such as round-trip delay, jitter, and packet loss. Supported platforms include Cisco IOS XE and IOS XR. Note:
We recommend that you configure RPM Cisco TWAMP Reflector using API as configuring RPM Cisco TWAMP Reflector using the Routing Director GUI is a Beta feature. |
|
DNS |
The DNS task is used to test and monitor DNS servers. When a DNS task starts, the test agents send a request to resolve a lookup address, and collect statistics on response times. DNS primarily uses User Datagram Protocol (UDP) on port number 53 to serve requests. DNS queries consist of a single UDP request from the client followed by a single UDP reply from the server. Running a DNS task provides information about the response times of your DNS servers from different locations. High DNS response times translate into high response times for all services that use DNS to resolve IP addresses, such as web surfing. This task is applicable for both IPv4 and IPv6. |
|
DSCP Port Mapping |
The DSCP Port Mapping Measurement is used to Test DSCP remarking for traffic sent to specific UDP destination ports. Remarking changes the DSCP value on a packet as the packet traverses a network device. When a DSCP Port Mapping Measurement starts, Test Agents send traffic to configured UDP port ranges with a specified DSCP value and verify whether the traffic is correctly remarked as the traffic passes between two points in the network. The Measurement does not assess throughput or latency. Instead, it focuses on detecting mismatches between expected and received DSCP values for port-specific traffic flows. Running a DSCP Port Mapping verification test helps validate port-aware QoS policy enforcement across the network and identify remarking issues tied to specific UDP destination ports. This Plug-in is applicable for both IPv4 and IPv6 network. |
|
DSCP Remapping |
The DSCP Remapping Measurement is used to Test DSCP remarking across a network path. Remarking changes the DSCP value on a packet as the packet traverses a network device. When a DSCP Remapping Measurement starts, Test Agents send traffic marked with specific DSCP values between two points in the network and verify whether the DSCP values are correctly remarked as the traffic passes through. The Measurement does not assess throughput or latency. Instead, it focuses on detecting mismatches between expected and received DSCP values. Running a DSCP Remapping Measurement helps validate QoS policy enforcement across the network and identify remarking issues between Test Agents. This Plug-in is applicable for both IPv4 and IPv6 network. |
|
HTTP |
The HTTP Task is used to test or monitor HTTP servers. Running an HTTP Task checks the performance of a website or web application of the web server and of the network between the web server and the Test Agent. You can request web pages and verify response codes from distributed locations inside or outside of your network. When an HTTP Task starts, the Test Agents make an HTTP Get request towards the specified URL and fetch the response. The task does not render HTML pages. Hence, test agents do not make additional requests for linked resources, (images, CSS files, and so forth). Measured parameters include TCP connect time, time until first byte received, time until last byte received, and download speed. This task is applicable for both IPv4 and IPv6. |
|
IPTV MPEG |
The IPTV MPEG Task is used to monitor the IPTV channel quality. Running an IPTV MPEG Task provides information about the collecting MPEG loss, PCR jitter, rate, packet loss, and continuity count errors at Test Agent end-points. When the Task starts, the Test Agents join the channels by sending IGMP join messages. On receiving the MPEG streams, the Test Agents continuously measures quality. |
|
Netflix Speedtest |
The Netflix Speedtest Task is used to assess the performance of a Netflix speed test transaction. Running a speed test provides information on the bandwidth, latency, or threshold violations, if any. Routing Director instructs Test Agents to download Netflix test segments over HTTPS, so that your network can handle Netflix streaming optimally. |
|
OTT-HLS |
The OTT-HLS Task is used to integrate OTT service monitoring and selecting the highest possible quality to avoid buffering. When running an OTT-HLS Task, Test Agent parses the manifest file and starts downloading the video segments. The algorithm adapts to the current network conditions and selects the highest bit rate to avoid buffering. |
|
Path MTU discovery |
The Path MTU Discovery verification test is used to determine the maximum transmission unit (MTU) supported along the network path between the source and the destination. When the Measurement starts, Test Agents transmit probe packets of controlled sizes to identify the largest packet that can traverse the path without fragmentation. This process helps detect MTU limitations across your network. The Plug-in works by sending packets, which are sized according to the configured MTU values on the client and server Test Agent interfaces. If a packet is not successfully delivered, the algorithm adjusts by sending smaller packets until the maximum acceptable frame size is identified. The test fails if the discovered Path MTU is smaller than the configured minimum MTU threshold. Running this Measurement provides visibility into fragmentation behavior and path constraints. This task supports both IPv4 and IPv6 network. |
|
Pathtrace |
The Path Trace Measurement evaluates network performance by sending ICMP/UDP echo packets with increasing Time to Live (TTL). When the Measurement starts, Test Agent identifies actual routes of packets during a transmission from source to destination using the Paris Trace route algorithm. Path Trace enables you to validate traffic paths and evaluate network KPIs such as round-trip time, packet loss, hop count, and path changes. This Measurement is applicable for both IPv4 and IPv6 network. |
|
Packet Capture |
Packet capture helps you to analyze network traffic and troubleshoot network problems. It captures real-time data packets traveling over the network for monitoring purposes. When packet capturing is enabled on a Test Agent interface, the entire packet including the Layer 2 header is captured and stored as a file in .pcap format. You can specify the maximum size (up to 65535 bytes) for the packet that can be captured. Packets are captured as binary data without modification. You can analyse the packet information offline with a packet analyzer such as Wireshark or tcpdump. This allows you to analyze both IPv4 and IPv6 network traffic. |
|
Ping |
The Ping task initiates a task that checks connectivity to the remote device. Running a ping task provides information about the delay, delay variance (jitter), packet loss of the connection to the remote host. The Ping tool uses Internet Control Message Protocol (ICMP) or UDP to initiate a single request from the test agent to the host, followed by a single response from the host. This task works with both IPv4 and IPv6. |
|
QoS Policy profiling |
The QoS Policy Profiling verification test is used to validate the behavior of multiple Quality of Service (QoS) classes along a network path. At the start of the Measurement, Test Agents generate traffic flows, UDP or TCP, across up to six QoS classes, based on the flow types explicitly configured by the user for each class. During Measurement, each QoS class is exercised according to its assigned flow type. UDP flows are used to measure delay, jitter, packet loss, and buffer characteristics, providing insight into the performance of delay‑sensitive classes. TCP flows are used to evaluate throughput and bandwidth allocation for classes where sustained data transfer performance is the primary concern. For QoS classes where latency characteristics are more critical than throughput, the Measurement emphasizes UDP buffer delay deviation rather than TCP‑based metrics. |
|
RFC 6349 TCP Throughput |
The RFC 6349 Measurement is used to Test TCP throughput between a server and a client Test Agent. When an RFC 6349 Measurement starts, Test Agents perform TCP throughput verification test following the IETF RFC 6349 framework to assess the maximum achievable TCP transfer rate across a network path. The Measurement does not test UDP traffic or measure one-way delay. Instead, it focuses on measuring TCP performance and identifying bottlenecks that limit throughput. The measured parameters include TCP throughput rate, transfer time ratio, TCP efficiency, and the number of TCP streams. Running an RFC 6349 Measurement helps validate network readiness for high-bandwidth data communication and identify performance issues such as bottlenecks, buffer limitations, and retransmission overhead between Test Agents. This Plug-in is applicable for both IPv4 and IPv6 network. |
|
RPM HTTP |
The RPM HTTP Task checks connectivity to the remote device. Use this Task if you are using ACX, PTX or MX device. |
|
RPM PING |
Use this Task if you are using ACX, PTX or MX device. You can measure one-way measurements for ICMP timestamp probes that includes information on
|
|
RPM RFC2544 CCC |
RFC2544 tests are standardized benchmarks used to measure network performance metrics like throughput, latency, and frame loss. RFC 2544 tests are performed by transmitting test packets from a device that functions as the generator or the initiator. These packets are sent to a device that functions as the reflector, which receives and returns the packets back to the initiator. This Measurement configures and collects results from the probe service for RPM RFC2544 CCC generator/initiator. For more information, see RFC 2544-Based Benchmarking Tests. |
|
RPM RFC2544 ETH |
RFC2544 tests are standardized benchmarks used to measure network performance metrics like throughput, latency, and frame loss. RFC 2544 tests are performed by transmitting test packets from a device that functions as the generator or the initiator. These packets are sent to a device that functions as the reflector, which receives and returns the packets back to the initiator. This Measurement configures and collects results from the probe service for RPM RFC2544 ETH generator/initiator. For more information, see RFC 2544-Based Benchmarking Tests. |
|
RPM RFC2544 INET |
RFC2544 tests are standardized benchmarks used to measure network performance metrics like throughput, latency, and frame loss. RFC 2544 tests are performed by transmitting test packets from a device that functions as the generator or the initiator. These packets are sent to a device that functions as the reflector, which receives and returns the packets back to the initiator. This Measurement configures and collects results from the probe service for RPM RFC2544 INET generator/initiator. For more information, see RFC 2544-Based Benchmarking Tests. |
|
RPM RFC2544 REF CCC |
RFC2544 tests are standardized benchmarks used to measure network performance metrics like throughput, latency, and frame loss. RFC 2544 tests are performed by transmitting test packets from a device that functions as the generator or the initiator. These packets are sent to a device that functions as the reflector, which receives and returns the packets back to the initiator. This Measurement configures and collects results from the probe service for RPM RFC2544 CCC reflector. For more information, see RFC 2544-Based Benchmarking Tests. |
|
RPM RFC2544 REF ETH |
RFC2544 tests are standardized benchmarks used to measure network performance metrics like throughput, latency, and frame loss. RFC 2544 tests are performed by transmitting test packets from a device that functions as the generator or the initiator. These packets are sent to a device that functions as the reflector, which receives and returns the packets back to the initiator. This Measurement configures and collects results from the probe service for RPM RFC2544 ETH reflector. For more information, see RFC 2544-Based Benchmarking Tests. |
|
RPM RFC2544 REF INET |
RFC2544 tests are standardized benchmarks used to measure network performance metrics like throughput, latency, and frame loss. RFC 2544 tests are performed by transmitting test packets from a device that functions as the generator or the initiator. These packets are sent to a device that functions as the reflector, which receives and returns the packets back to the initiator. This Measurement configures and collects results from the probe service for RPM RFC2544 INET reflector. For more information, see RFC 2544-Based Benchmarking Tests. |
|
RPM TCP |
Use this Task if you are using ACX, PTX or MX device. |
|
RPM TWAMP |
Use this Task if you are using ACX, PTX or MX device. The two way active measurement protocol (TWAMP) facilitates the measurement of two-way or round-trip network performance metrics. Running a TWAMP Task provides information about the round-trip delay, delay variance (jitter), and packet loss. The Session-Initiator creates TWAMP test packets and sends to the Session-Reflector in the TWAMP server, and the Session-Reflector sends back a measurement packet when a test packet is received. TWAMP uses TWAMP-Control protocol to perform a handshake between initiator and reflector. |
|
RPM UDP |
Use this Task if you are using ACX, PTX or MX device. This Test checks if your network is good enough for quality-demanding services such as client–server applications and video conferencing. When a UDP Task starts, the Test Agents will generate traffic at the rate you specify. The rate is the Layer 2 Ethernet rate, also known as the Committed Information Rate (CIR). It includes the Ethernet headers with the CRC checksum but not the Frame Gap, Preamble, or Start of Frame Delimiter. The UDP flow sent by the sender Test Agent includes timestamps and sequence numbers, so that the receiving Test Agent can calculate one-way delay, jitter, and packet loss. |
|
TCP |
The TCP Task is used to assess the network performance for client-server applications by sending TCP sessions between Test Agents. Running a TCP Task provides information about the latency, jitter, throughput bandwidth, and monitor network congestion. When a TCP Task starts, the client Test Agents send TCP packets to server Test Agents, and receives measurement information from server Test Agents. This gives an overall view of the network. |
|
TWAMP Reflector |
The TWAMP Reflector is a component of TWAMP. It receives test packets from the Session-Initiator and reflects them back. Running a TWAMP Reflector helps in evaluation of the quality of the network and provides information on how data is transmitted in two-directions; between Session-Initiator and Session-Reflector. This bidirectional communication enables the measurement of performance metrics such as round-trip delay, delay variance (jitter), and packet loss. This Task is applicable for both IPv4 and IPv6. |
|
TWAMP/TWAMP Light |
|
|
UDP |
The UDP Task is used to evaluate the network quality for client-server applications and video conferencing. Running a UDP Task measures one-way delay, jitter, packet loss, and misorders of packets. When a UDP task starts, the client Test Agents send packets that include timestamps and sequence numbers to the server Test Agents at the rate you specify. In this way, the server Test Agent can calculate one-way delay, jitter, and packet loss. |
|
Y.1731 DM |
Y.1731 Delay Measurement (DM) task is used to evaluate the network performance with respect to time. It is a service OAM (Operations, Administration, and Maintenance) mechanism defined by the ITU-T to monitor network performance. Running a Y.1731 DM task measures delay and delay variance of packets. The local maintenance end point (MEP) sends packets that has timestamps to the remote maintenance end point (MEP) and vice-versa. The Test Agents then calculate one-way delay as well as two-way delay measurements. For more information on Y.1731 Ethernet Service OAM, see ITU-T Y.1731 Ethernet Service OAM Overview. |
|
Y.1731 SLM |
Y.1731 Synthetic Loss Measurement (SLM) task is used to measure the frame loss across the network. It is a service OAM (Operations, Administration, and Maintenance) mechanism defined by the ITU-T to monitor network performance. Running a Y.1731 Synthetic Loss Measurement (SLM) task measures the number of frames lost during transmission. The local MEP sends synthetic frames to the remote MEP and compares the number of frames transmitted with the number received. The ratio of lost frames to the total number of frames that are sent is calculated to measure the frame loss on the network. For more information on Y.1731 Ethernet Service OAM, see ITU-T Y.1731 Ethernet Service OAM Overview. |
|
VoIP |
The VoIP Measurement is used to test or monitor voice quality and network readiness for real-time voice communication between Test Agents. When a VoIP Measurement starts, Test Agents simulate hub-and-spoke VoIP traffic by sending UDP packets using a selected voice codec to generate realistic voice traffic patterns. Voice codec is the algorithm used to encode and decode voice traffic. The Measurement does not test TCP connections or render actual voice calls. Instead, it focuses on measuring voice quality indicators and network performance metrics that directly impact real-time communication. The measured parameters include Mean Opinion Score (MOS), delay (ms), jitter (ms), packet loss (%), and errored seconds (s). Running a VoIP Measurement helps validate network readiness for voice communication and identify issues such as high latency, jitter, and packet loss that degrade voice quality between Test Agents. This Plug-in is applicable for both IPv4 and IPv6 network. |
Benefits of Using Active Assurance Tests and Monitors
-
Enables you to analyze reachability, congestion, and response time in networks to support business critical applications.
-
Access historical view of errors in your network.
-
Customize parameters and thresholds to reflect the optimum network performance that you require.