
LLM Connector Overview
The LLM Connector tool, embedded in Juniper Routing Director, is an advanced AI-driven tool for leveraging your large language models (LLMs) (also known as bring your own LLM) to streamline network monitoring operations.
LLM Connector facilitates the use of natural language to query network status and obtain troubleshooting information, without the need for traditional CLI commands. The natural language interface supports a variety of query types, ranging from simple status checks to more complex troubleshooting commands.
LLMs are trained on data up to a certain date. So, an LLM may not include information about the latest Routing Director releases and features.
If you do not have an account in Juniper Cloud, contact https://support.juniper.net/support/for creating an account,
Figure 1 shows the LLM Connector chat window when minimized (default).
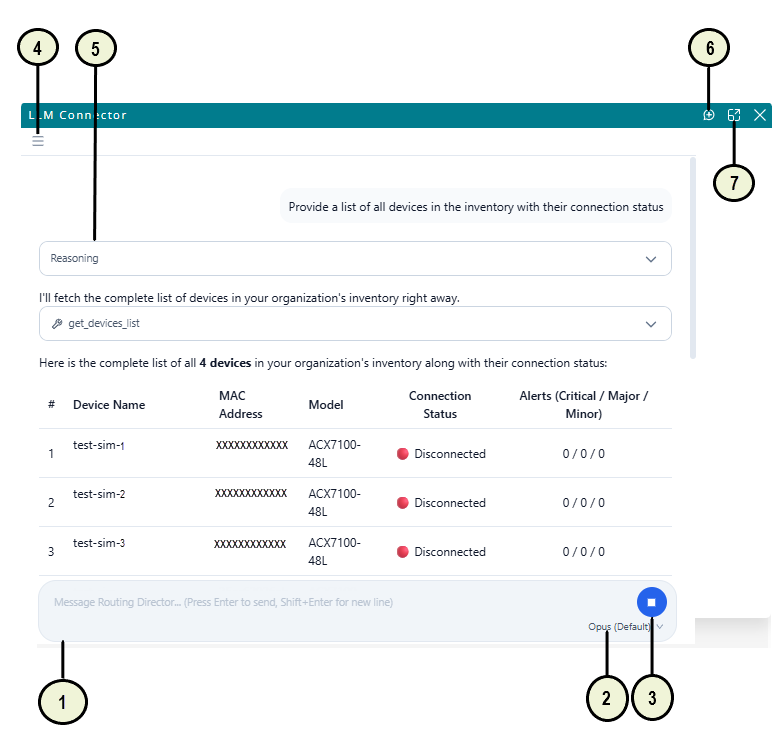
1 — Query input field | 5 — Response generation details |
2 — LLM being used | 6 — New chat window |
3 — Stop button | 7 — Maximize window |
4 — Chat history icon |
When you enter a query, the LLM Connector communicates with configured LLM models in real-time and provides live response streaming, that is, the responses to your query appear progressively as they are generated. You can interrupt the response generation at any time by using the Stop button.
LLM Connector provides responses with supporting details such as tools used, tool outputs, and LLM reasoning (when available). The supporting details are grouped into collapsible sections to reduce clutter. Code snippets in the output have syntax highlighted, and the code blocks are expandable and collapsible.
If the response includes a dashboard, you will see a View Dashboard button in the response. Click the View Dashboard button to view the dashboard in a separate panel. You can adjust the size of the dashboard panel by dragging its left edge. Once the dashboard is open, the button label changes to Viewing Dashboard.
The header of the dashboard panel includes the following options:
-
Preview—Click this option to view the dashboard in a visual and interactive format. This option is selected by default.
-
Code—Click this option to view the HTML code of the generated dashboard.
Use the Copy option that appears on the right-side of the dashboard to copy the HTML code.
-
Save—Click this option to save the code on your local system in the HTML format or export in the PDF format.
-
Close—Click this option to close the generated dashboard.
Figure shows dashboard generated in response to a query.
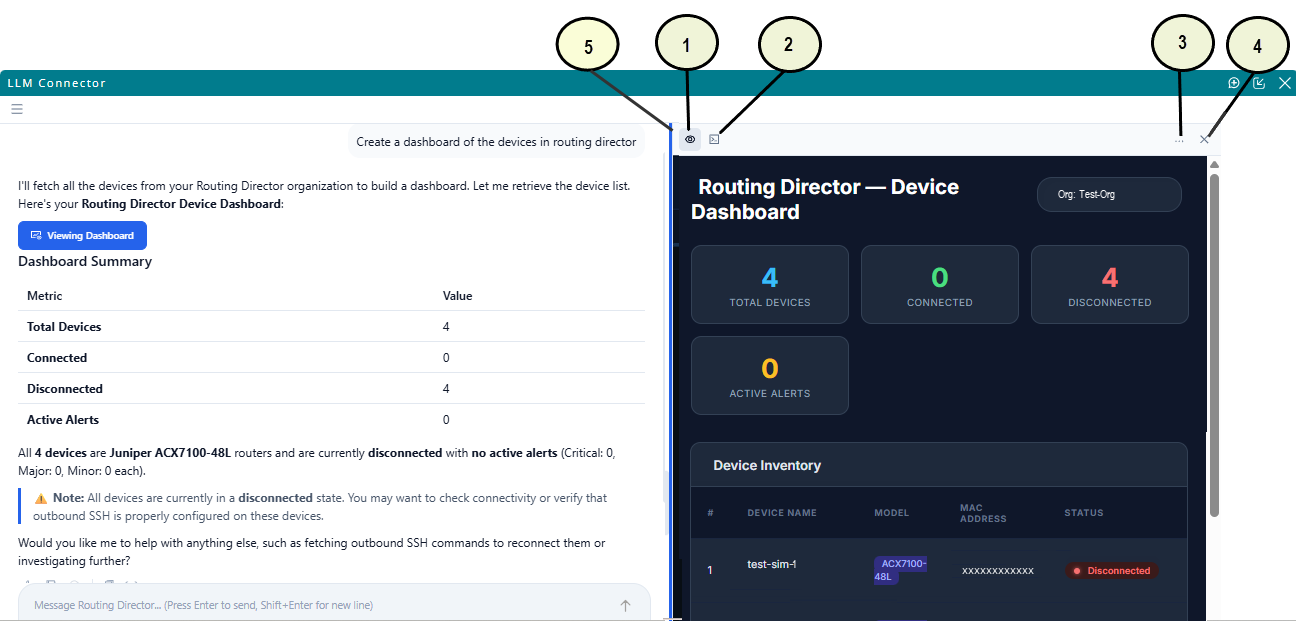
1 — Preview | 4 — Close |
2 — Code | 5 — Dashboard panel edge for resizing |
3 — Save |
At the bottom of each response, LLM Connector provides:
-
Feedback option: A thumbs up and thumbs down option allows you to indicate whether the response was helpful or not helpful respectively.
-
Copy options: The following copy options are available
-
Copy response copies the response displayed on the chat window.
-
Copy raw message (json) copies the full API response, including additional metadata, in JSON format.
-
References for answers fetched
-
Recommendations for follow-up queries
-
If the session is idle for more than fifteen minutes, LLM Connector creates a new session for subsequent queries. To revisit any of your older queries, click the Chat History icon represented by a Hamburger button, located on the top left-corner of the LLM Connector window. The chat history lists all your previous conversations. You can easily resume any conversation by clicking on it.
Query Examples
LLM Connector can help you with:
-
Retrieving device information. For example:
-
List all routers in the network with hostname, model and OS version.
-
List the major alarms and alerts on device A over the past 24 hrs.
-
-
Executing Junos OS operational and configuration commands. For example:
-
List all interfaces on device A that are operationally down; include admin state and description.
-
Show critical and major alarms on device A from the past 24 hours.
Audit logs are generated if the commands executed through the LLM connector is committed on the device. A Super User or a Network Administrator with appropriate permissions can view these logs from System Settings > Audit Logs.
-
-
Getting Insights based on the telemetry collected from the device. For example:
-
Analyze the last 6 hours of telemetry for interface et-0/0/0 on device A.
-
Provide insights on health of device A over the last 12 hours: CPU, memory utilization, temperature, and fan RPM.
-
-
Retrieving a list of all VPNs in your network and their details, metrics, and health information. For example:
-
Retrieve a list of all VPNs across my network. For each VPN, include SLA compliance, active alarms and incidents, recent flaps, and last change time in a tabular format.
-
List all VPN tunnels configured on device A.
-
-
Fetching information about customers and service instances associated with customers. For example:
-
Retrieve a list of all customers in my network and the details of the VPNs associated for each customer.
-
List the service instances currently Degraded or Down, grouped by customer.
-
-
Plotting dynamic graphs related to state and metric graphs. For example:
-
Plot interface traffic utilization and operational status of ge-0/1/2 from device X.
-
Plot FPC memory utilization and Routing Engine CPU utilization of device Y.
-
-
Answering aggregation queries. For example:
-
List top 5 and bottom 5 power consuming devices in the inventory.
-
List the average interface utilization on device X.
-
-
Answering queries by referencing HPE Juniper Networking documentation. For example:
-
What are the supported Junos OS versions on MX301?
-
What are the pre-requisites for configuring EVPN on a Junos device?
-
-
Searching for specific alerts, alarms, system logs, and Juniper Resiliency Interface (JRI)-related events (forwarding exceptions, operating system (OS) and routing exceptions. hardware faults, and so on that may lead to traffic loss). For example:
-
Show all Juniper Resiliency Interface (JRI) related events, including failover triggers, redundancy state changes, and resiliency errors from Juniper devices in the past 12 hours
-
Show all 'link-down' critical alarms on Juniper devices in the last 1 hour, including affected interfaces and associated system log events.
-
-
Generating interactive dashboards using natural language prompts. For example,
-
Generate a dashboard showing all hardware metrics for device X over the past 1 hour.
-
Generate a dashboard showing all the alert counts by severity (Critical, Major, and Minor) for device X.
See Figure for details.
-
Setup LLM Connector
To use the LLM Connector tool, you need to set up the LLM and provide parameters such as API keys and model details. For information about configuring LLM, see Configure LLM Connector.
Access LLM Connector
You can access LLM Connector by clicking the LLM Connector icon displayed on the right-bottom corner of the GUI as shown in Figure 3. You can move the icon around and anchor it on any of the four corners on the GUI.
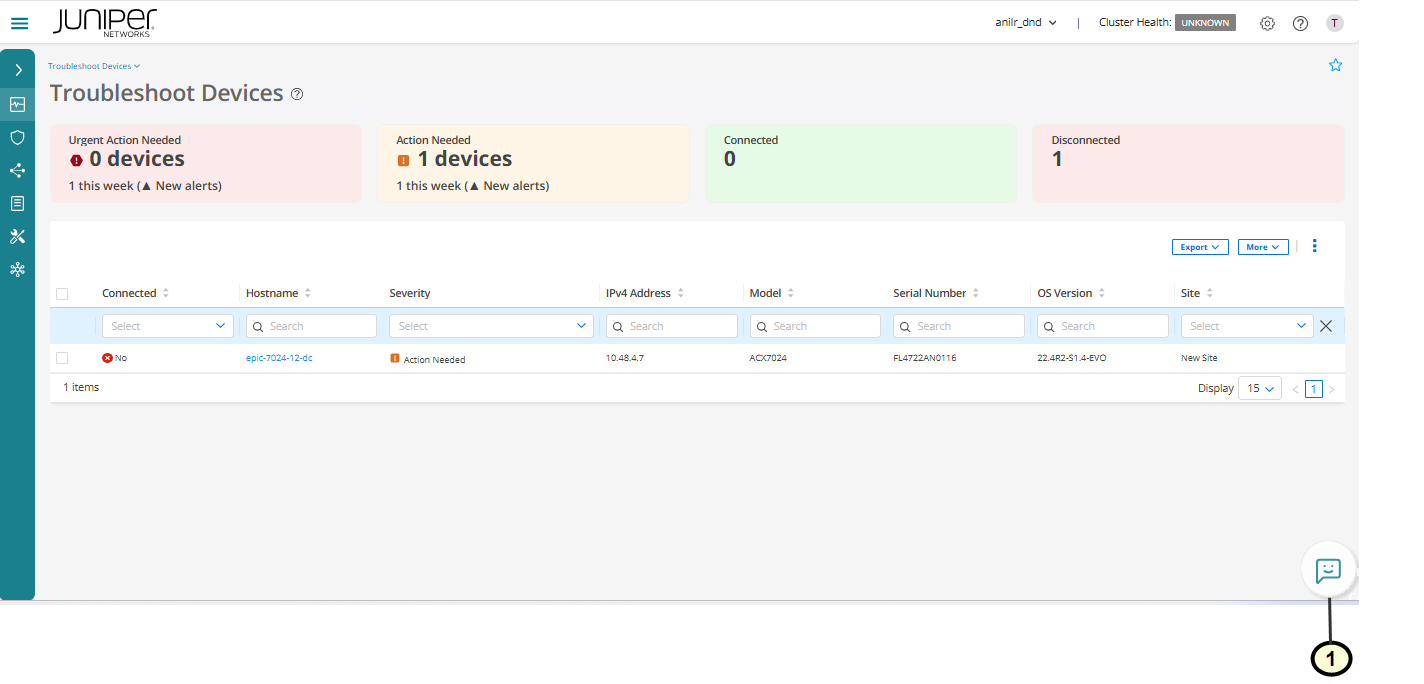
1 — LLM Connector icon |
LLM Connector Actions
LLM Connector provides the following action menu items on the LLM Connector chat window:
-
Conversation History—Click the Conversation History (Harmburger button) on the top left corner of the LLM Connector window to view the conversation history. Clicking the Conversation History displays the conversations on a panel on the left-side of the LLM Connector window.
The conversation history is listed, grouped by the time of chat as Today, Yesterday, Last Week, and so on.
To open a new conversation, click the New Conversation icon (+) at the top of the conversation history panel.
-
Search—A Search field is provided in the Conversation History. Enter a search text in the Search field to search for conversations and chats. LLM Connector matches the search text that you enter with the chat title in the Conversation History panel and fetches the corresponding conversation.
-
View and change LLM—The LLM currently in use is shown in the bottom-right corner of the query field. Click the arrow next to the LLM to view a list of all configured LLMs. An LLM marked with (Default) is the default model used by LLM Connector. To switch to another LLM, select a different model from the list. All subsequent queries in the current session will be processed by the newly selected LLM.
Once the current session expires, the LLM Connector automatically reverts to using the default LLM in the next session.
-
Maximize/Minimze window—By default, the LLM Connector window is minimized when you open. Click the Maximize icon on the top-right corner of the chat window to maximize the LLM Connector window.
Benefits of LLM Connector
-
Reduces Workload on NOC Teams: By providing clear guidance for troubleshooting tasks, LLM Connector significantly lowers the operational burden on Network Operations Center (NOC) teams, freeing them to focus on more complex issues.
-
Accelerates Problem Resolution: LLM Connector provides rapid, contextually relevant solutions by executing necessary commands and parsing results, which enables you to solve problems quickly.
-
Simplifies Training Requirements: LLM Connector minimizes the learning curve to work with Routing Director for new operators by allowing them to interact with the Routing Director using natural language queries, reducing the time and effort required to become proficient.
-
Enhances Data Privacy and Security: By supporting Cloud, Private Cloud, and On-Premises deployments, LLM Connector offers flexible options that cater to various data privacy and security needs, ensuring secure operations.
-
Improves System Usability: The integration of function calling capabilities with a range of LLM models enables precise and efficient interactions with external systems, enhancing the overall usability of Routing Director as a troubleshooting tool.