Test Agents Overview
Active Assurance uses Test Agents, which are software components deployed at strategic points in the network. A Test Agent acts as a measurement point that generates and receives synthetic traffic to evaluate network performance. By collecting performance data, Test Agents enable continuous monitoring, troubleshooting, and service validation from an end-user perceptive. These Test Agents are centrally managed through Routing Director GUI.
There are two types of Test Agents:
-
Test Agent Application—A lightweight Test Agent that runs within a docker container on an existing operating system. This type of Test Agent does not support interface configuration and certain advanced use cases. You can deploy a Test Agent Application natively in an x86 platform or as a docker container.
-
Test Agent Appliance—A full-fledged Test Agent with built-in operating system that allows full control over network configuration and supports advanced functionalities. You can deploy a Test Agent Appliance as a virtual machine or a custom x86 hardware.
Test Agents can be installed on Junos OS Evolved routers, x86 hardware, or virtual machines running in a docker container. On ACX7000 series routers that use Junos OS Evolved, Test Agents can run as Docker containers, or be installed automatically during the onboarding process. For these routers, Real-Time Performance Monitoring (RPM) functionality can also be used to generate traffic and collect performance metrics that help analyze network behavior.
On MX and PTX series routers, the Real-Time Performance Monitoring (RPM) feature is used to generate traffic and collect metrics that measure network performance. RPM allows you to configure active probes that track and monitor traffic. When RPM is configured on a device, these calculate network performance based on packet response time, jitter, and packet loss. To gather RPM statistics, the device sends probes to a specific probe target identified by an IP address. The target responds to the probe, and the device uses this exchange to measure performance. See Monitoring Traffic Using Real-Time Performance Monitoring (RPM).
-
When running concurrent RPM probes on a router, you must specify the probe limit between 1 through 500 to avoid the probe limit error. See Limiting the Number of Concurrent RPM Probes.
-
When you use RPM plug-ins, you must set the system-level timezone in the routers to manage daylight saving time (DST) effectively. In the absence of a proper timezone setting, RPM plug-ins rely on a fallback mechanism that checks the time difference from UTC every hour to adjust the offset.
In addition, you must synchronize routers with a Network Time Protocol (NTP) server for accurate timekeeping.
For any other x86 hardware or virtual machines (VMs), you need to manually install Test Agents. For information on installing Test Agents, see Install Test Agent Application. APIs can also be used to create, install, or uninstall Test Agents through Routing Director. Once deployed, Test Agents are listed on the Test Agents page (Inventory > Active Assurance) in the Routing Director GUI . See About the Test Agents Page.
How Test Agents Measure Metrics
Figure 1 illustrates the relationship between a Test Agent plug-in, measurements, tasks, and streams.
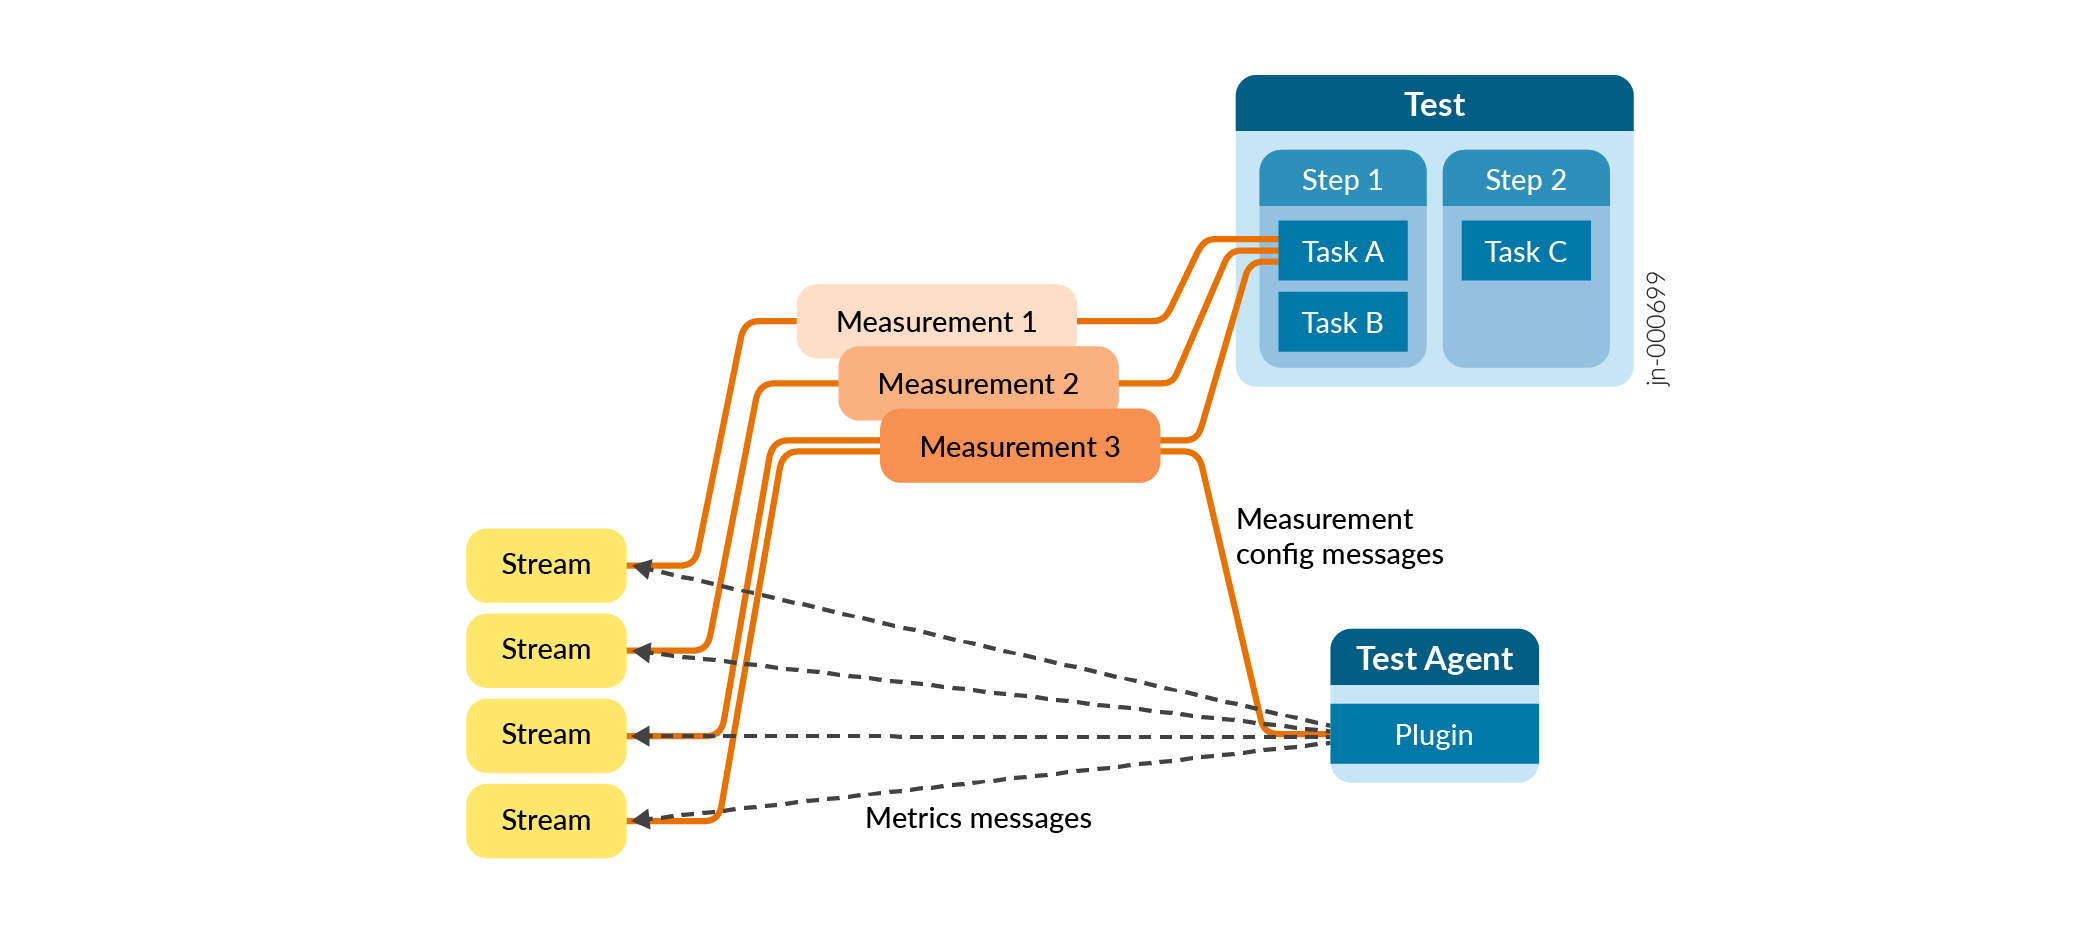
Routing Director leverages the capability of monitoring and testing the network's data plane by generating synthetic traffic using Test Agents or devices deployed in the network. Test Agents are configured to run a set of Measurements as defined by the Tests and Monitors.
Routing Director contains a set of features to produce Measurements in the network's data plane in the form of plug-ins (For example, Ping, HTTP, and so on). When you configure a Measurement using the Routing Director GUI or REST APIs, Routing Director configures the Test Agent to download the plug-in and pushes the configuration to Test Agent.
While configuring a Measurement, you can also set evaluation criteria. The evaluation criteria contain thresholds for the individual metrics. Routing Director uses the thresholds, which you have defined, to determine the network's behavior. If the threshold is violated, then Routing Director generates events.
A Measurement produces one or more Streams. The Stream contains the measured metrics (also known as KPIs). Routing Director evaluates these metrics against the threshold set in the evaluation criteria. For example, you can set that the threshold for delay to be below 10 milliseconds. If such a threshold is violated an event is raised with the configured severity.
Test Agents send streams from the source device, on which you have installed the Test Agent, to a remote endpoint. The remote endpoint can be a remote Test Agent, Web servers, DNS servers, or a known device in the public cloud provider's network.
To summarize, you create a Test or a Monitor using the Routing Director GUI or REST API to configure the plug-ins, the metrics, the evaluation criteria per metric, and so on. When you run the Test or the Monitor, Test Agent starts downloading the plug-in and starts the measurement and their associated Streams.
For information on Active Assurance Terminologies, see Active Assurance Terminologies.
For information on creating Tests and Monitors, see Create a Test and Create a Monitor.
Benefits of Using Test Agents
-
You can install Test Agents on any x86 platform or as a Docker container.
-
You can automate testing and data collection using Test Agents.
-
You can test network performance at specific location before deploying a business critical application.