ON THIS PAGE
Marvis Actions for Routers
Marvis Actions dashboard in Juniper Routing Assurance displays a list of all the events that affect the performance of a router. You can review the events displayed in Marvis Actions and update their statuses. Marvis Actions for Routers currently supports the High CPU and Network Port Flap events.
To view Marvis Actions for Routers, click Marvis > Router.
You can update the status of an event individually or perform a bulk status update for multiple events. Click the Status drop-down list to update the status of an event. An event can have one of the following statuses:
-
Open─The event has been logged but has not yet been addressed.
-
In Progress─The event is currently being investigated by a network administrator.
-
Resolved─The issue associated with the event has been addressed and no further user action is required. After resolving an event, you are prompted to provide additional context on how the event was addressed. The resolution options are:
-
Solved using Marvis suggested action─Event resolved based on recommendation from Marvis.
-
Solved using another method─You can use the comment box below to describe how the event was resolved.
-
A known issue and can be ignored in the future─The event will be snoozed for 60 days.
During this snooze period:
- The event will not trigger further notifications in Marvis Actions.
- Instances of the same event during this period will be automatically suppressed.
- If the event reoccurs after 60 days, it will be treated as a new event and follow the standard Marvis Actions work-flow for router events.
-
Incorrectly listed as an issue─The event was determined to be a non-issue or an incorrect alert, requiring no user action.
-
If the same event occurs multiple times on a router, those occurrences are consolidated into a single event and displayed in Marvis Actions. You can mark the status of an event as In Progress to indicate that an administrator is working on resolving the event. Resolving a specific event will only resolve that occurrence of the event and will not resolve future occurrences of the same event.
High CPU
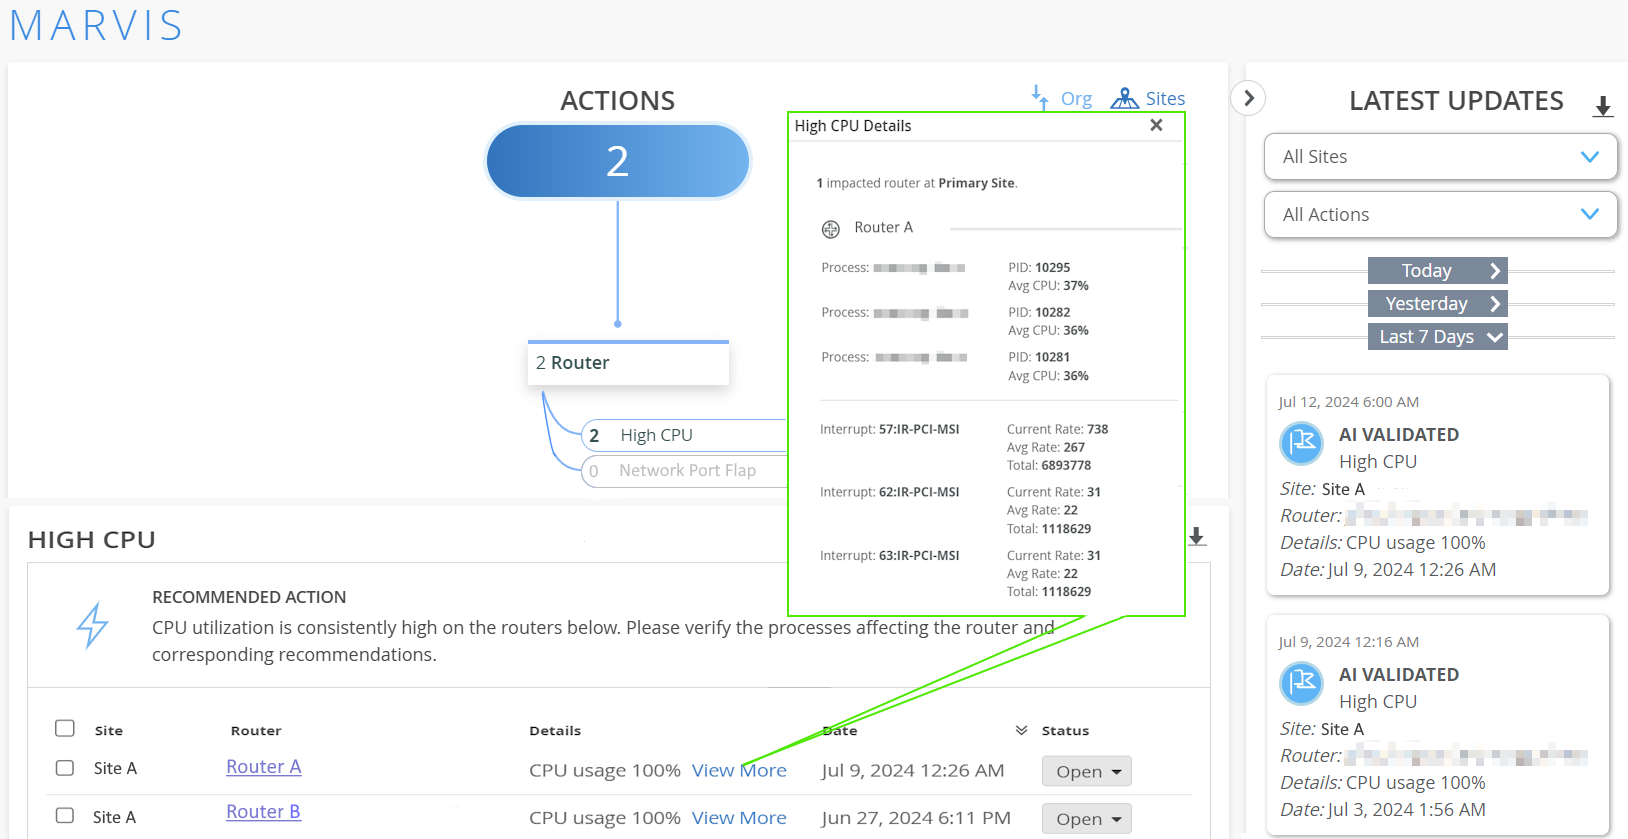
Many factors, such as hardware issues, device temperature, high route churn from frequent protocol updates, interface flapping, and other router events can increase CPU utilization on a router. Marvis detects routers that constantly have high CPU utilization and provides detailed information about each high CPU event. This includes the router name, CPU utilization rate, the date and time the event was recorded, the current status of the event, and even the recommended action to resolve the event.
To view the High CPU event, click Marvis > Router > High CPU.
Click View More to view the individual processes. These processes include the routing protocol process (rpd), other user processes and interrupts that contribute toward high CPU utilization.
Marvis reports high CPU event for these software processes: user or background process, interrupts and rpd.
Marvis triggers a high CPU event for user processes and interrupts when the average total CPU utilization is greater than 90 percent.
Marvis triggers a high CPU event for rpd tasks when all the following conditions are met:
-
The average total CPU utilization is greater than 90 percent.
-
The overall CPU utilization for user processes is greater than 70 percent.
-
The average rpd CPU utilization is greater than 40 percent.
- User or Background Process Consuming High CPU
- Interrupt Process Consuming High CPU
- RPD Consuming High CPU
User or Background Process Consuming High CPU
High-CPU usage by user processes on the routing engine indicates that one or more software components consume excessive resources. Marvis identifies and alerts network administrators about such processes. Key details such as Process Identifier (PID) and average CPU utilization by the process are highlighted in a tabular format to support quick and easy troubleshooting. Network administrators can use these insights to resolve the event.
You can further investigate the CPU consumed by each software process from the router CLI using the following CLI commands:
-
show system virtual-memory | no-more -
show task memory detail | no-more -
show log messages | no-more
Check the output of the above commands around the time of the high CPU utilization event for any additional clues. If you find any outliers here, contact your Juniper Support representative to resolve the event.
Click the Router Name to navigate to the router Insights page to view the CPU Utilization graph for the interval reported by the event.
See Table 1 for field descriptions.
Interrupt Process Consuming High CPU
Interrupts are signals from hardware (such as network interfaces) to the CPU and request immediate CPU attention. Excessive interrupts can increase the CPU load on the routing engine. High packet forwarding rates or increased interface activity may spike interrupt handling, leading to high CPU utilization. Effective interrupt handling is crucial for ensuring optimal system performance and maintaining control plane stability.
Some of the reasons for interrupt process consuming high CPU are as follows:
-
Duplication via IP/ARP flooding on one of the router's ports. In this case, high CPU utilization may even cause the connection to be lost between both the routing engines.
-
Out-of-band (OOB) devices can trigger interrupts.
Network administrators can further investigate the CPU consumed by interrupt process from the router CLI using the following CLI commands:
-
show chassis routing-engine -
show system process extensive | no-more -
show system virtual-memory | no-more -
show task memory detail | no-more -
show log messages | no-more
If you find any outliers here, contact your Juniper Support representative to resolve the event.
See Table 1 for field descriptions.
RPD Consuming High CPU
In addition to monitoring the CPU utilization by user processes and interrupts, Marvis also identifies routing protocol process (rpd) tasks with high CPU time. The Junos routing protocol process is a software process within the routing engine software, and controls the routing protocols (for example, BGP, OSPF, and so on) that run on the router. Its functionality includes starting and handling these protocols, maintaining the routing information in the routing table, implementing routing policies, and handling route convergence.
In large networks, rapid route convergence can cause the rpd process to consume excessive CPU resources, which might impact other control plane processes. To preserve overall router performance and stability, it is crucial to mitigate high CPU usage by the rpd tasks. Marvis continuously monitors CPU consumption by rpd and alerts network administrators when CPU usage exceeds predefined thresholds.
When the rpd process on a router consumes high CPU for an extended period, systematic data collection and analysis are essential to find the root cause. Marvis constantly monitors the rpd tasks by collecting their CPU consumption samples at regular intervals. For each sampling interval, Marvis computes the average CPU usage. This average is then normalized to a per-minute scale to ensure consistency. Marvis then displays these normalized values in an easy-to-understand tabular format.
If rpd is one of the top processes that consume high CPU, you can see it listed under the Top Processes section in the High CPU Details page. Click More details to expand the list of rpd tasks.
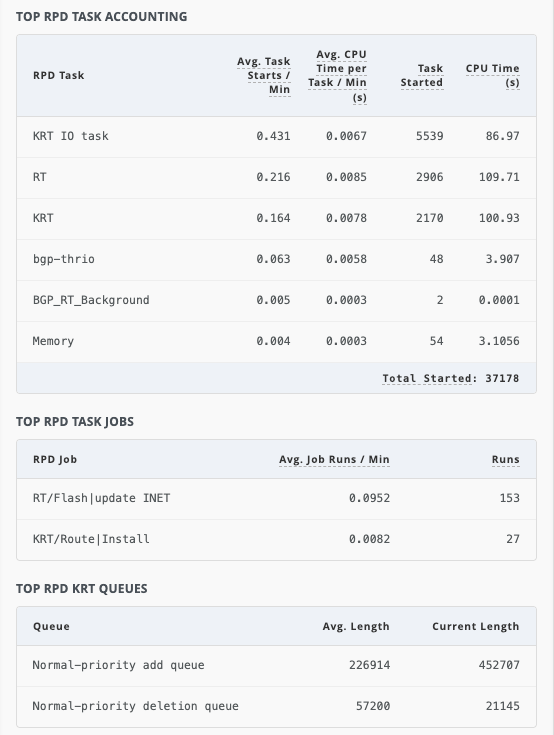
The TOP RPD TASK ACCOUNTING section displays detailed information about the top internal tasks and threads that contribute to high CPU usage, within the control plane. Administrators can use this data to investigate why a thread, which is related to a specific prefix or protocol, is consuming high CPU. A specific task taking an unusually long time or running too frequently indicates route churn and protocol instabilities. Administrators can use the data in this section to detect CPU usage trends and take corrective action before router performance degrades.
The TOP RPD TASK JOBS section displays detailed information about the top individual rpd jobs that contribute to high CPU usage.
In Junos OS, rpd jobs or tasklets are discrete units of work executed by rpd. Each rpd job is designed to execute quickly and yield control back to the scheduler, which helps prevent CPU starvation. CPU starvation refers to a situation where a task is unable to get sufficient CPU time for execution because other tasks are consuming most or all of the CPU resources. So, an rpd job is designed to be lightweight, ensuring that critical routing functions are not delayed. Monitoring rpd jobs is crucial to understanding the performance of control plane. If certain rpd jobs are consume excessive CPU or take too long to complete, the condition may indicate route churn or instability in the system.
Network administrators can use the information in this section to pinpoint which routing functions are contributing most to CPU usage and take corrective actions.
The TOP RPD KRT QUEUES section displays the average length and the current length of the Kernel Routing Table (KRT) queue.
The KRT queue synchronizes routing table updates to the Packet Forwarding Engine (PFE). The length of the KRT queue reflects the number of routing operations (such as add, delete, modify, and so on) waiting to be processed by the kernel. The length of the KRT queue is a key indicator of the health of the control plane. A short queue length means routing updates are processed without any delay. A long or a growing queue length indicates that the rpd is generating routing updates faster than the kernel can process them.
Frequent route churn, route flaps, and large-scale configuration changes are some of the factors that can affect KRT queue length. When the KRT queue fills up with many route operations, the rpd must process each of them. These operations are CPU-intensive. Sustained high CPU usage due to a long KRT queue may cause routing protocol sessions to flap and can delay route installations.
A growing queue that does not drain quickly is a red flag. Hence, monitoring both the KRT queue length and CPU usage together provides valuable insight into the health of the control plane.
In Figure 2:
-
KRT IO taskhas started 0.431 times on average during the sampling period (~20 minutes), normalized to a per-minute scale. This task has spent an average of 0.0067 seconds executing in user mode during the sampling period (~20 minutes), normalized to a per-minute scale. -
All rpd tasks were executed 37178 times in the last sampling period.
-
The rpd job,
RT/Flash|update INET, has started 0.0952 times on average during the sampling period (~20 minutes), normalized to a per-minute scale. This rpd job was executed 153 times in the last sampling period. -
There are 452707 pending add operations waiting to be processed by rpd. 226914 is the average number of pending add operations in the KRT queue during the sampling period (~20 minutes), waiting to be processed.
This means that Marvis has detected a significantly high number of entries in the KRT queue, contributing to high CPU utilization. Administrators are advised to investigate and resolve the issue to ensure router stability.
Click the Router Name to navigate to the router Insights page to view the CPU Utilization graph for the interval reported by the event.
For field descriptions, see Table 1.
Continuous monitoring of KRT queue length is recommended to detect sudden spikes or sustained growth in queue length. Such patterns may indicate control plane issues.
|
Field |
Description |
|---|---|
|
Process |
Name of the process. |
|
PID |
Process Identifier (PID) of the process. |
|
Avg CPU |
Average CPU utilization by the process during the sampling period (~20 minutes). |
|
Interrupt |
Name of the interrupt. |
|
Current Rate |
Current rate of change of the interrupt count. A higher current rate suggests that the CPU utilization by the router is increasing, resulting from interrupt handling. |
|
Avg Rate |
Average rate of change of the interrupt count. A higher average rate suggests that the CPU utilization by the router is increasing, resulting from interrupt handling. |
|
Total |
Total number of interrupts since the first High CPU event. |
|
RPD Task |
Name of the rpd task. |
|
Avg. Task Starts/Min |
Average number of times the rpd task has started during the sampling period (~20 minutes), normalized to a per-minute scale. |
|
Avg. CPU Time per Task/Min |
Average amount of CPU time (in seconds) that the rpd task has spent executing in user mode during the sampling period (~20 minutes), normalized to a per-minute scale. |
|
Task Started |
Number of times the rpd task has started during the sampling period (~20 minutes). |
|
CPU Time |
Amount of CPU time (in seconds) that the rpd task has spent executing in user mode during the sampling period (~20 minutes). |
|
Total Started |
Number of times all the rpd tasks have started during the sampling period (~20 minutes). |
|
RPD Job |
Name of the rpd job. |
|
Avg. Job Runs/Min |
Average number of execution instances of the rpd job during the sampling period (~20 minutes), normalized to a per-minute scale. |
|
Runs |
Number of execution instances of the rpd job. |
|
Queue |
Route operation placed in the KRT queue. |
|
Avg. Length |
Average number of pending routing operations (such as add, delete, modify, and so on) in the KRT queue during the sampling period (~20 minutes), waiting to be processed. |
|
Current Length |
Number of pending routing operations (such as add, delete, modify and so on) in the KRT queue waiting to be processed. |
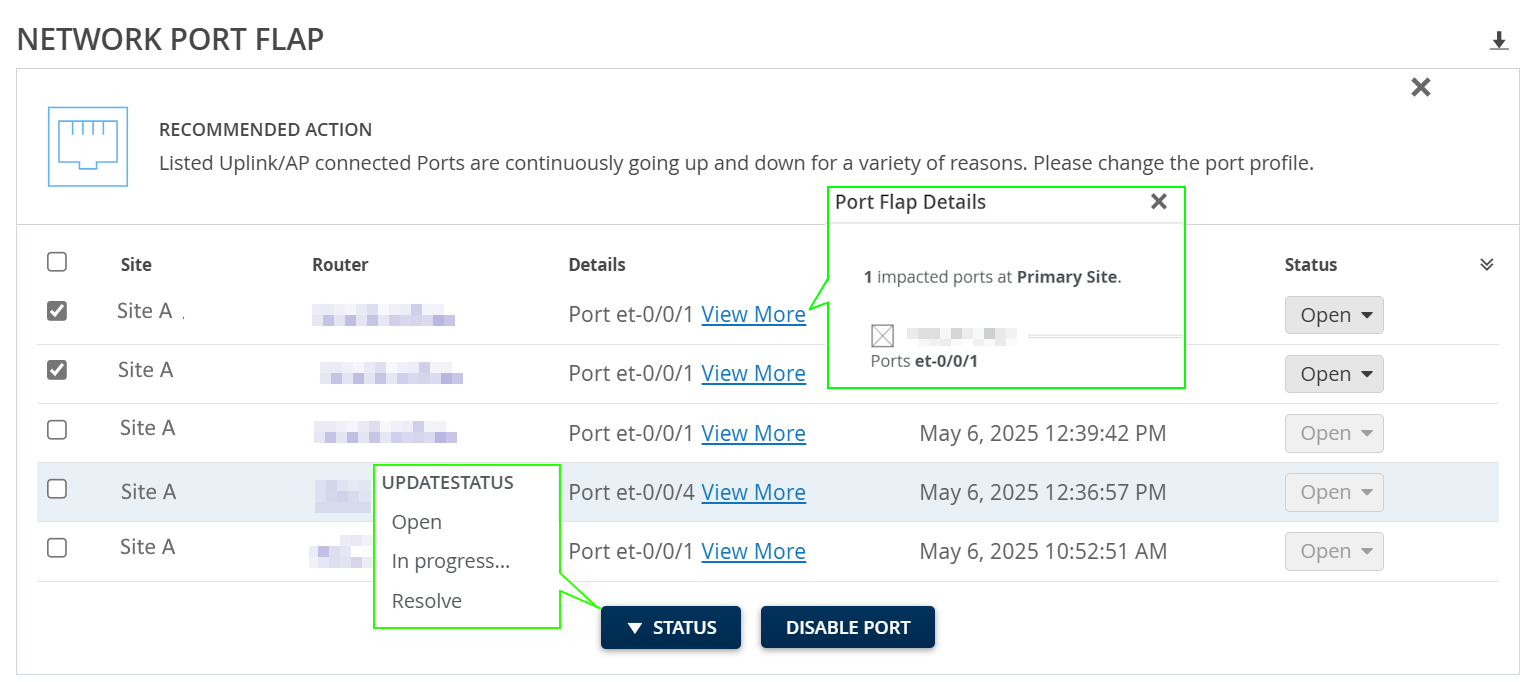
Network Port Flap
To view the Network Port Flap event, click Marvis > Router > Network Port Flap.
The Network Port Flap event identifies router ports that persistently go up and down in a rapid manner. The instability resulting from port flapping disrupts network connectivity and degrades the end-user experience. Some of the reasons for port flapping are:
-
Faulty cables and connectors.
-
Mismatch in duplex settings of the connected devices.
-
Hardware or software malfunctions on the router.
-
Inconsistent power supply or power surges.
The Network Port Flap event provides details such as the site, router, date and time when the event was recorded, event status and even the recommended action to resolve the event. Click View More to view the list of ports that flapped.
You can disable the router's ports to address port flapping temporarily. Disabling the ports stops the immediate flapping and can stabilize the network temporarily.
To disable the router's flapping port/ports, see Disable Flapping Ports.
As a basic troubleshooting step, network administrators can check the cable connection and perform the loopback diagnostic test. You can further investigate the flapping ports from the router CLI using the following CLI commands:
Check the physical link status of the interface with the command:
show interfaces interface-name
                        media
Check the interface statistics in detail with the command:
show
                            interface interface-name extensive
If you find any outliers here, contact your Juniper Support representative to resolve the event.
You can mark the status of an event as In Progress to indicate that an administrator is working on resolving the event. Resolving a specific event will only resolve that occurrence of the event and will not resolve future occurrences of the same event.