About the Support Insights Page
JSI provides a set of dashboards that summarize support insights at the organizational level, along with device-specific insights accessible through the Installed Base. The Support Insights dashboards offer data-driven, actionable insights into the operational health of the devices in your organization.
Use these dashboards to:
-
Access security vulnerabilities and bug notifications that may impact your assets.
-
Monitor alarms generated on onboarded devices.
-
Understand overall support posture to assist with the planning of preventative or corrective actions.
You can export dashboard data as CSV files to access the support insights offline or customize it to your needs.
To access the support insights dashboards, navigate to Organization > Support Insights or Organization > Inventory > Installed Base > Support Insights.
If you want to access device-specific insights, navigate to the Installed Base (Organization > Inventory > Installed Base) page. For more information, see View and Manage Installed Base
-
To view data in the support insights dashboards, ensure that at least one Juniper account is linked to the organization or there are onboarded devices in the organization. Otherwise, the dashboards will appear blank.
-
Support insights for an onboarded device will be available only in the organization to which it is onboarded.
The following sections describe the dashboards available on the Support Insights page:
The dashboards are refreshed every 24 hours.
Security Vulnerabilities Dashboard
Juniper Networks Security Incident Response Team (SIRT) issues advisories to inform you about security vulnerabilities and available fixes for Juniper Networks products and services.
The SIRT dashboard displays a summary report on the security vulnerabilities advisories published by the SIRT team for the Juniper Networks devices onboarded to the organization. Use the dashboard to view the list of devices to which the advisories apply, assess the impact and severity of the vulnerability, view recommended actions to mitigate the risk, and so on.
To access the SIRT dashboard from the Support Insights page, navigate to Organization > Support Insights > SIRT.
The advisories are available only for cloud-connected devices linked to your organization.
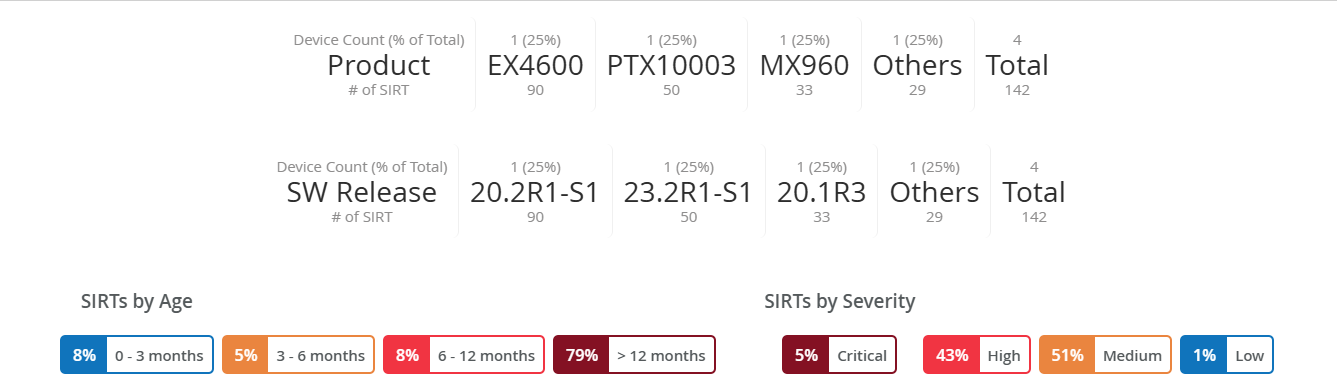
The SIRT insights panel provides you an overview of the security vulnerabilities impacting your organization's onboarded devices. This interactive panel helps you identify which devices are at risk, prioritize security patching, understand where the risk is concentrated, and take targeted action. Use the different filters to pivot the report and get focused insights into the vulnerabilities impacting your devices.
You can filter data based on the following parameters:
-
Product— Displays the device models in your inventory that are affected by security vulnerabilities. Helps you identify which device models are the most affected by vulnerabilities.
The row displays the top three device models with the highest number of SIRTs. Remaining models are grouped under Others. The Total column displays the overall count.
Entries are sorted in descending order based on the number of devices per model affected by security vulnerabilities. Each entry shows device count (in units and percentage of total) and number of associated SIRTs for each model.
Click a model to filter security vulnerabilities specific to that model.
-
SW Release—Displays the Junos OS release version running on the affected devices. Helps you track which OS version is running on the affected devices.
The row displays the top OS releases with the highest number of SIRTs. Remaining releases are grouped under Others. The Total column displays the overall count.
Entries are sorted in descending order based on the number of devices per release with associated security vulnerabilities. Each entry shows the device count (in units and percentage of total) and number of associated SIRTs.
Click any release to filter SIRTs advisories specific to that version of Junos OS.
-
SIRTs by Age—Displays the distribution of SIRTs based on their publication age. This helps you assess how long vulnerabilities have existed and whether older advisories are still impacting your devices.
Select a time range to filter the advisories published within that period.
-
SIRTs by Severity—Displays the percentage of security vulnerabilities impacting the devices grouped by severity: Critical, High, Medium, and Low. The percentage indicates how much of your inventory is affected by each severity level.
This helps you sort vulnerabilities by severity, identify what percentage of your inventory is impacted by vulnerabilities, and focus on remediating the most critical vulnerabilities.
Click a severity level to filter advisories based on that level.
For field description, see Table 1.
Click a SIRT advisory to view detailed information about the advisory in a side panel. From the panel, you can click View SIRT Details button to navigate to the security bulletin in the Juniper Support Portal.
Proactive Bug Notifications Dashboard
Juniper Networks notifies you about known software issues through Proactive Bug Notifications (PBNs). Each PBN includes information such as bug description, impact level, affected devices, and software releases in which the issue is resolved.
The PBN dashboard displays a summary report on the known software issues that impact Juniper Networks devices onboarded to the organization. Use the dashboard to view the list of devices impacted by the issue, severity rating assigned to the issue, its potential impact, possible fixes or workarounds to address the issue, and so on.
To access the PBN dashboard from the Support Insights page, navigate to Organization > Support Insights > PBN.
The report is available only for cloud-connected devices linked to your organization.
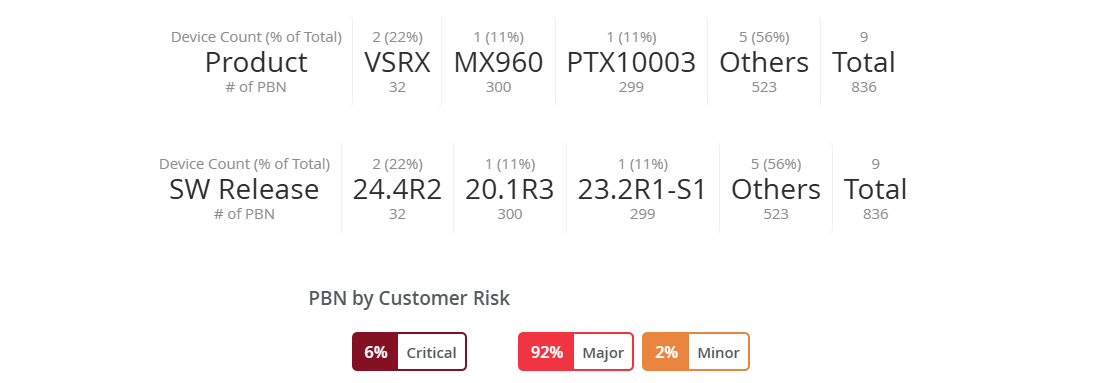
The PBN insights panel provides you an overview of the known issues impacting your organization's onboarded devices. This interactive panel helps you identify high-risk devices, understand the scope of impact, prioritize troubleshooting, and schedule maintenance and upgrades. Use the different filters to pivot the report and perform targeted investigation into the issues impacting your devices.
You can filter data based on the following parameters:
For field description, see Table 2.
-
Product—Displays the device models in your inventory most affected by known issues. Helps you identify which device models are the most affected by known issues.
The row displays the top three device models with the highest number of known issues. Remaining models are grouped under Others. The Total column displays the overall counts.
Entries are sorted in descending order based on the number of affected devices per model. Each model shows model’s device count (in units and percentage of total) and number of associated PBNs.
Click a model to filter known issues affecting that model.
-
SW Release—Displays the Junos OS release versions running on the affected devices. Helps you track which OS version is running on the affected devices.
The row displays the top OS releases with the highest number of known issues. Remaining models are grouped under Others. The Total column displays the overall counts across all releases.
Entries are sorted in descending order based on the number of affected devices per release. Each version shows the device count (in units and percentage of total) and the number of associated PBNs.
Click a release to filter known issues by that specific Junos OS version.
-
PBN by Customer Risk—Lists the percentage of known issues grouped by severity: Critical, Major, and Minor.
This helps you sort known issues by severity, identify what percentage of your inventory is impacted by the issues, and plan upgrades.
Click a severity level to filter PBNs based on that rating.
Click a PBN to view detailed information about the issue in a side panel.
Alarms Dashboard
Devices trigger alarms when an abnormal event prevents them from functioning optimally.
The Alarms dashboard provides detailed information on the alarms generated on the devices onboarded to the organization. The dashboard enables you to monitor alarms, their severity, and the root cause for the alarms.
To access the Alarms dashboard, navigate to Organization > Support Insights > Device Health > Alarms.
You can filter the data by device model and severity (major or minor) to quickly identify the most critical issues impacting your devices. This helps you prioritize remediation efforts, minimize downtime, and mitigate the impact of the issues on network performance.
You can filter data based on the following parameters:

-
The total number of devices grouped by device model.
For example, MX240-AC and MX240-DC is grouped under MX240.
Click a device model to filter data for that device model.
-
You can filter data based on alarm severity.
The options are:
-
Major—Indicates a critical condition on the device and requires immediate action to prevent further service disruption.
-
Minor—Indicates a non-critical condition on the device but requires monitoring or maintenance to prevent potential service disruption.
Click a severity-level to filter alarms based on the severity.
-
For field descriptions, see Table 3.
Tasks You Can Perform
You can perform the following tasks from this page:
-
Modify table settings—Click the column settings icon on the top-right corner to show, hide, and reorder the columns so that the table shows exactly the information that you want to see.

In the Table Settings window, you can:
-
Select or clear column checkboxes
-
Drag columns to reorder them
-
Use the search box to quickly locate a column
-
Use Select All or Deselect All as needed
-
Click Close to apply changes
-
-
Access the Installed Base inventory—Click Installed Base Inventory to navigate to the Installed Base page. From this page, you can onboard devices to cloud and view device-specific support insights, including security vulnerabilities and bug notifications.
-
Export details of all the devices in CSV format—To export details of all devices, on the respective tab, click Download CSV at the top-right corner. The details are exported to a CSV file that you can download to your local system.
Note:If you open the downloaded CSV file with Microsoft Excel on a Mac computer, any non-English characters in the file might appear as special characters. To prevent this issue, follow the steps below:
Open a new Excel file and then select File > Import > CSV File > Import.
Select the file to be opened and then click Get Data.
The Text Import Wizard window appears.
Select Unicode (UTF-8) as File Origin.
Click Finish.
-
Enter the keyword in the search box to filter data based on keyword.
Field Description
| Field | Description |
|---|---|
| JSA ID | Unique value that identifies the security advisory on Juniper Networks' Support Portal. |
| Title | Synopsis of the security advisory. |
| Affected Devices | Devices impacted by the security advisory. Click the hyperlink to view a brief description of the security advisory and details of the devices impacted by the security advisory. The details include device serial number, model, cloud-connected service level, hostname, and the Junos OS version installed on the device. |
| Severity | Severity rating of the security advisory. The values are:
|
| CVSS Score | Common Vulnerability Scoring System (CVSS) severity assessment score of the advisory in the range of 0-10. A score of 0 indicates low severity and a score of 10 indicates critical severity. |
| Affected Models | Device models impacted by the security advisory. |
| OS Versions Affected | Junos or Junos Evo versions impacted by the security advisory. |
| Release Date | Date on which the security advisory was first published. |
| JSA Updated Date | Date on which the security advisory was last updated. |
| Problem | Description of the security advisory. |
| Solution | Solution for the security vulnerability described in the advisory. |
| Workaround | Detailed explanation on how to temporarily resolve the problem. |
| Affected Series | Identifies one or more product series impacted by the security advisory. |
| Release Notes | Short description of the security advisory. |
| Field | Description |
|---|---|
| ID | Unique value that identifies the Problem Report. |
| Title | Synopsis of the problem. |
| Affected Devices | Devices impacted by the problem. Click the hyperlink to view a brief description of the problem and details of the devices impacted by the security advisory. The details include device serial number, model, cloud-connected service level, hostname, and the Junos OS version installed on the device |
| Customer Risk | Classification of the potential impact to the customer if the bug
is encountered in the network. The values include:
|
| Bug Type | Indicates the phase or activity during which the problem was discovered. Example: Day-1. |
| Trigger | Describes the events that happened before or at the time the problem occurred, or the event that caused the problem. |
| Introduced In | Junos OS or Junos OS Evo release in which the problem was first found and reported. |
| Fixed In | Junos OS or Junos OS Evo release in which the problem was resolved. |
| Release Notes | Short description of the problem. |
| Restoration | Indicates how the service can be restored when the problem
occurs. Values include:
|
| Restoration Steps | Steps to restore the service when the problem occurs. |
| Workaround | Detailed explanation of how to temporarily resolve the problem until a permanent resolution is available. |
| Workaround Provided | Indicates whether a workaround for the problem is provided or
not. Values include:
|
| Product Family | Identifies one or more products affected by the problem. |
| Field | Description |
|---|---|
| Serial Number |
Unique ID mapped to the device. |
| Model |
Device model. |
| Assured |
Service level to which the device is onboarded. Hover over the checkmark icon to view the states.
Note: The field appears blank for devices not
onboarded to the organization.
|
| Device Host Name |
Hostname of the device on which the alarm occurred. |
| Alarm Status |
Status of the issue that raised the alarm.
|
| Last Reported | Date when the alarm was last raised. |
| Alarm Time Local |
The local time at which the alarm was recorded. The time is adjusted to the local time zone of the system or the user viewing the report. |
| Class |
The severity level of the alarm. The options are:
|
| Description |
A short description of the issue that triggered the alarm. |