
Predictions Overview
This page describes how the Predictive Analytics feature notifies administrators of potential issues in the network using machine learning models to predict future behaviors and outliers.
Predictions Overview (Beta)
Predictive Analytics uses machine learning (ML) techniques to forecast possible outliers in resource utilization patterns or equipment failures. This feature helps the administrator to proactively address issues and prevent possible outages.
The Apstra Edge device receives data about the network devices through the configured probes on Apstra. The Edge device sends this data to Data Center Assurance where the ML models perform the following tasks:
-
Aggregate data points received from the network
-
Train the ML models using these data points and learn normal behavior to create a baseline
-
Forecast future data points by using trained ML models on historical data
-
Identify deviations in the forecasted data when the future data points exceed the configured thresholds.
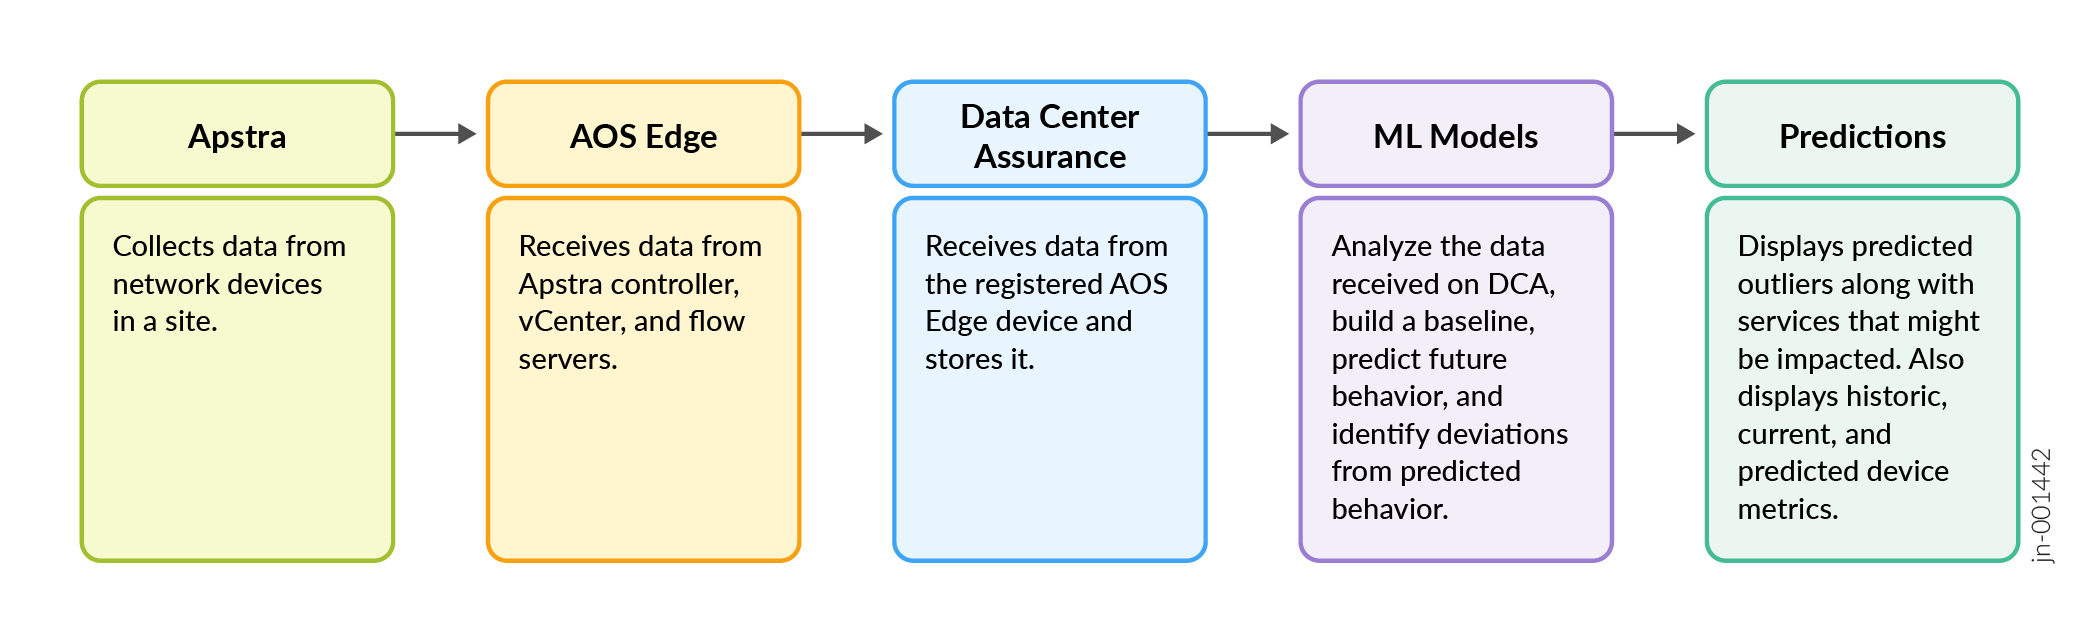
The Predictive Analytics feature identifies outliers in the following metrics:
-
System Health
-
Optical Interface Health
System Health
The Predictive Analytics feature identifies outliers in the system CPU and memory utilization metrics, and detects potential memory leaks. It uses the data collected by the Stream Receivers probe on Apstra to learn and forecast CPU and memory utilization metrics. When the feature identifies deviations in the predicted values, it raises system health outliers.
Furthermore, the data center network devices run hundreds of processes at a time. This can cause memory leaks in the routing engine of a device, leading to memory utilization outliers on the device. Predictive Analytics analyzes the historical memory utilization metrics of a device to identify potential memory leaks and the processes that might be causing the memory leaks.
This feature allows you to proactively identify issues in the network infrastructure and resolve them before they impact network traffic.
You can run the pre-flight check for the Edge device and verify whether the stream receivers are configured correctly. See Pre-Flight Checks for more information.
Predictive Analytics uses the following ML algorithms to predict System Health outliers:
|
Function |
Machine Learning Algorithm |
Description |
|---|---|---|
|
Forecasting |
Light Gradient Boost Machine (LGBM) |
An ensemble method based on decision trees that combines multiple weak models to produce a single strong prediction. Gradient boosting builds the model sequentially, with each model focusing on errors made by the previous one. |
Predictive Analytics uses ML algorithms to aggregate the data it receives from the network in hourly intervals and analyze the data points to predict network behavior. Once this feature has been enabled, it predicts values and outliers based on pre-trained ML models. The feature requires a certain amount of data points to train its model on the expected behavior of your network and to recognize outliers. The accuracy and the confidence level of the predictions improve over time as more data is available for analysis. Similarly, when a new device is added to the network and starts sending data, the Predictive Analytics feature begins predicting outliers after two days.
Predictive Analytics for system health uses a statistical approach to detect outliers in the forecasted data. It marks outliers based on two factors:
-
Outlier Detection based on Threshold
If the forecasted values of the system CPU and memory utilization metrics cross the configured thresholds for a specified duration, an outlier will be raised.
-
Outlier Detection by Trend
The Predictive Analytics feature collects memory utilization data aggregated in 15-min intervals for a device and executes the memory trend detection job every hour. This job calculates the EWMA (Exponentially Weighted Moving Average) for the device using the latest eight data points in order to establish a slope threshold. Using the slope threshold, the feature determines if the device baseline is shifting and showing a clear upward trend. If a device shows an initial uptrend, the system starts to collect the per-process memory utilization metrics for the routing engine of the device. Any process that exhibits an uptrend in memory utilization is flagged as potentially leaking memory. An outlier by trend is raised on the device and the outlier details card lists the processes that are potentially leaking memory.
Note:The bubble chart displays outliers raised on predicted data. Since a memory leak outlier is raised on historical data, this specific outlier is not displayed on the bubble chart. However, a memory leak on a device eventually results in a Memory Utilization outlier by threshold being raised on a predicted value for that device. You can select a Memory Utilization outlier on the bubble chart and view system health details for the device. The memory leak outlier is highlighted on the historical data on the graph. Hover over the outlier to view the list of processes and other details.
Optical Interface Health
-
Predictive Analytics for Optical Interface Health is a technology preview feature. For more information about technology previews, see HPE Networking Apstra Data Center Director Tech Previews in the Data Center Director User Guide.
-
Predictive Analytics for Optical Interface Health requires your Data Center Director instance to be running version 6.1 or higher.
-
Predictions for Optical Interface Health based on BER, FEC, and CRC metrics is possible only for devices running the following Junos OS Evolved releases: 23.4X100-D31, 25.2X100-D10, or 25.4R1.
Pre-FEC BER is supported only on QFX Series Switches running the above Junos OS Evolved releases.
FEC Histogram is supported only on the QFX5230 and QFX5240 switches.
Optical cables offer lower latency and better energy efficiency over long distances, which is crucial for maintaining performance across large-scale clusters. Optical interfaces are the ports that link the optical cables to devices for data transmission. An optical interface consists of multiple optical lanes that act as independent data transmission channels. Each lane carries a portion of the total data stream, and multiple lanes are aggregated to achieve higher overall bandwidth.
Identifying potential issues in the optical interfaces or lanes early enables network administrators to take corrective actions in advance, thereby preventing link outages and ensuring continuous network reliability.
The Predictive Analytics feature identifies outliers in the optical interfaces and lanes in the network. It uses the following data from Data Center Director to forecast optical health metrics and identify deviations from expected behavior:
-
Digital Optical Monitoring (DOM) metrics data collected by the Optical Transceivers probe.
-
Bit Error Rate (BER), Forward Error Correction (FEC), and Cyclic Redundancy Check (CRC) metrics data collected by a custom probe added in the DC-Probes analytics pack in DC Hub.
To ensure that the Predictive Analytics feature can learn expected behavior and predict optical link health metrics, you can perform a pre-flight check on the required blueprint. The pre-flight check runs the Optical Assurance Probe test on the blueprint and verifies the following:
-
whether your Data Center Director instance is running version 6.1 or higher.
-
whether the Optical Transceivers and DC BER Interface Counters probes have been instantiated and have streaming enabled on Data Center Director.
You must import the DC-Probes pack from DC Hub onto the site or blueprint. This configures both the Optical Transceivers and the DC BER Interface Counters probes on Data Center Director. For information on pack installation, see DC Hub Overview.
See Pre-Flight Checks for information on how to perform a pre-flight check.
Predictive Analytics uses the following ML algorithm to predict Optical Interface Health outliers:
| Function | Machine Learning Algorithm | Description |
|---|---|---|
|
Forecasting |
Multivariate Bidirectional Long Short-Term Memory (BiLSTM) |
Bidirectional LSTM is a method that processes the input sequence in forward and backward direction, allowing the model to capture both past and future context of the input sequence. Multivariate BiLSTM processes and analyses data containing multiple related parameters simultaneously. |
The Predictive Analytics feature uses DOM, BER, FEC, and CRC metrics data to predict optical metric trends and flag outliers indicative of link degradation.
Table 3 lists the DOM metrics and the signs that indicate degrading optical link.
Table 4 lists the BER, FEC, and CRC metrics and the signs that indicate degrading optical link.
|
DOM Metrics |
Description |
Indicators of Link Degradation |
|---|---|---|
|
Received optical power (Rx power) |
Received optical power |
Decreasing values |
|
Transmitted optical power (Tx power) |
Output optical power |
Decreasing erratic values |
|
Laser bias current |
Magnitude of the laser bias power setting current |
Increasing or erratic values |
|
Voltage |
Voltage of the physical port |
Fluctuating or out of range values |
|
Temperature |
Temperature of the physical port |
Increasing values or erratic spikes |
|
BER, FEC, and CRC Metrics |
Description |
Indicators of Link Degradation |
|---|---|---|
|
FEC Corrected Codeword Rate |
Number of errors corrected by FEC per second |
Increasing values |
|
FEC Uncorrected Codeword Rate |
Number of errors that remained uncorrected by FEC per second |
Increasing values |
|
Pre-FEC BER |
BER before FEC mechanism is applied |
Increasing values |
|
Rx CRC Errors Rate |
Aggregated rate of increase in received CRC errors |
Increasing values |
|
Tx CRC Errors Rate |
Aggregated rate of increase in transmitted CRC errors |
Increasing values |
|
FEC Histogram |
Codeword percentage in each FEC histogram bins |
Increasing values in the higher-error bins |
Predictive Analytics for optical link health uses a statistical approach to detect outliers in the forecasted data. It marks outliers based on two factors:
-
Outlier Detection by Trend
If the forecasted values of the RX power show a downward trend, the bias current and temperature show an upward trend for a specified number of consecutive days, an outlier will be raised.
-
Outlier Detection based on Threshold
If the forecasted values of the optical health parameters cross the configured high alarm or moderate alarm thresholds for a specified duration, an outlier will be raised.
Note:Thresholds for the DOM metrics are received from the probe and configured based on the vendors of the optical transceivers and part number. The thresholds cannot be modified by a user.
View Predicted Impacts
To view the predictive outliers in the network, navigate to Assurance > Predictions. Use the site drop-down to select a specific site. You can also click the System Health or Optical Outliers cards to view outliers of the selected type.
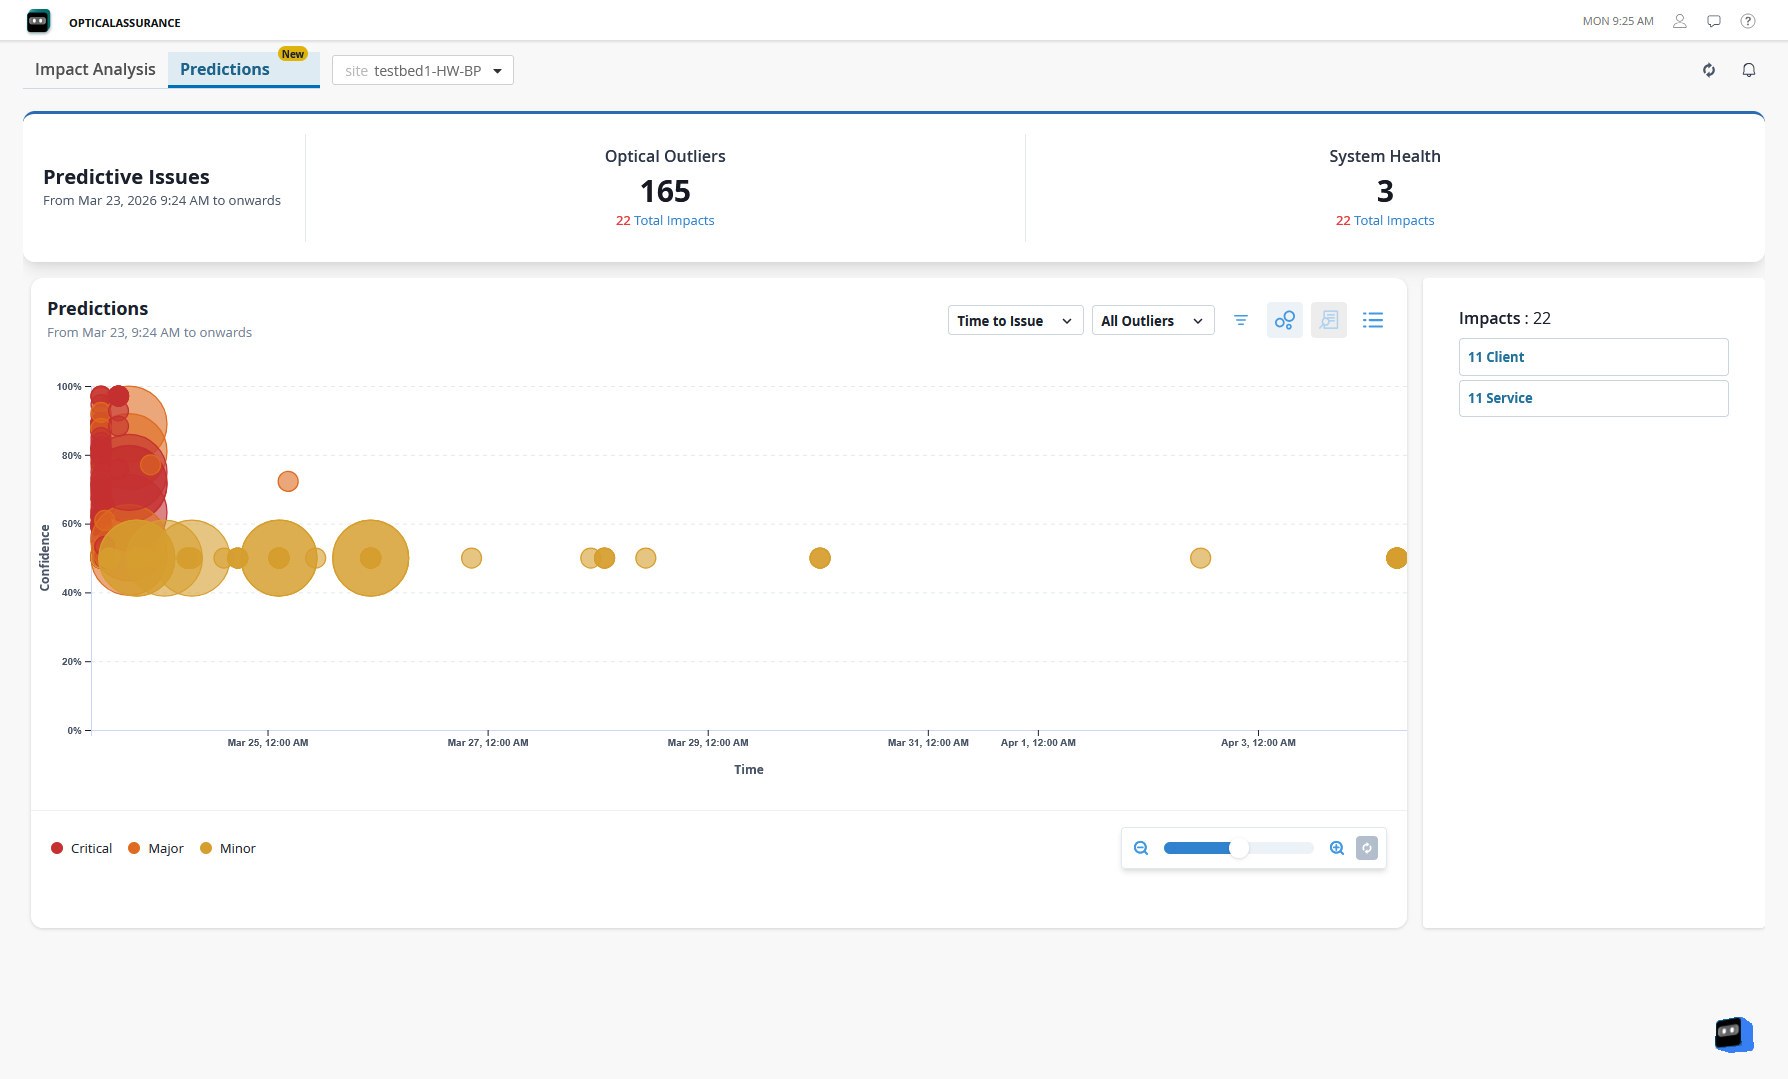
The Predictions tab displays a bubble chart of outliers mapped by expected time when the issue might occur and the confidence level. Each bubble represents an outlier predicted on a device within the network. The size of a bubble indicates the number of services impacted by that specific outlier. The color of the bubble indicates the severity level of the predicted outlier determined based on whether the forecasted value exceeds the system-defined thresholds. If the forecasted value exceeds the moderate threshold, an outlier with major severity level is raised. If the forecasted value exceeds the alarm threshold, an outlier with critical severity level is raised. The confidence level displays the reliability of the predictions in percentage. Select any bubble to view a summary of the predicted outlier. Click a bubble to view a summary card with information about the selected outlier.
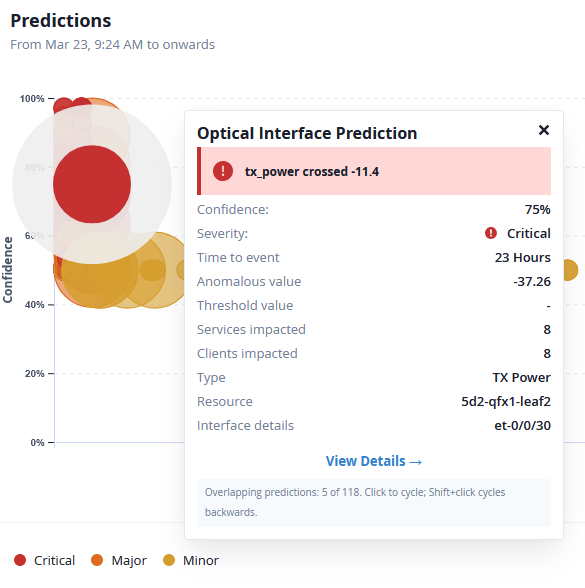
A single node in the network topology might have multiple predicted outliers displayed as overlapping bubbles. Different nodes in the network topology might also have multiple predicted outliers with similar confidence or severity levels displayed as overlapping bubbles. The summary card displays the total number of outliers overlapping the selected bubble. Click the bubble or the summary card to cycle through all the overlapping outliers.
You can also select the list icon on the top right of the Predictions section to view the predicted outliers in a list as shown in Figure 4. List View displays the predicted outliers in a table, along with details of the affected device, the confidence and severity levels of the outlier, and the predicted time when the event might occur.
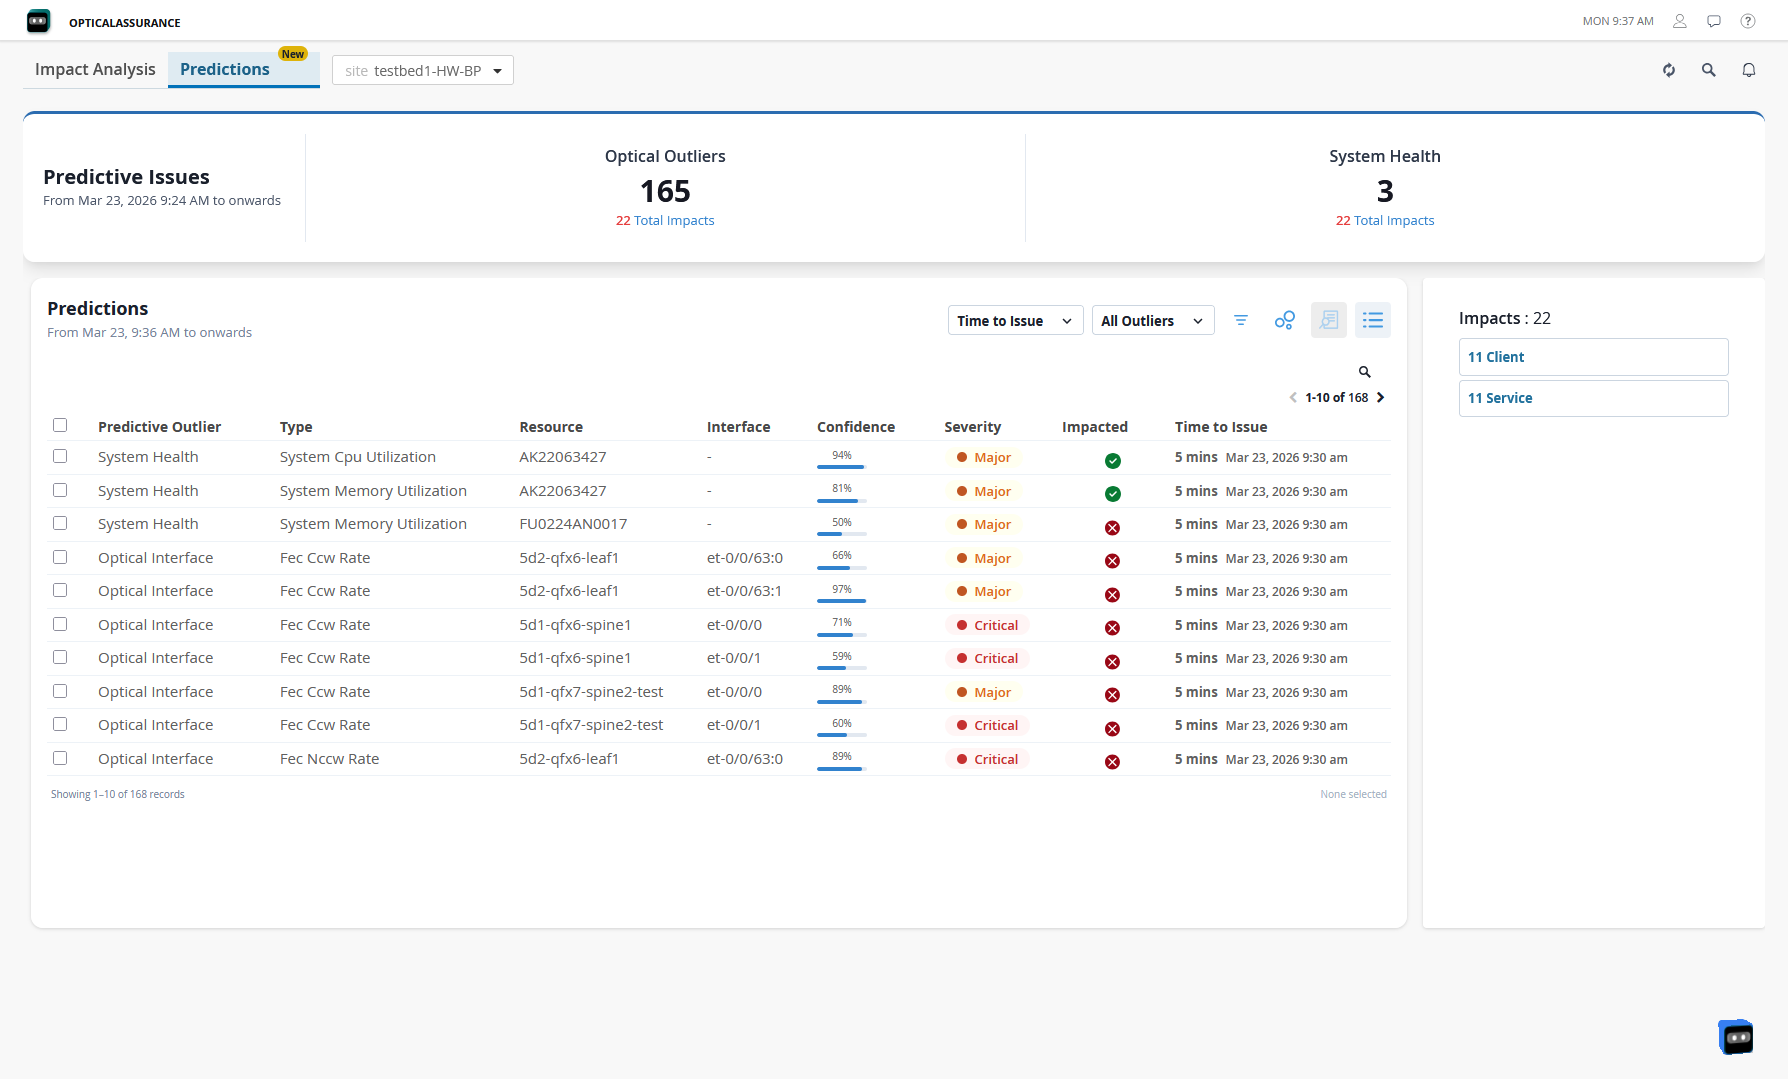
The Predictive Analytics feature forecasts system health and optical interface health outliers that might occur in a 30-day period.
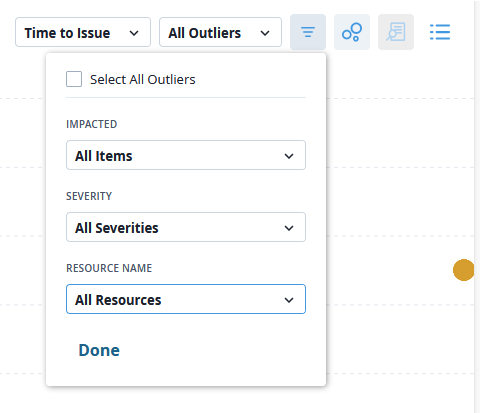
Use the drop-down options on the top right of the Predictions section to filter by the expected time when the issue might occur or by specific outlier types. You can also use the Filter option to display predicted outliers based on whether services or clients are impacted, severity level of the outliers, or outliers predicted on specific devices in the network.
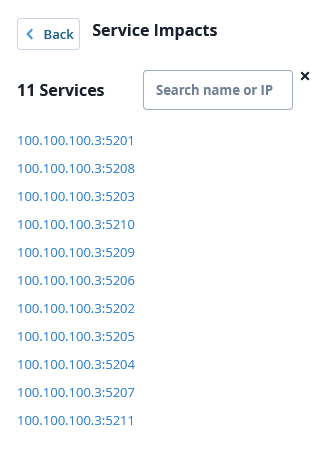
The right pane displays the number of impacted clients and services in the selected site. You can click the clients and services button to view and search from the full list of impacted clients.
If no predictive outliers are displayed, it could be because of the following reasons:
-
The network devices and optical links are behaving as expected.
-
The Predictive Analytics feature is newly configured and not enough data is available yet to make reliable predictions.
-
The streaming receivers and optical transceiver probes are not sending data from the Edge device to Data Center Assurance. In this case, verify whether the probes are configured correctly and that streaming is enabled on these probes on Apstra.
If the list of impacted clients and services for a predicted outlier is not displayed, it could be because:
-
No traffic is flowing through the affected devices in the network.
-
Data Center Assurance is not receiving traffic information from the Edge device. In this case, run the pre-flight check for the Edge device and verify if the flow servers are configured correctly. See Pre-Flight Checks for more information.
To view detailed information about an outlier,
Select a bubble from the bubble chart or an outlier from the Predictions list.
Click View Details from the summary card or select the View Details icon from the top right of the Predictions section.
The Device Details page opens with detailed metrics for the selected device.
View Device Details and Service Topology
On the Device Details page, graphs for the monitored parameters are displayed with predicted values for the selected device, along with a prediction band for each parameter. The prediction band indicates the range of values within which a future observation is likely to fall based on the confidence level of the forecasting method. A narrow prediction band indicates greater precision and confidence in the forecast. A wide prediction band indicates uncertainty and variability in the forecast.
An alert with all the outliers predicted for the selected resource is displayed at the top of the page along with the expected time of occurrence for each outlier.
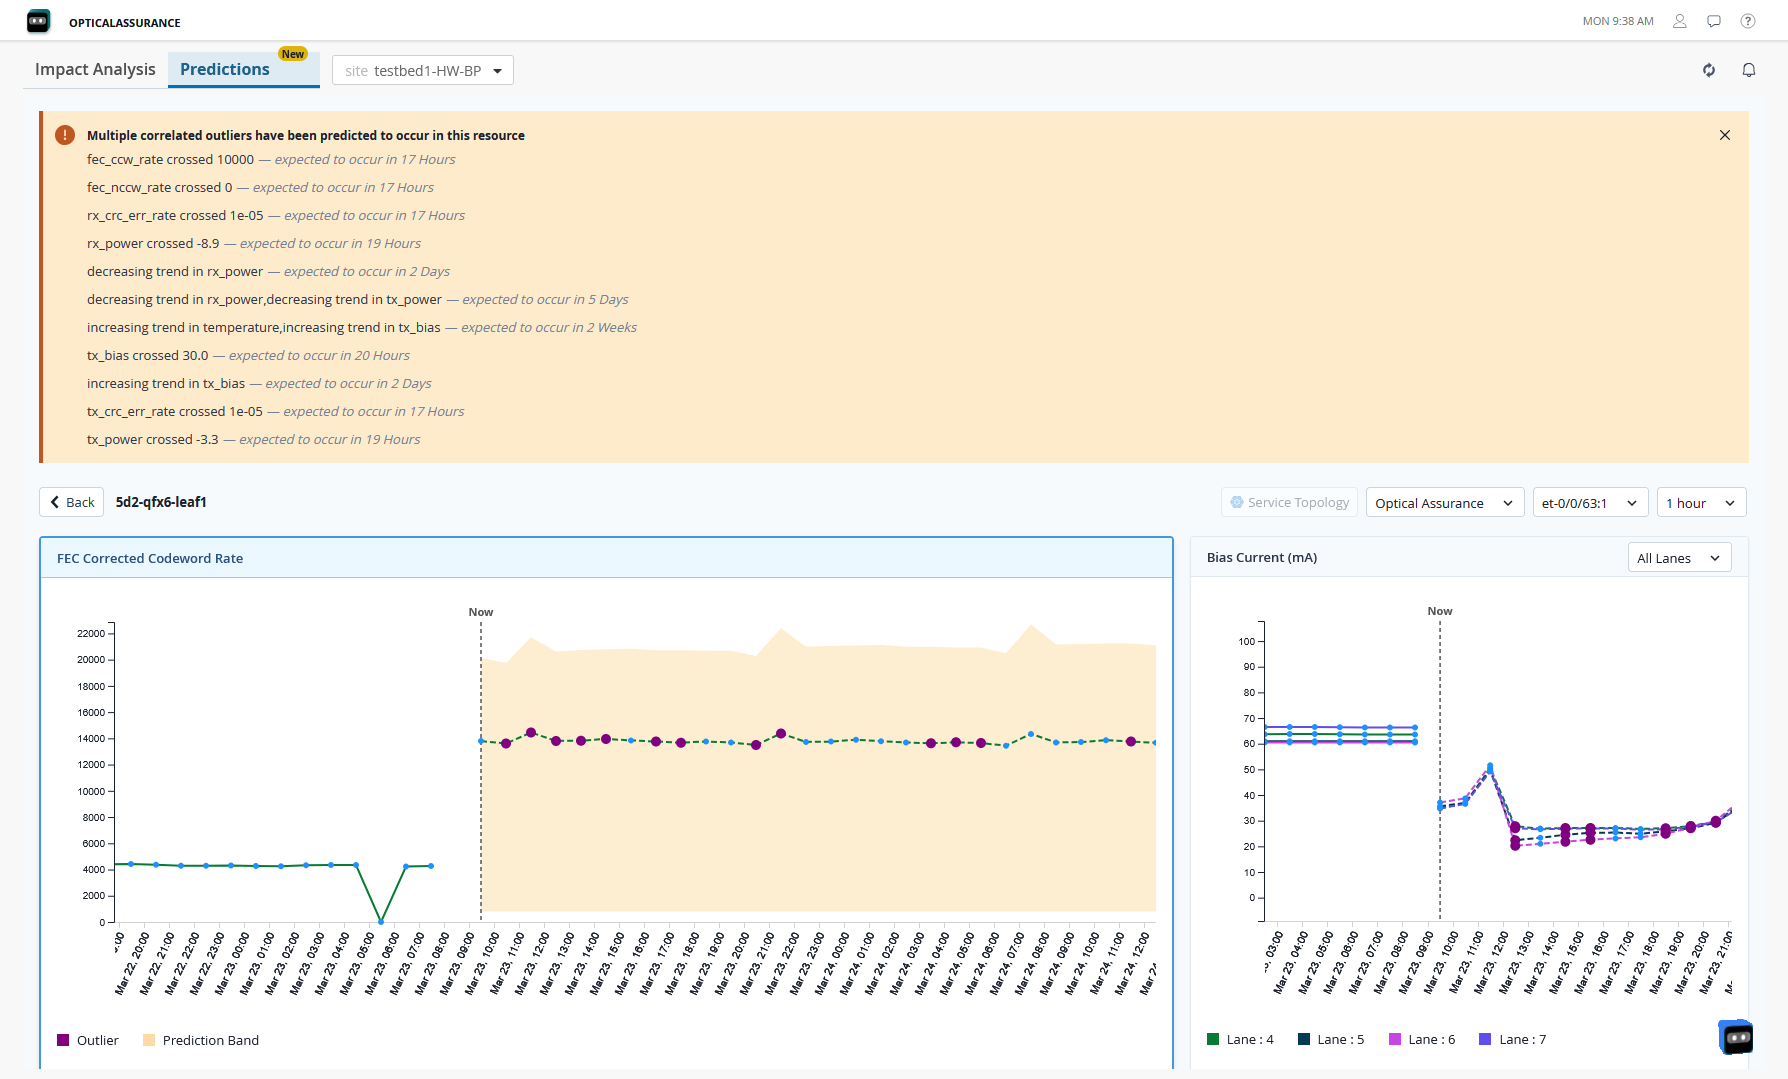
Select the outlier category from the drop-down options on the top right to modify the displayed graphs as per your requirements.
-
For System Health, the graph displays the historical, current, and predicted CPU and memory usage data for the selected device.
-
For Optical Interface Health, select the optical interface from the drop-down and the page displays graphs with historical, current, and predicted values for all the optical interface health parameters for the selected device.
You can also choose the time interval for the data to be aggregated and displayed in the graphs from the drop-down options. For both System Health and Optical Interface Health, you can have the graph display data aggregated in 1-hour, 12-hour, or 1-day intervals.
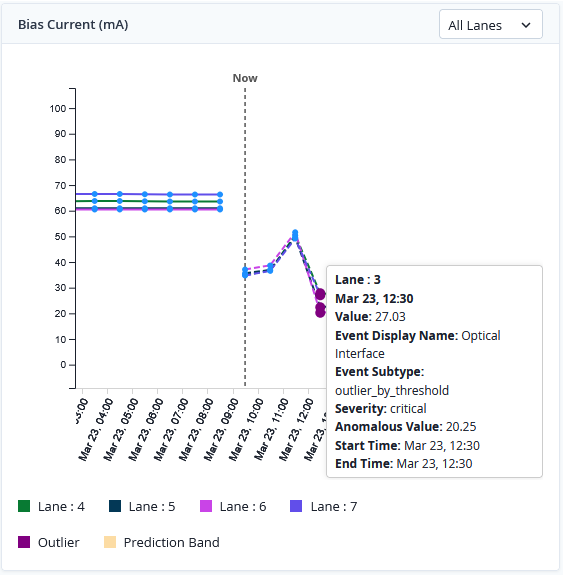
If an outlier is detected in the predicted data points, it is highlighted in purple on the graph. Hover over the outlier to view details such as the type of outlier, the severity, the predicted start and end time of the outlier, and so on.
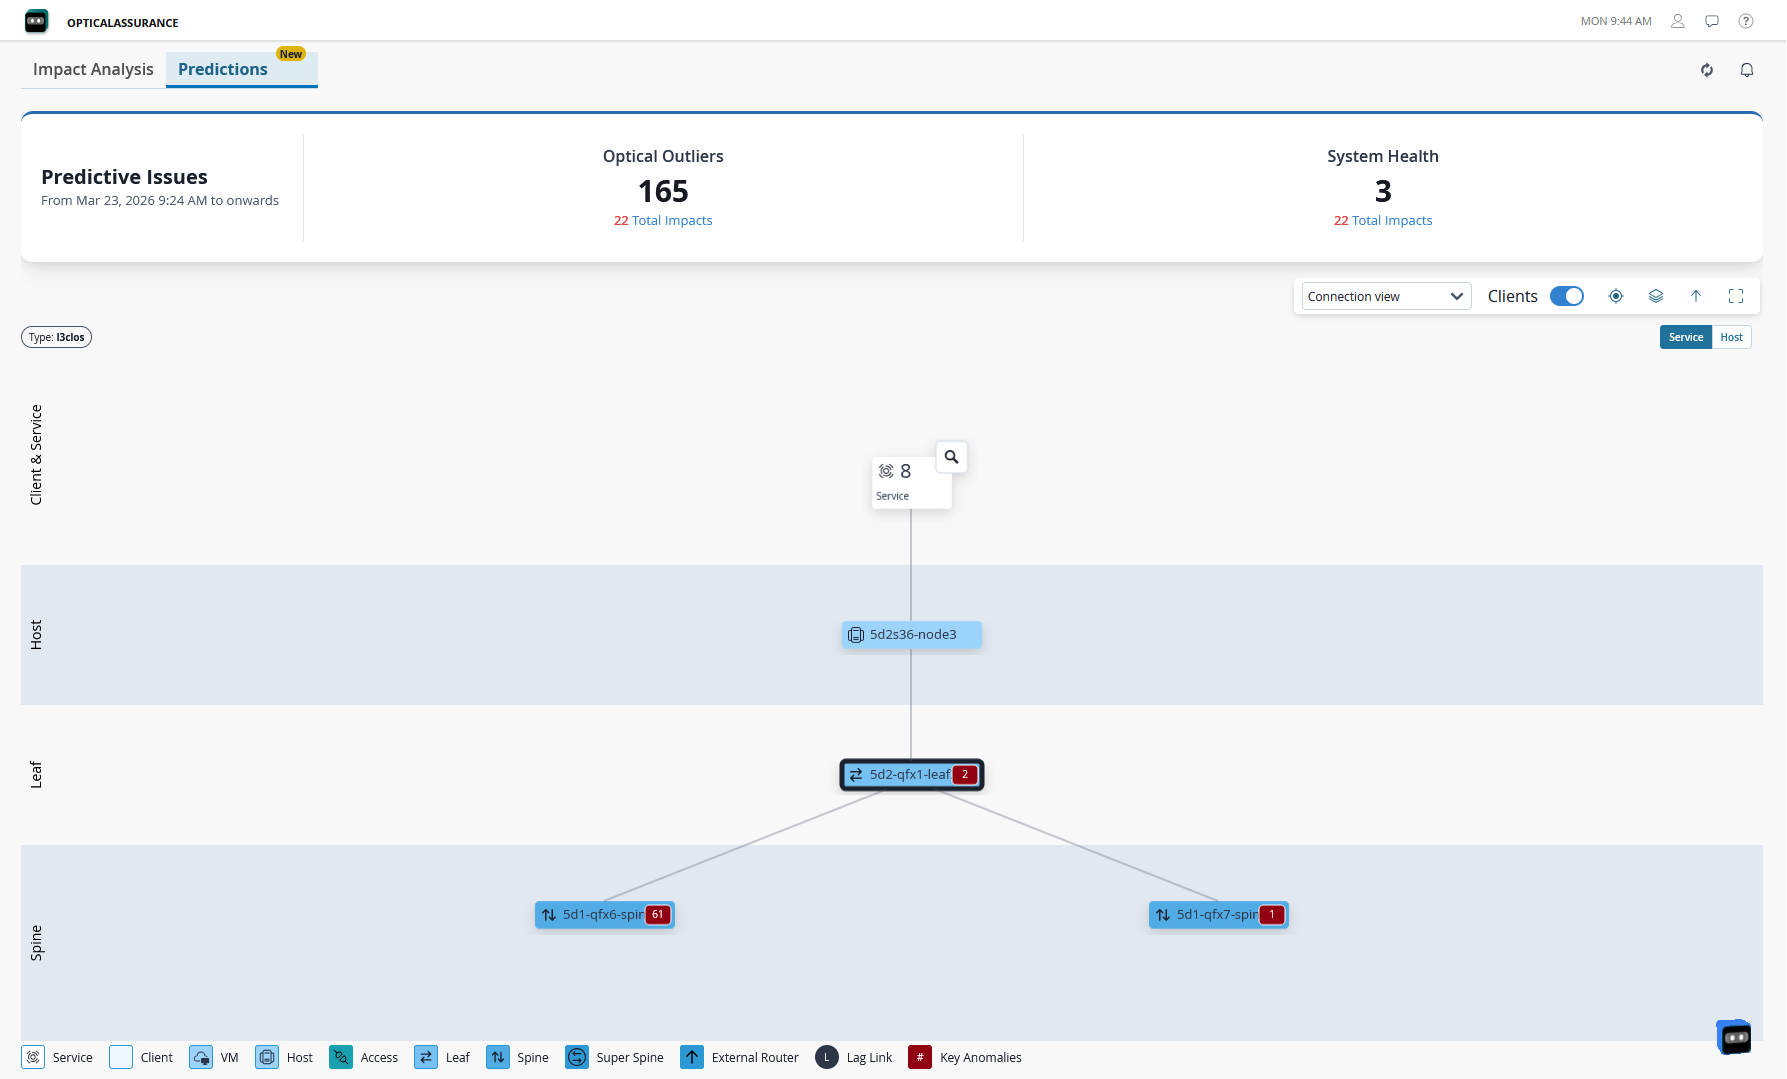
If the predicted outlier on the selected device is expected to have an impact on services and clients, the Service Topology option is enabled. Click Service Topology to view the network topology and traffic flow along with the impacted services and clients.
Benefits of Predictions
The Predictive Analytics feature provides the following benefits:
-
Provides an early warning to administrators about possible failures.
-
Helps understand the impact of predicted outliers.
-
Enables administrators to proactively prevent potential outages.