Centralized Logging
Juniper Networks supports centralized logging using Cloud-Native Contrail® Networking™ Release 22.1 or later in a Kubernetes-orchestrated environment.
Benefits of Centralized Logging
-
The centralization of all platform logs eases troubleshooting. Allowing you (the administrator) to take a holistic view of events, or outages, across the many components within the deployment.
-
You have one portal, allowing you to monitor, view, filter, and search for events across all platform components.
Overview: Centralized Logging
Instead of browsing through individual log files, logs from all components of Contrail Networking are collected and available to the administrator in a centralized location. The centralized location provides the ability to correlate the log files from multiple software components. For security, there is strict logging of all create, read, update, and delete (CRUD) actions. These actions are performed by any administrator with individual access credentials so individuals can be identified.
AWS OpenSearch Stack, an open source log collector and analyzer framework, provides out-of-box log collection and analysis functionality. The OpenSearch stack allows a single portal for analyzing logs not only from Contrail Networking; but also logs from other software components and platforms that are deployed in their cluster. Examples include Linux OS logs, Kubernetes logs, and software components such as virtualized network functions (VNFs) and container network functions (CNFs).
OpenSearch Stack includes:
- OpenSearch—Real-time and scalable search engine which allows for full-text and structured search, as well as analytics. This search engine indexes and searches through large volumes of log data.
- OpenSearch Dashboard—Allows you to explore your OpenSearch log data through a web interface, and build dashboards and queries.
- Fluentd—Logging agent that performs log collection, parsing, and distribution to other services such as OpenSearch.
- Fluent Bit—Log processor and forwarder that collects data, such as metrics and logs from different sources. High throughput with low CPU and memory usage. Fluent Bit is installed in every workload cluster.
The logging components are included and deployed in the optional telemetry node deployment. Installation commands are integrated in the telemetry installation.
Logs, Events, and Flows with Fluentd
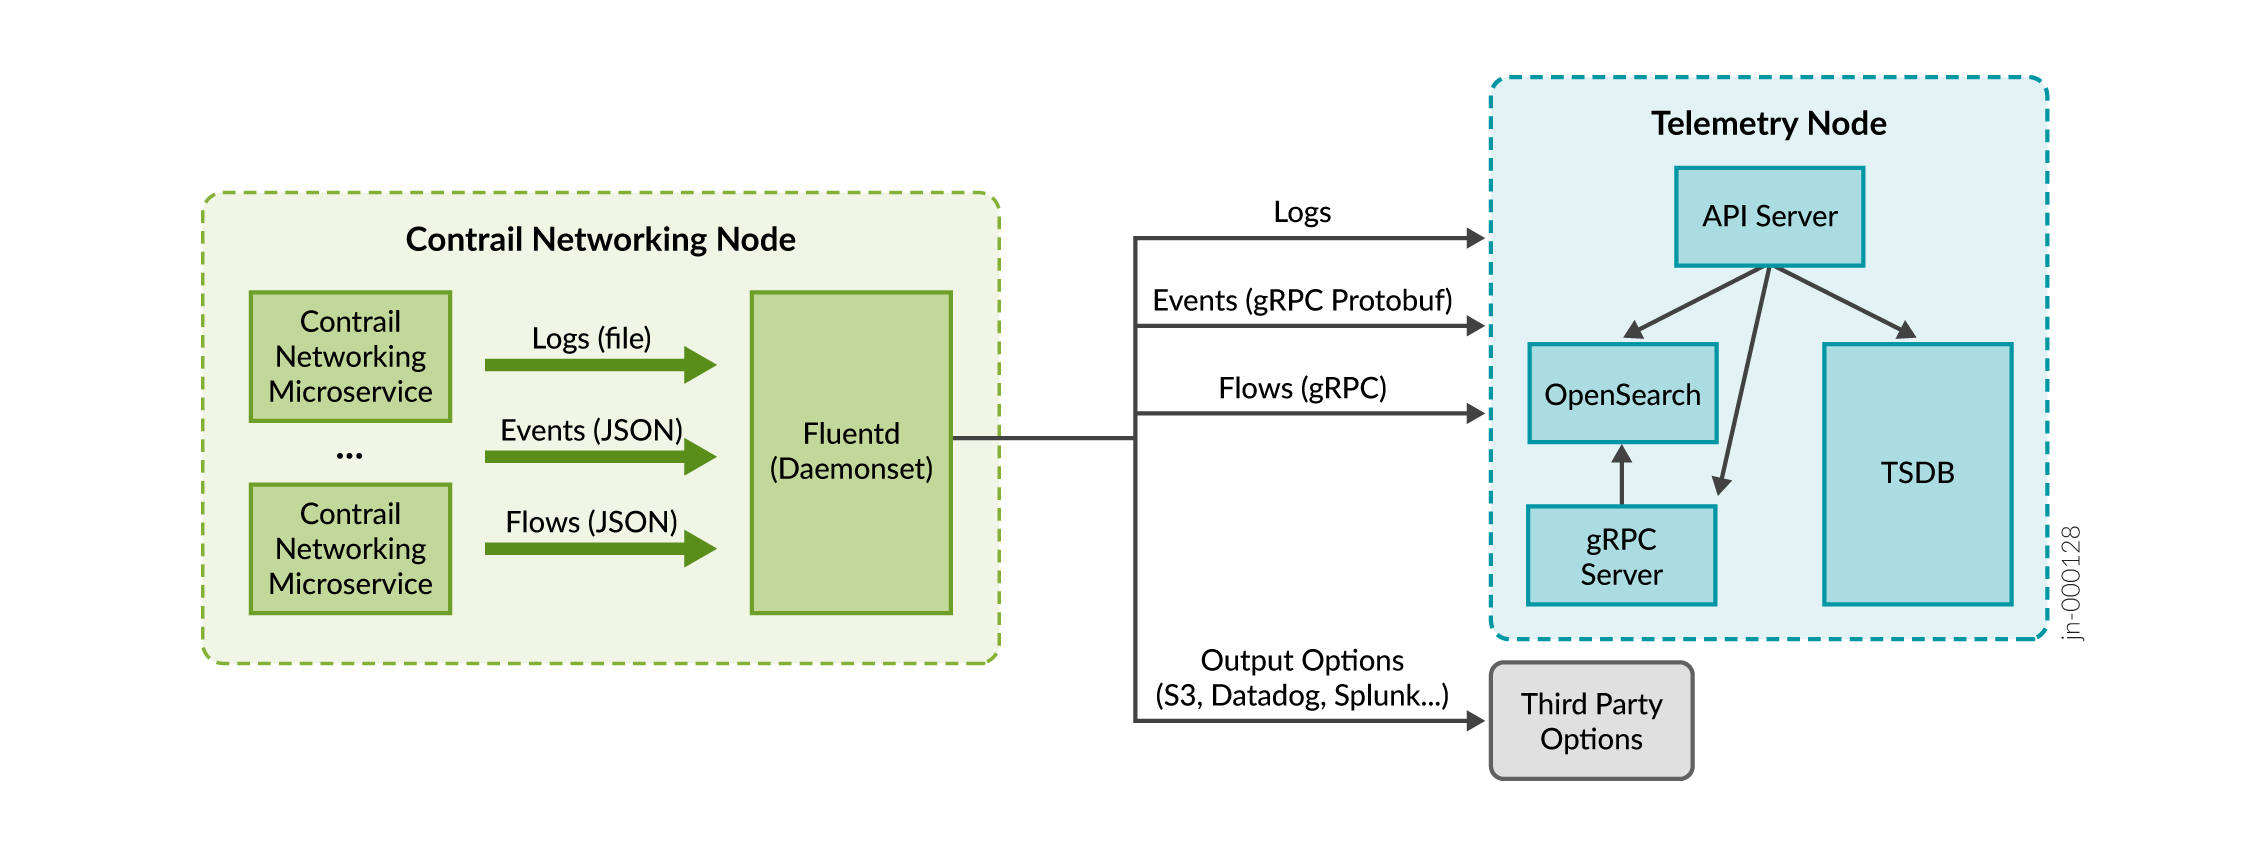
Logs, events, and flows are collected using Fluentd running on each Contrail Networking node. Fluentd is the logging agent that performs log collection, parsing, and distribution to other services such as OpenSearch.

Logs
Logs are collected from log files or stdout/stderr data
streams and directed to the OpenSearch library stack with cluster quorum. Each Contrail
Networking node (configuration, control, compute, Web UI, and telemetry node) runs Fluent
Bit or Fluentd to collect logs. The logs are sent to multiple configured sinks, such as
OpenSearch. Fluentd supports multiple output options to send collected logs.
- Control and compute nodes generate unstructured and structured logs through the Sandesh library. The Contrail Networking Sandesh library generates structured JSON files.
- Config, Web UI, and telemetry node components produce standard logs to files or to
stdout/stderr, that are then sent to Fluentd or Fluent Bit.
Multiple Kubernetes clusters in any Contrail Networking cluster or in multiple Contrail Networking clusters will be able to connect with a Fluentd/OpenSearch monitoring component.
Events
vRouter agent and control node produce events through Sandesh. The Sandesh library
produces JSON structured data and sends those files to the configured options. Configured
options are stdout, file, or TCP port (Fluentd). Fluentd is configured
with multiple output options to send data either to OpenSearch or to the telemetry node’s
gRPC server. The telemetry node keeps cache for the latest status events.
Flows
The vRouter agent produces flow meta at regular configured intervals. Configuration options for flow data generation supported by the vRouter agent are syslogs, JSON structure, and the default Sandesh.
