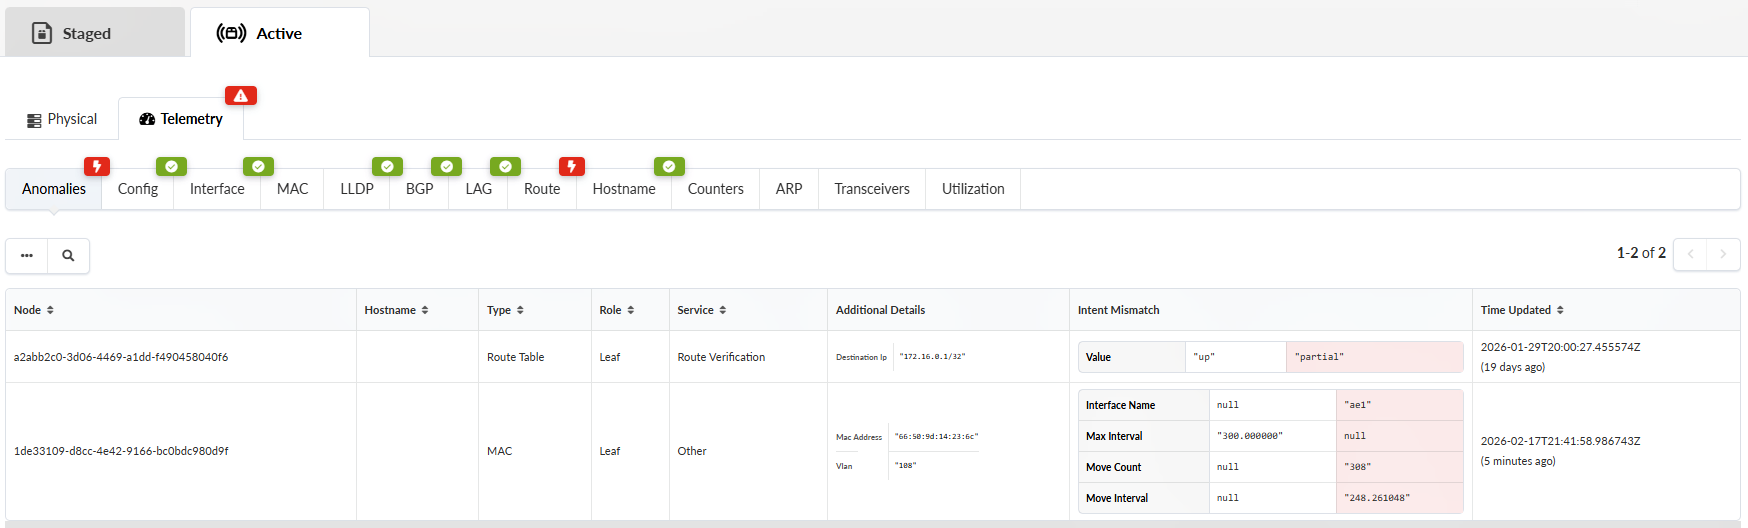
Anomalies (Blueprint)
Use advanced sorting and filtering to process and organize service and IBA anomaly data.
Use the anomalies page to identify problems in your managed networks. Anomalies are detected and managed within the context of a blueprint. The blueprint serves as the central representation of the intended network design and state.
Agents ingest data that devices generate. With the use of probes, data is aggregated across devices in response to operator configuration. Combining probes with intent from the blueprint graph generates a focused set of data. An anomaly is raised when an observed value deviates from its expected intent. Determining where and why an anomaly occurred is important for identifying the required corrective action.
Viewing Blueprint Anomalies
To go to Anomalies in the blueprint:
Select a blueprint and navigate to Anomalies > Current State within the blueprint.
Use the Current State page to search for anomalies:
-
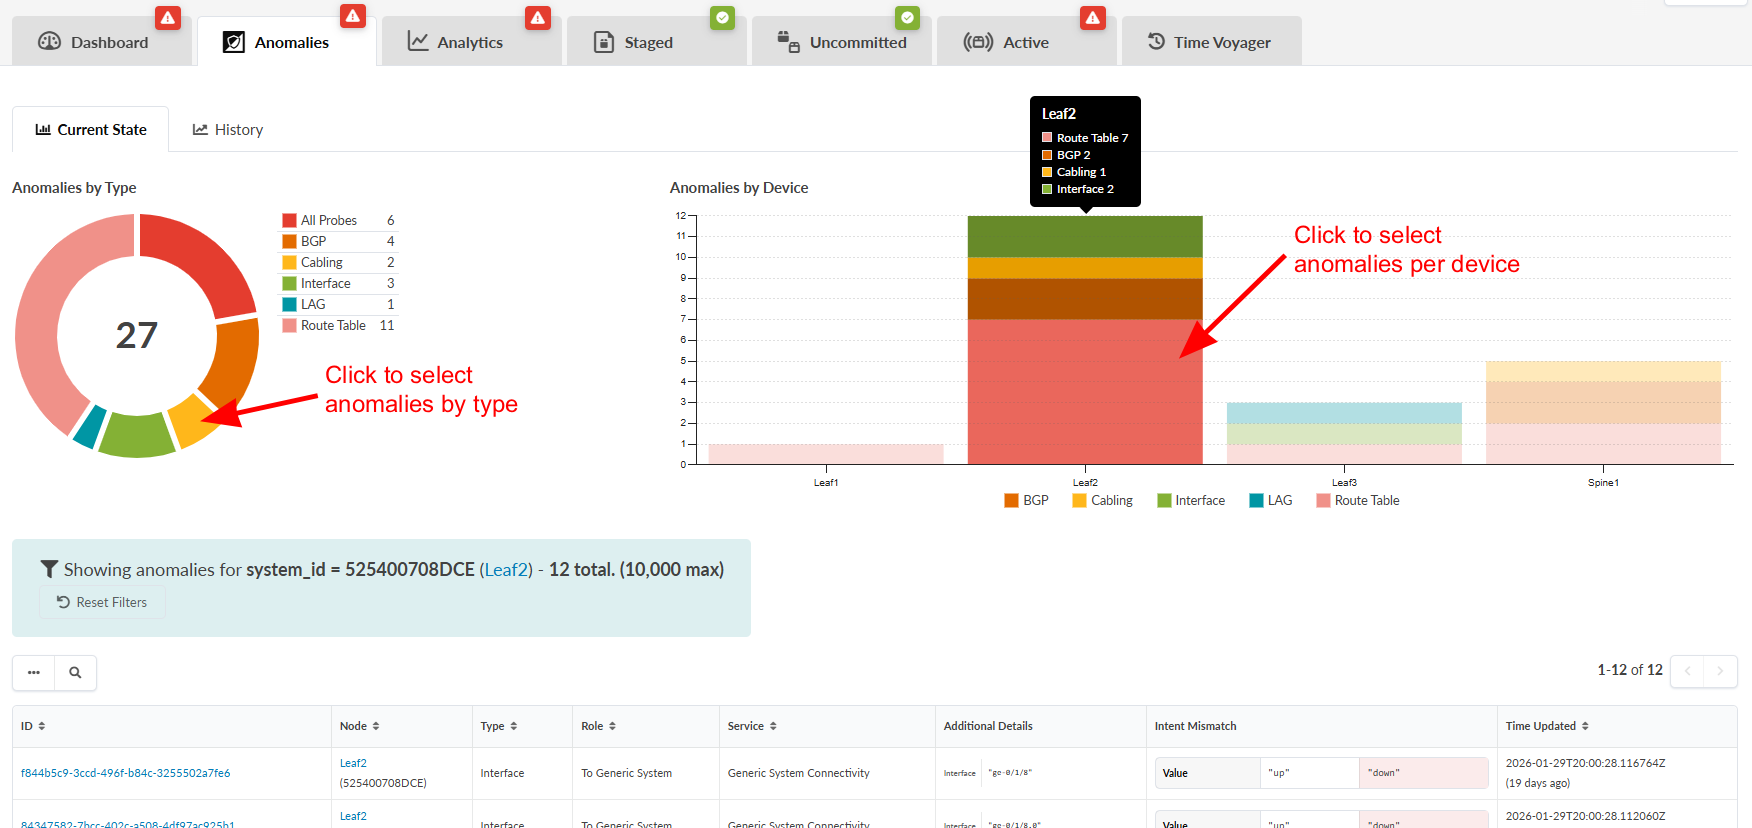
Select an anomaly type from the Anomalies by Type graphic wheel.
-
Select a device with anomalies from the Anomalies by Device graph.
Understanding Anomaly Types
Main anomaly types include:
-
Configuration Deviation Anomalies: These occur when a device's running configuration differs from the Golden Config.
-
Discovery Anomalies: Include issues like cabling mismatches (e.g., IP fabric cabling or LLDP discrepancies).
-
Device Telemetry Anomalies: Generated by telemetry services that collect and compare data against expectations.
Service-based anomalies are deviations or issues detected in your managed networks. They're identified by comparing actual device states with expected configurations and telemetry data from the design intent of the blueprint.
All Probes represents all instantiated predefined and user-defined probes from the Analytics > Probes tab. All Probes displays the total number of probes with anomalies. Click All Probes on the graphic wheel to populate the table with probe and anomaly details.
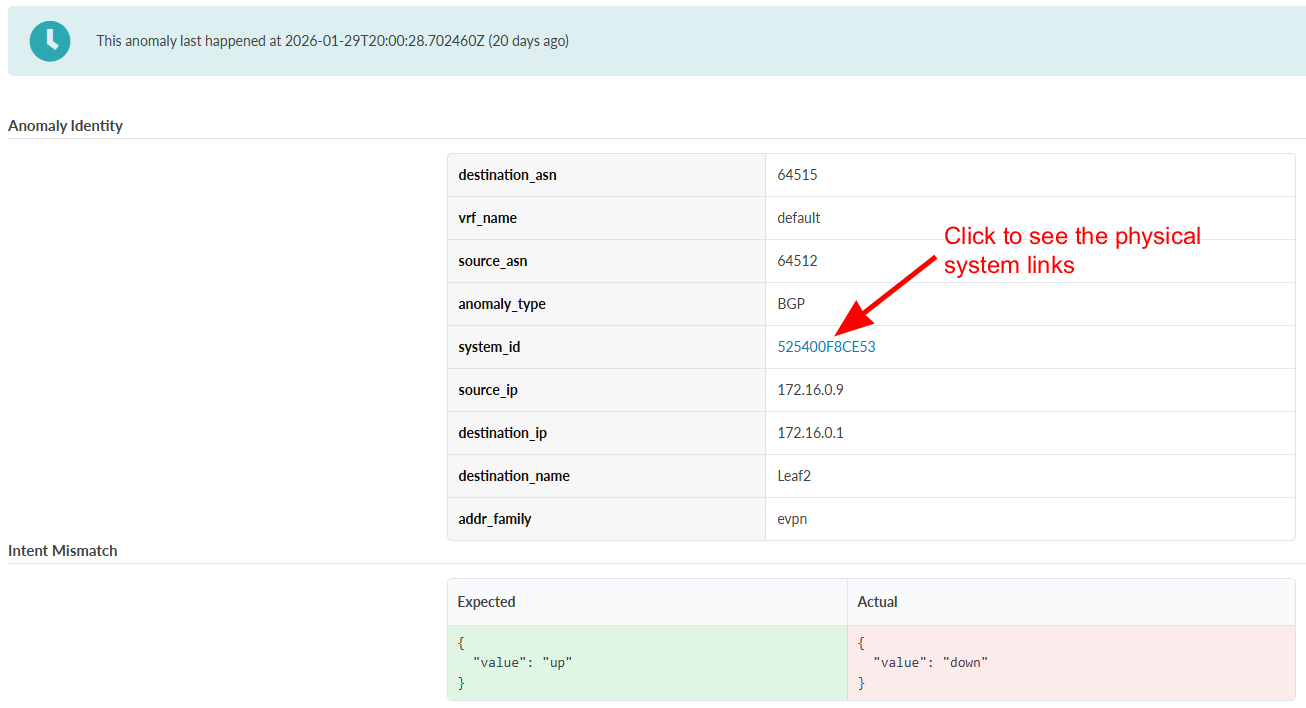
The anomalies table includes Intent Mismatch. This is a helpful troubleshooting data point for understanding why the anomaly was detected. Knowing the deviation from intent is important for determining the corrective action required. Use the column to see the value, intent, and what was observed as the actual value, shaded in red.
Filter Anomaly Results
Use the anomalies table for a detailed view of anomalies and related data. The table displays all anomalies by default. Click an anomaly type or device to populate the table with the relevant anomaly information. Click the Current State tab to return to the default view. Alternatively, you can click the Reset Filters button in the "Showing anomalies..." filter information box.
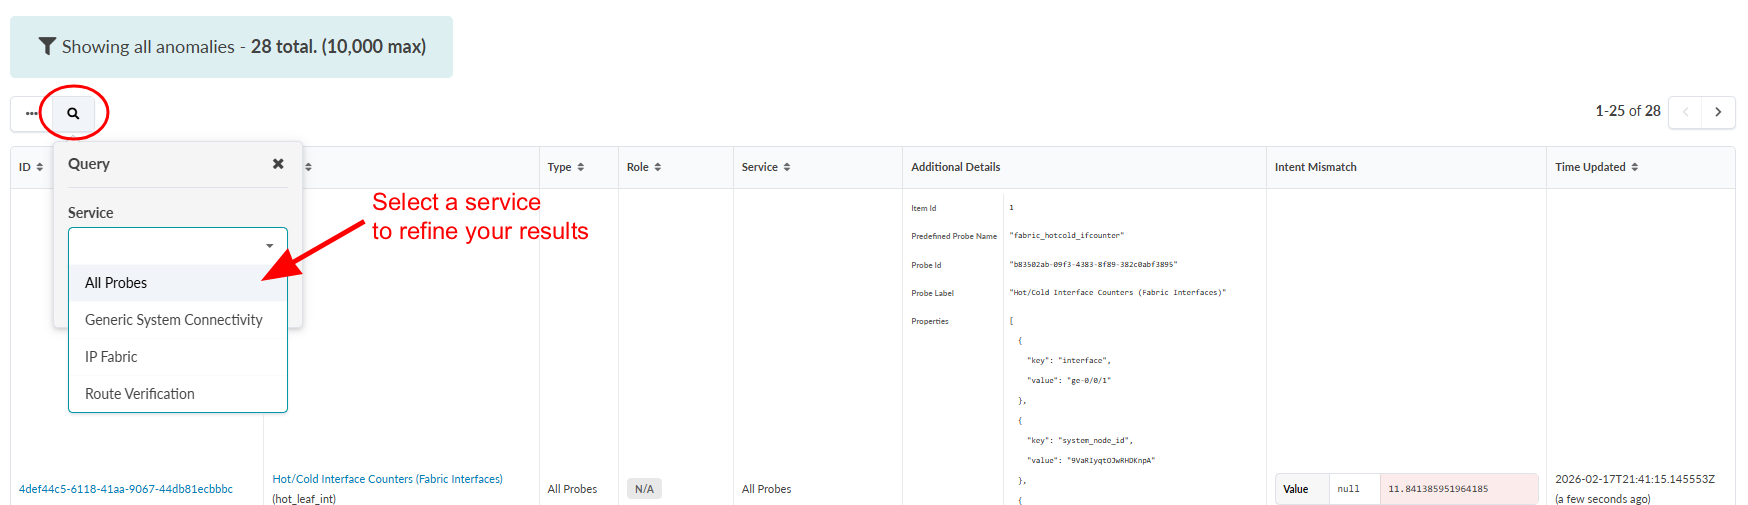
Further filter the results by selecting a service type from the search query above the table. Available query options are based on the anomaly type or device you've selected. The full list of services is available when the table is in the default view.
Anomaly Details by ID
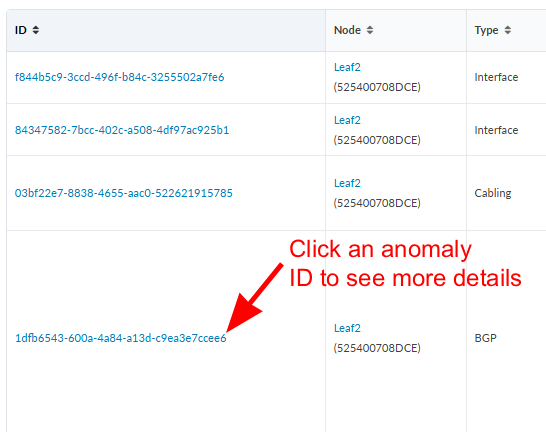
From the anomalies table ID column:
Click an anomaly ID to view additional details for the selected anomaly.
From the additional details page for a device, click on the system_id to navigate to the physical links page. If an interface is available, click the interface to navigate to the physical interfaces page.
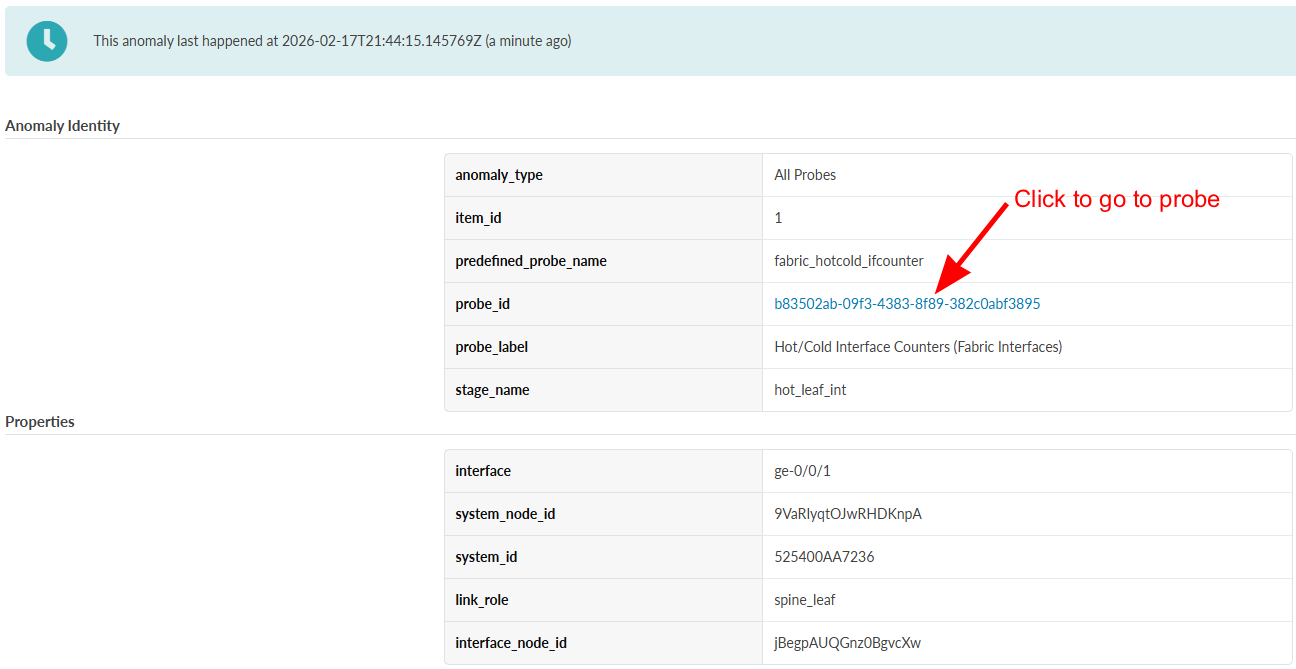
From the additional details page for a probe, click on the probe_id to view the probe details in Analytics > Probes.
Probe Details
Intent-Based Analytics (IBA) probes are essential for real-time network monitoring, anomaly detection, and extracting actionable insights from telemetry data. From the probes page you can view instantiated predefined and user-created probes. Probes can be enabled, disabled, created, and deleted from the Probes page.
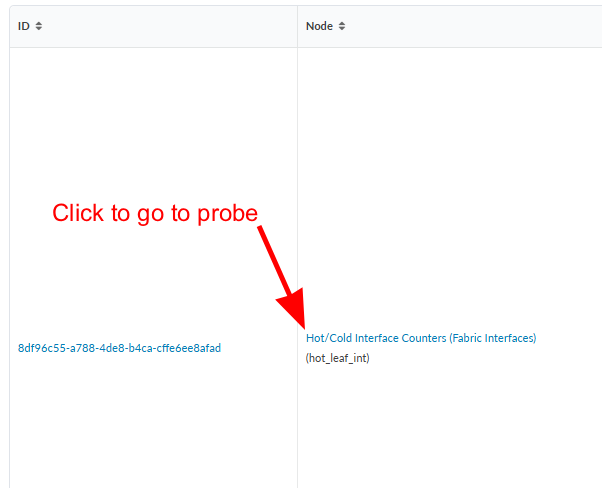
To access additional probe details, go to the table Node column:
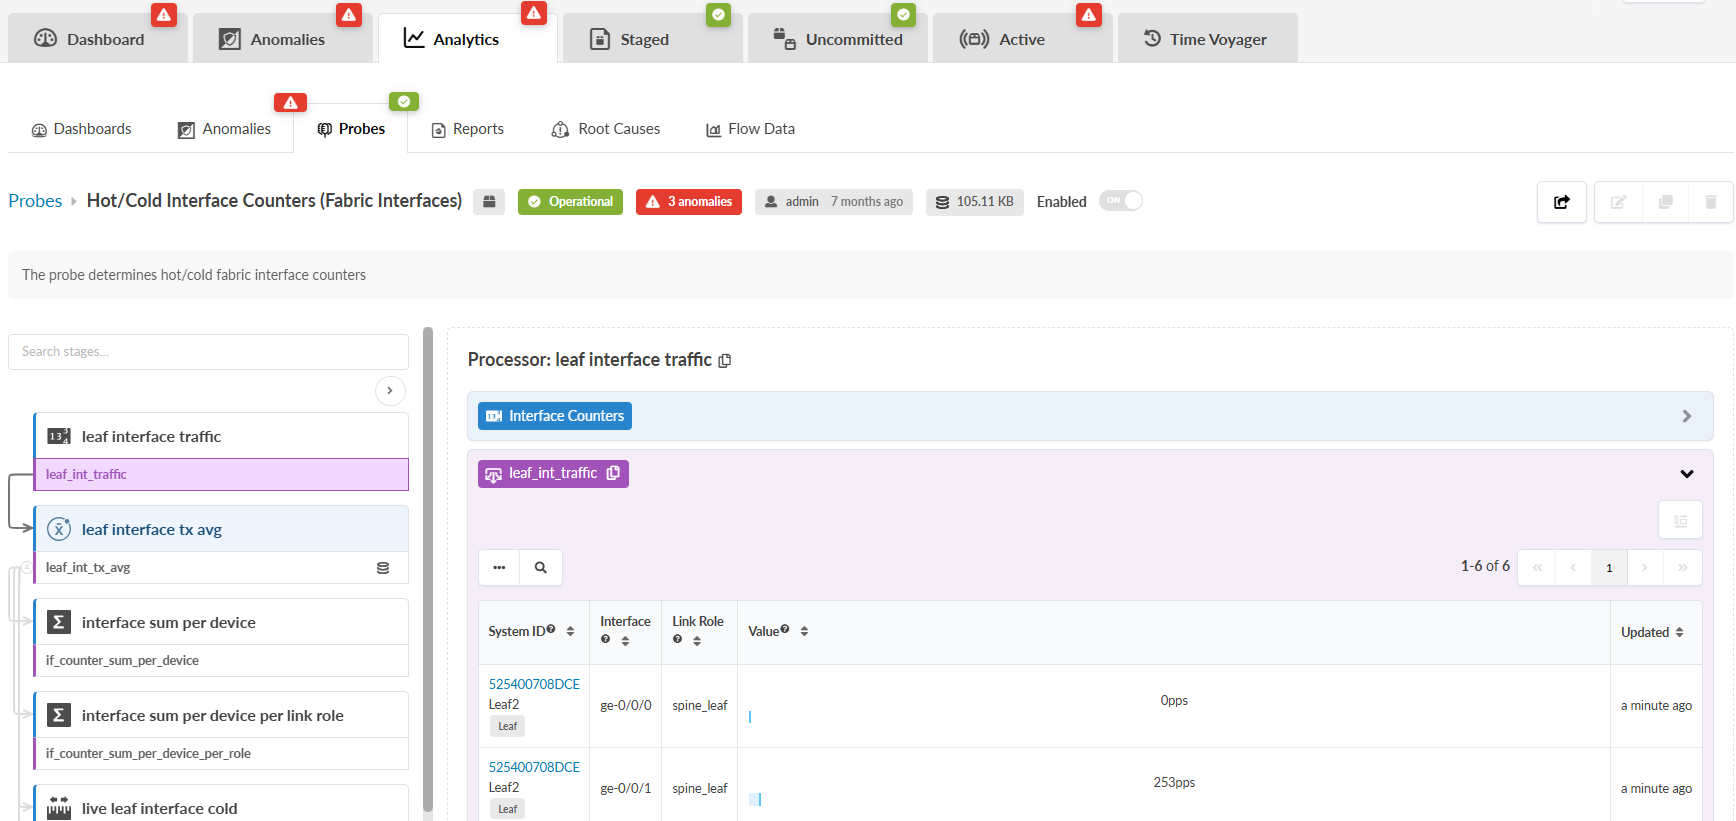
Click a probe name to view its description in the Analytics > Probes page. View the components of the probe and related probe details. Click the Probes tab to see a list of all probes. Click a probe name to return to a detailed view of the selected probe.
You can also reach the probes page by following these instructions:
Navigate to Analytics > Probes.
From the Probes page, click the name of the probe you want to view.
Device Telemetry
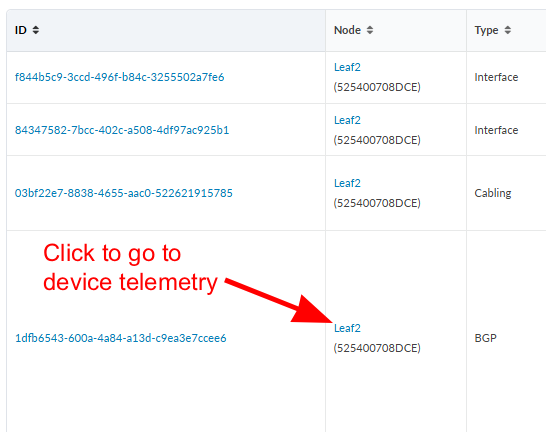
To access device telemetry anomalies, go to the anomalies table Node column:
Click a device name to go to its telemetry page. The device information will open in the Anomalies tab under Telemetry. You'll see associated anomalies in the device telemetry table.
You can also reach the device telemetry section by following these instructions:
Use the left navigation menu in the GUI. Navigate to Devices > Managed Devices. Click the Management IP of the device to view.
Click the Telemetry tab to open the Telemetry details page
Click on the Anomalies tab Telemetry > Anomalies. All anomalies (indicated in red) from the telemetry services are aggregated under the Anomalies tab.