Stripe and Rail Traffic Visibility Probe
Introduction
In a Rail Optimized Stripe Architecture, a GPU Backend fabric provides the infrastructure for GPUs to communicate within an AI cluster. For more information, see GPU Backend Fabric.
The infrastructure of a GPU Backend fabric makes it ideal for high-demand AI workloads like AI Large Language Model (LLM) training. One of the main goals of a GPU Backend fabric is to provide lossless GPU-to-GPU communication, because this affects the speed and efficiency of AI workload completion. This means that a centralized view of real-time and historical traffic flow data across stripes is essential.
Version 6.0 introduces a stripe-aware, rail-aware probe called the Stripe & Rail Traffic Probe to provide traffic analytics for Rail-Optimized networks.
Stripe and Rail Traffic Probe Overview
The probe performs the following:
-
Collects traffic data for leafs which are part of stripes, divided into two parts:
- GPU-server-facing interface counters
- Spine-facing interface counters
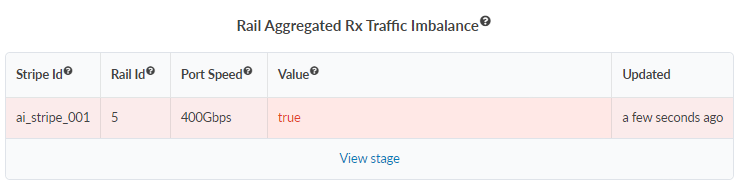
-
Computes intra-stripe traffic and inter-stripe traffic, detects traffic imbalances in rails and stripes.
Dashboard: Stripe and Rail Traffic Summary
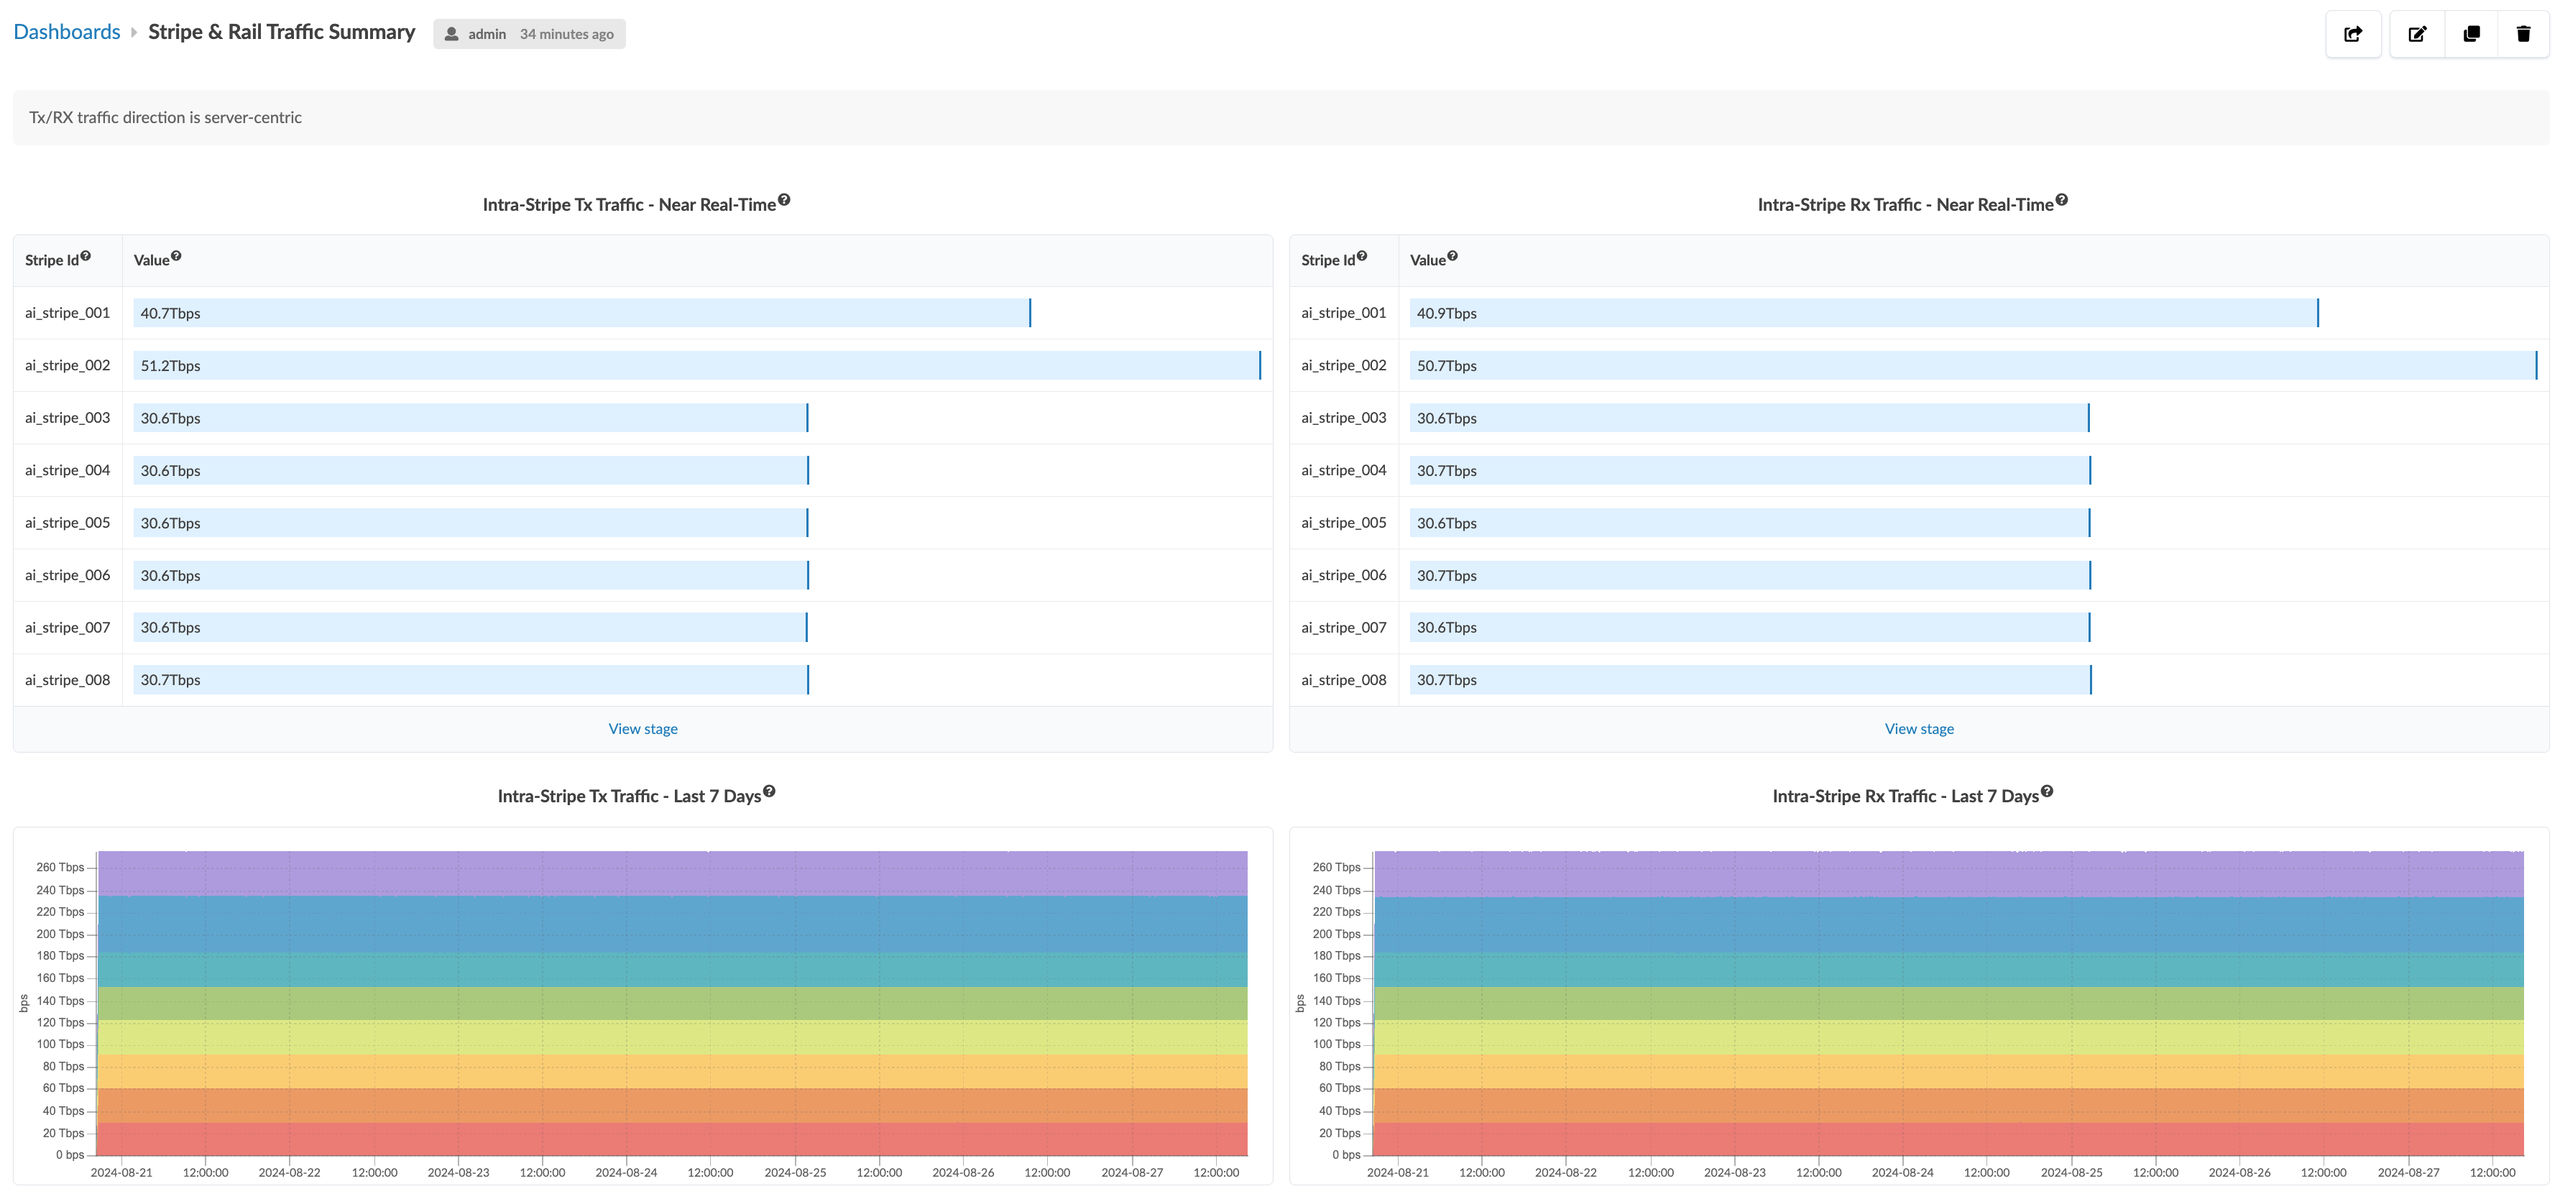
Rail Aware Traffic Analytics
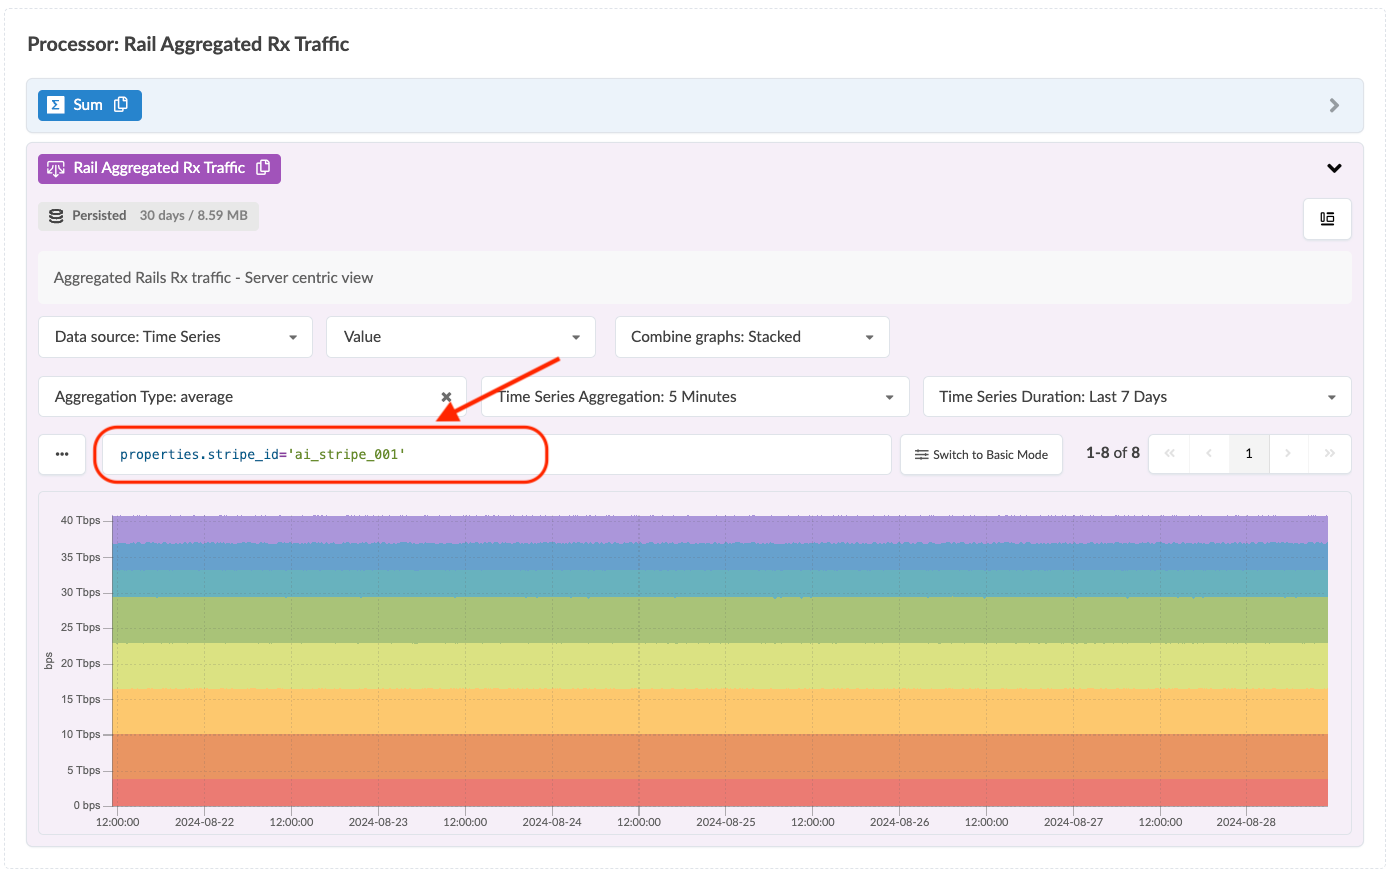
Version 6.0 provides rail-aware traffic analytics dashboards. Widgets filter data specifically for the selected rail. The following image shows the filtering condition based on the "properties.stripe_id" property.
This ensures that the dashboard reflects the latest state of the network fabric.
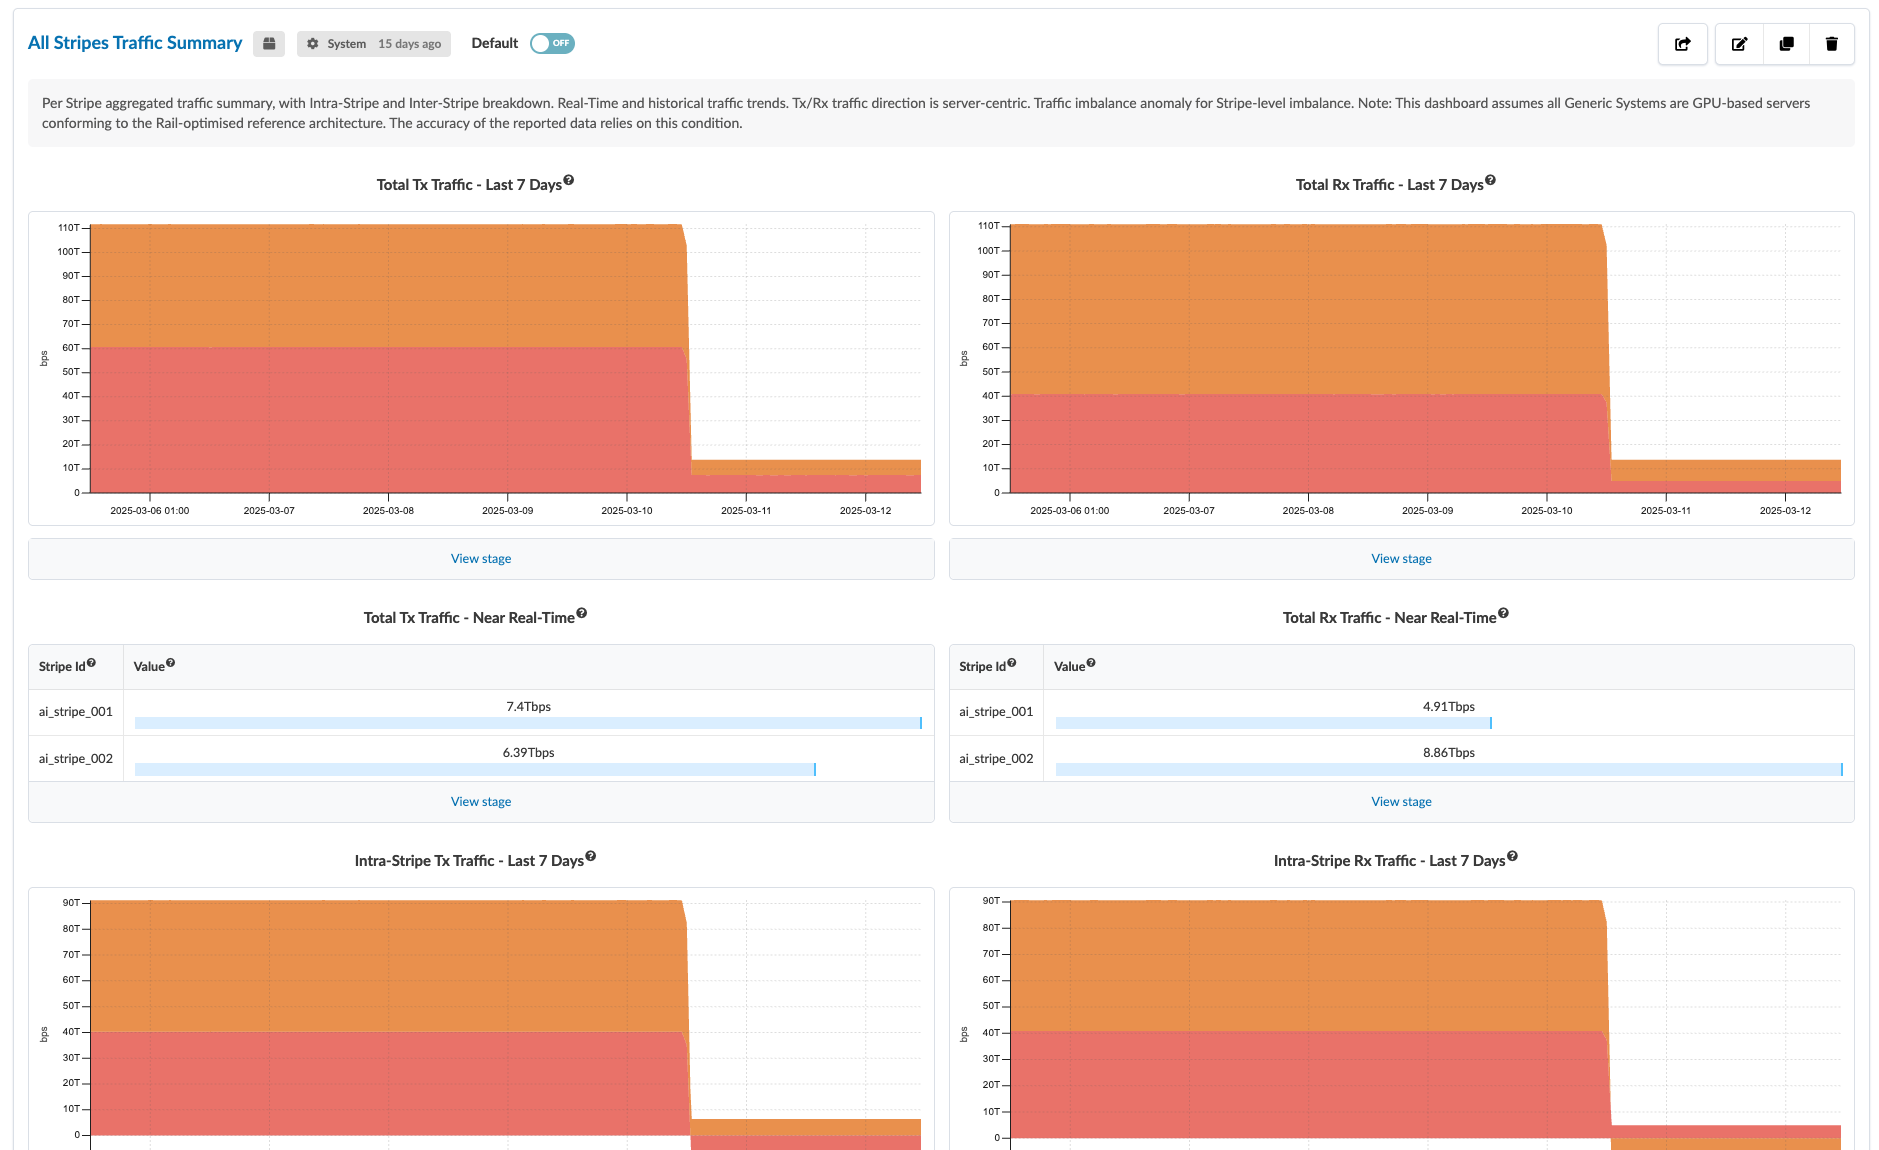
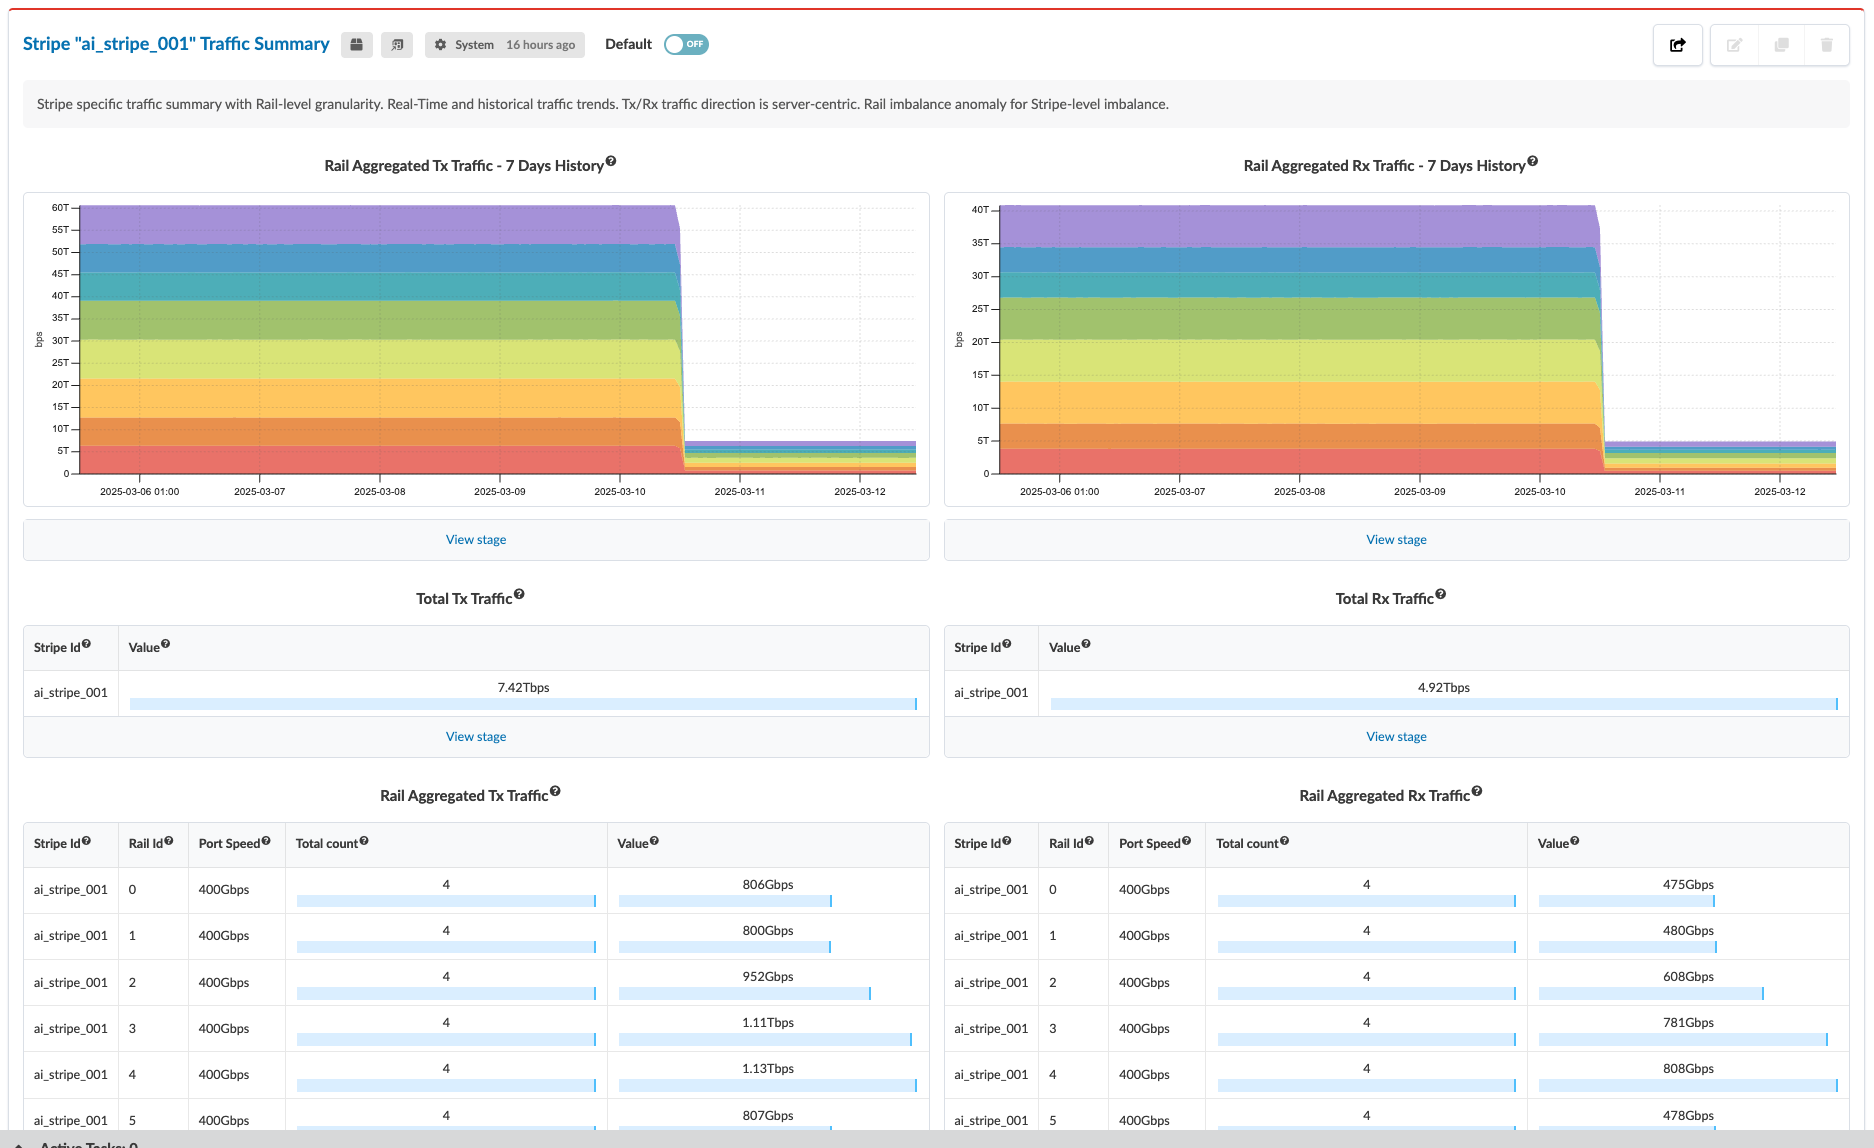
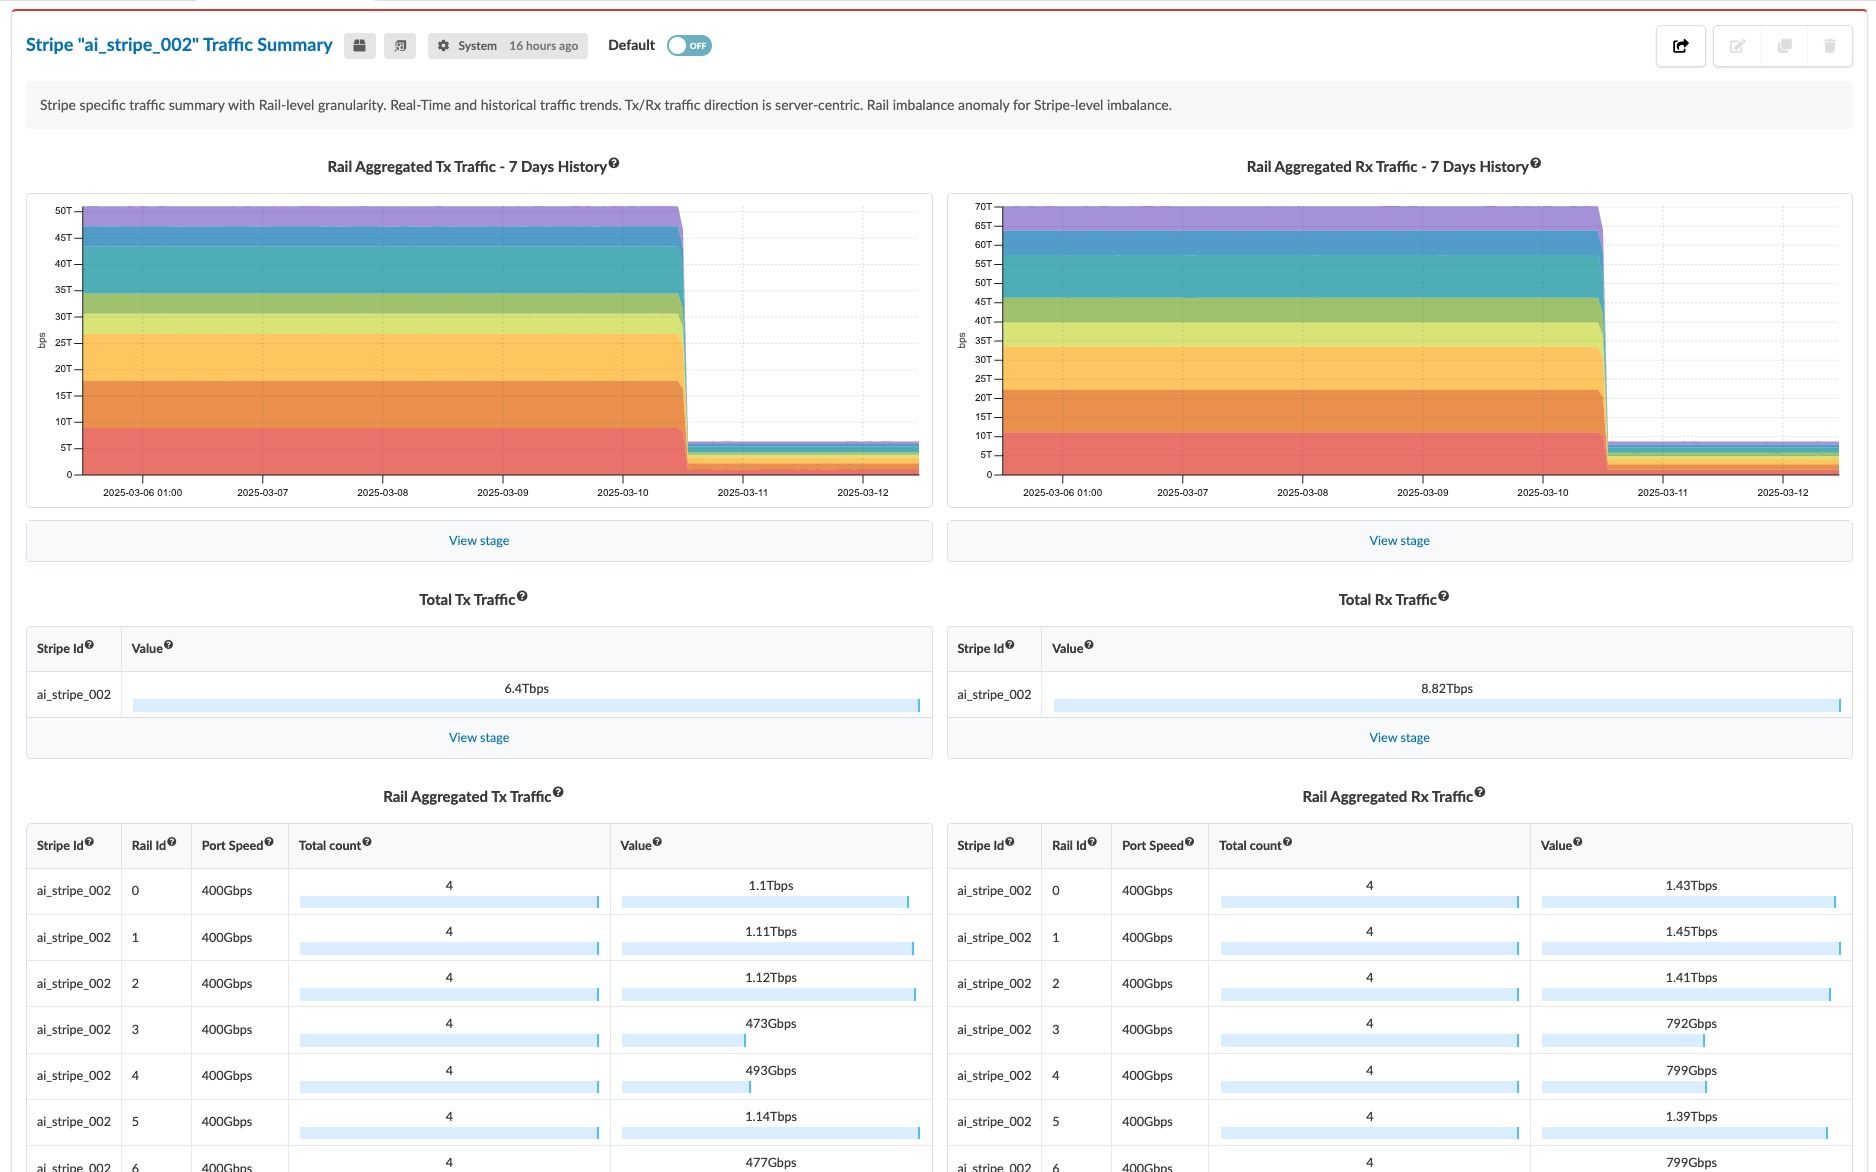
Version 6.0 also supports an auto-scaling dashboard called the Stripe Traffic Summary. This dashboard automatically adjusts the number of dashboard instances based on the stripes that are present in the blueprint. If a stripe is removed, the corresponding stripe instance is also removed from the dashboard.
In the images below, a stripe instance showing real-time traffic metrics is generated for each stripe present in the blueprint.