Use Custom Telemetry Data in an IBA Probe
This topic describes how to configure and use custom telemetry data in an IBA probe.
We've created a custom telemetry collector service to specify data from your devices. Next, we'll ingest this data into IBA probes in your blueprint as described in Create a Probe. This process allows Apstra to visualize and analyze the data
Types of Processors
An IBA probe, functioning as an analytics pipeline, begins with a source processor. This processor creates data and several outputs without requiring any input. The different types of source processors are described in Table 1.
You can add more processors in the probe for extra data analytics. This enhances your network's health insights. These extra processors, known as analytical processors, are described in Table 2.
Analytical processors let you compile, logically process your data, and identify an
intended state to detect anomalies. These processors perform calculations such as
averages, min/max, and standard deviations. This aggregated data is then compared
with expected results to determine if it's within a preset range. Anomalies are only
flagged when a specific threshold is surpassed for a certain duration, preventing
flags for transient conditions. A Time_In_State processor
configuration can achieve this.
| Built-in |
Built-in processors categorize the various processors used to enable services like power monitoring. These processors determine the scope of service activation using a graph query. |
| Extensible |
Data from IBA probes is ingested by extensible collectors. This data is then collected by processors using a graph query provided by a custom service. Service keys are mapped using graph elements, depending on whether the data type is static or dynamic. This process decides the scope of telemetry collection.
|
| Graph |
Graph processors ingest data from the IBA probes source in the graph database. They do not consume device telemetry data.
|
|
Types of Analytical Processors |
|
|---|---|
|
Analytical Processors |
|
For detailed descriptions of all types of processors, see Probe Processor (Analytics) in the Juniper Apstra User Guide.
Create a Probe
As previously mentioned, an IBA probe, functioning as an analytics pipeline, begins with a source processor. It operates in two modes with the telemetry service: Static and Dynamic series modes. In Static series mode, all keys can be sourced entirely from the graph. Conversely, Dynamic series mode does not require key mapping. In instances where data like power supply isn't modeled in the graph, a probe is created without mapping to the graph. Subsequently, the data ingestion into the IBA pipeline is collector-driven rather than graph-driven.
Data Center and Freeform blueprints support IBA probes with the Custom Telemetry Collection.
To create a probe:
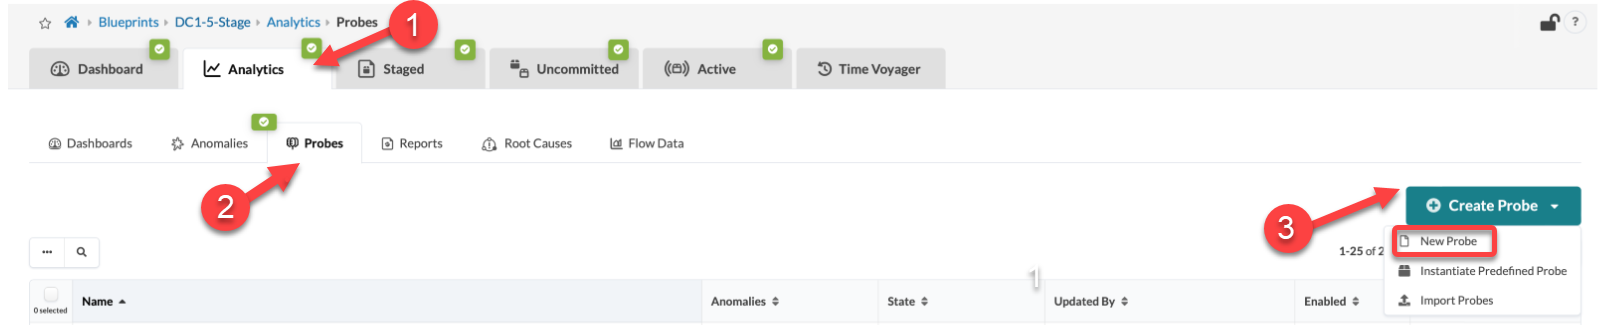
-
From your blueprint, navigate to Analytics >
Probes, then click Create Probe > New
Probe.
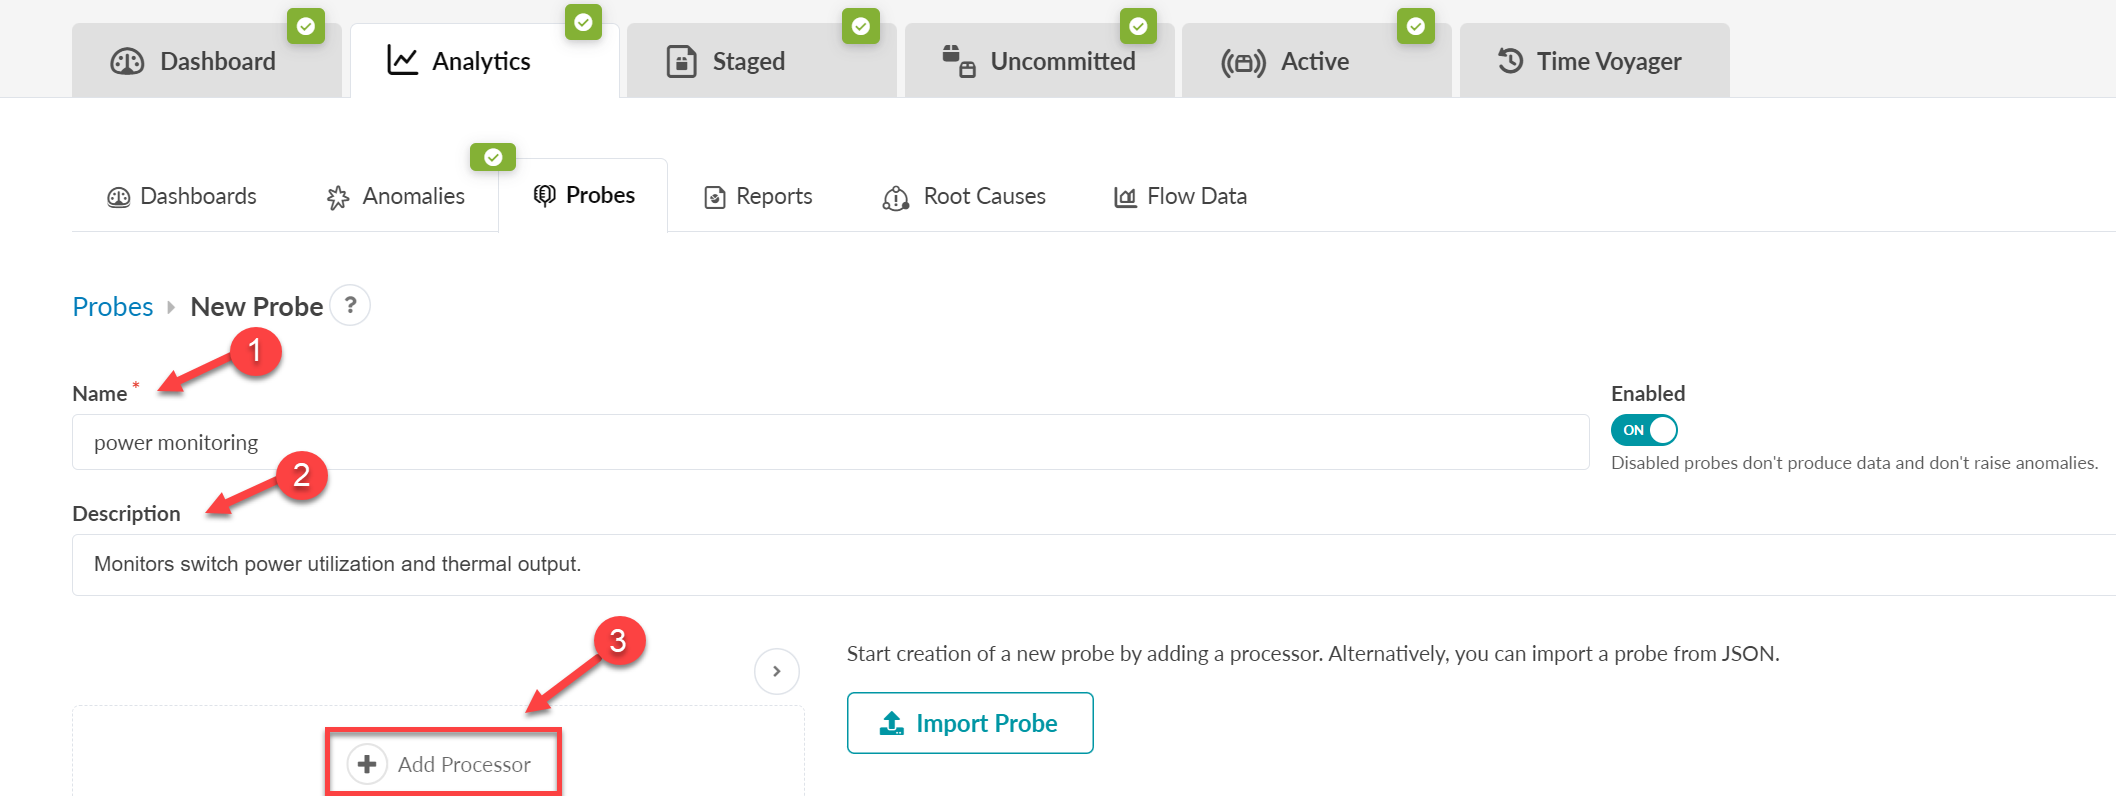
-
Enter a Name and Description
(in this example, power monitoring), then click
Add Processor.
-
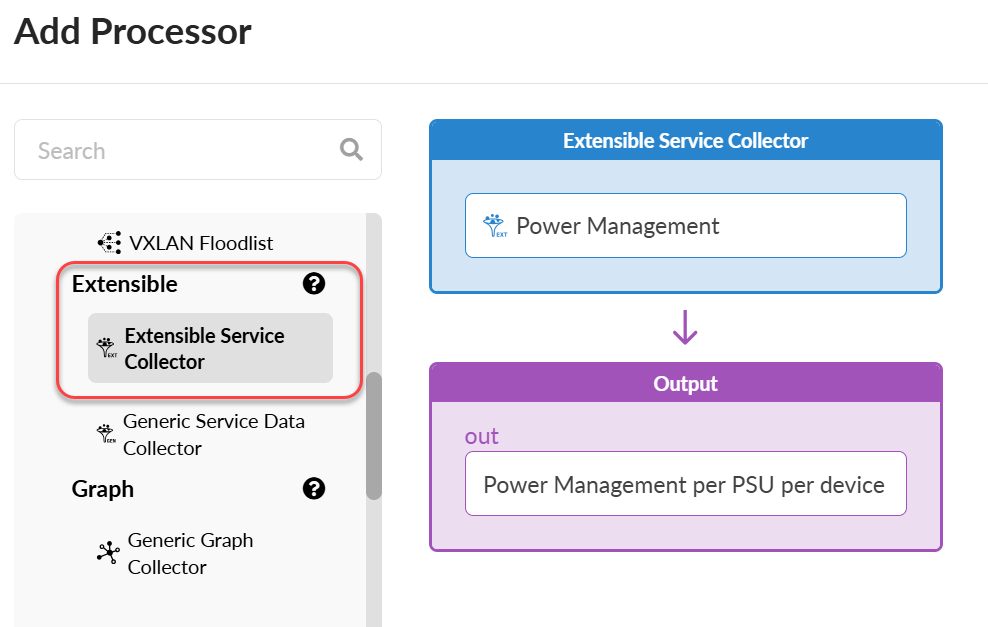
Select a processor from the Source Processors list,
then enter the collector's name and output information. In this example, we
selected the Extensible Service Collector processor
to consume the service you just created.
-
To the right of the Graph Query field click the
Select a predefined graph query button.
The Graph Query sets the blueprint's scope for the telemetry collection. If a device in the blueprint doesn't match the graph query, the telemetry collection for it won't start.
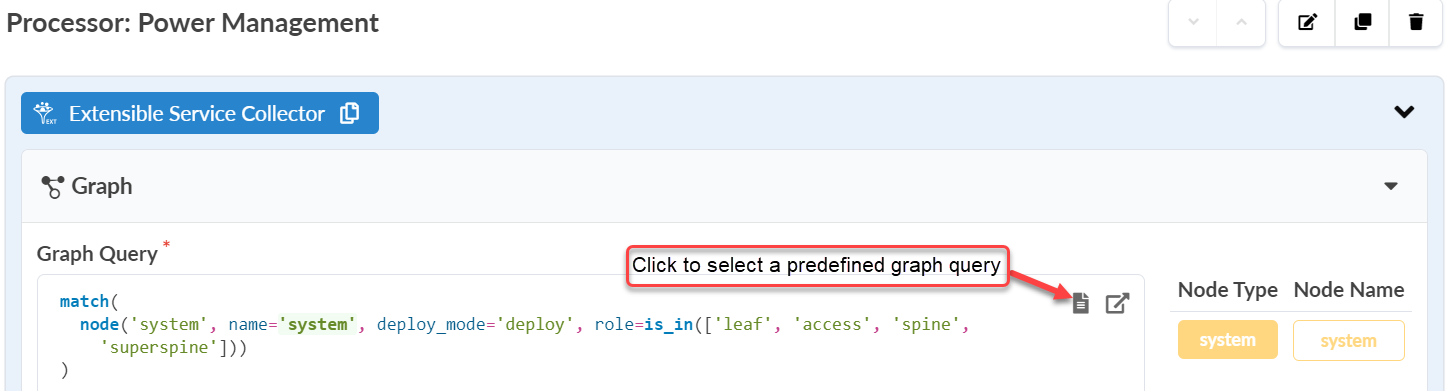
The graph query matches all system nodes in your blueprint graph database. Each managed device, whether a leaf switch or spine switch, is represented as a
systemnode in the graph.For example, in the Graph Query, the query matches all
system, type nodes. In deploy mode, these nodes have roles such asleaf,access,spine, orsuperspine. -
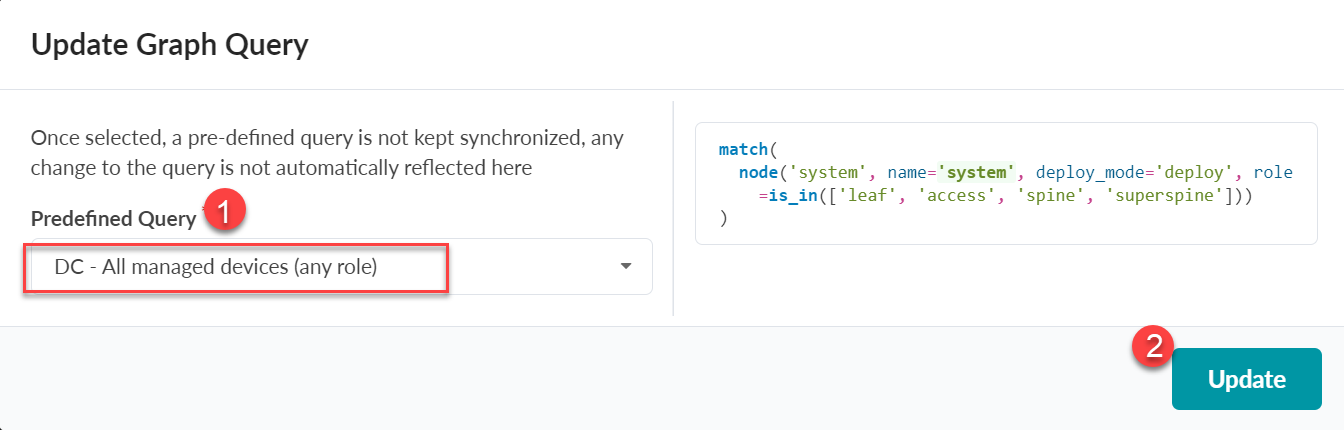
Select DC – All managed devices (any role) from the
Predefined Query drop-down, then click
Update.
-
From the Processor page, specify the following:
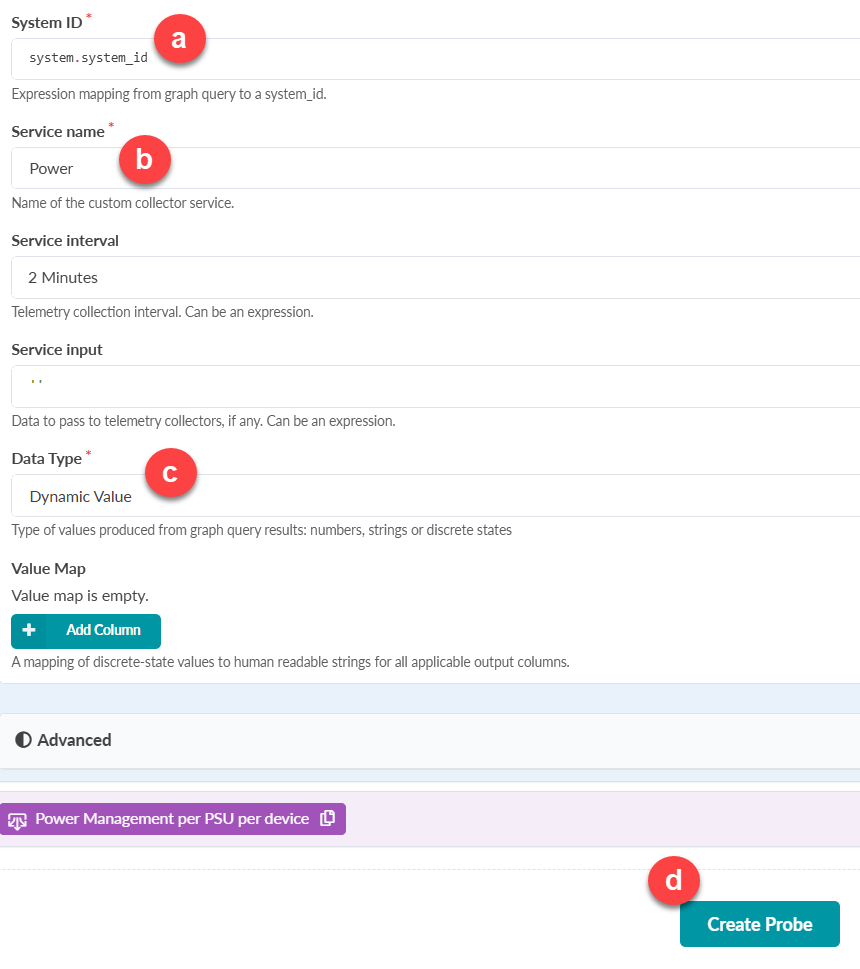 Well done! You successfully create a probe!
We created a working probe that collects the power consumption for every device in your network. Now let’s explore a few valuable customization options to refine your probe.
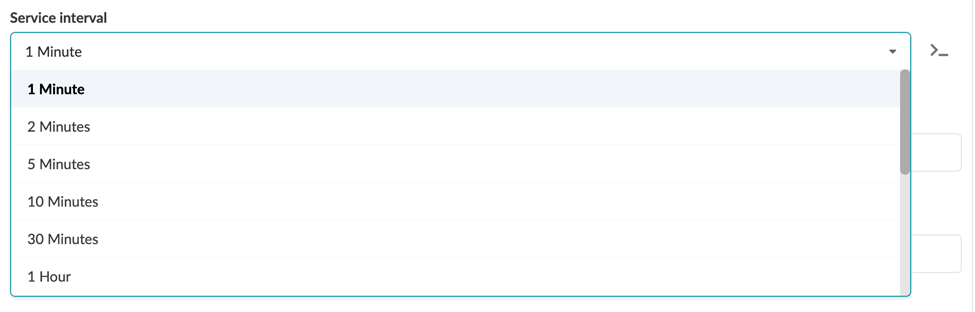
Service Interval
The telemetry collection service uses a service interval to fetch and ingest data from devices. This interval is crucial as a too aggressive one can overload your devices. The data type you collect determines the optimal interval.
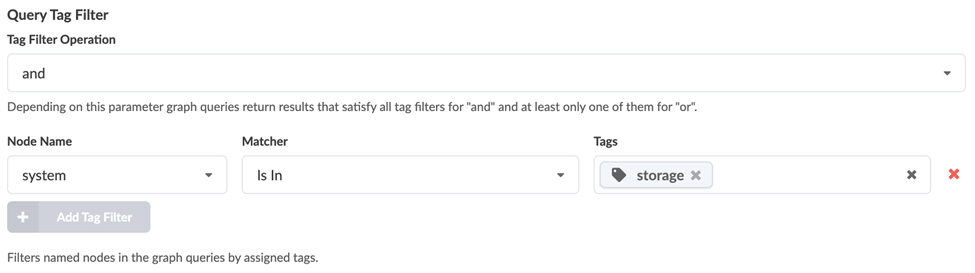
Query Tag Filter
Another useful customization option is the Query Tag Filter. Let’s say you tagged some switches in your blueprint as storage for a specific monitoring use case. You can configure this filter to perform telemetry on devices with the matching tag, as shown in the following example:
Raw data from your custom telemetry collector might be difficult to interpret. Asptra, however, notifies you proactively if any anomaly is detected in your network.
In the next section, we'll enrich the power probe we created with additional processors to detect and raise anomalies.
Configure Additional Processors for Anomaly Generation
We'll now set up our power probe to identify any power anomalies. You can do this either individually or cumulatively by adding extra processors. The anomalies are then stored in a historical database for reference. We'll further augment the probe by aggregating power readings from all of the system power supplies.
To get started:
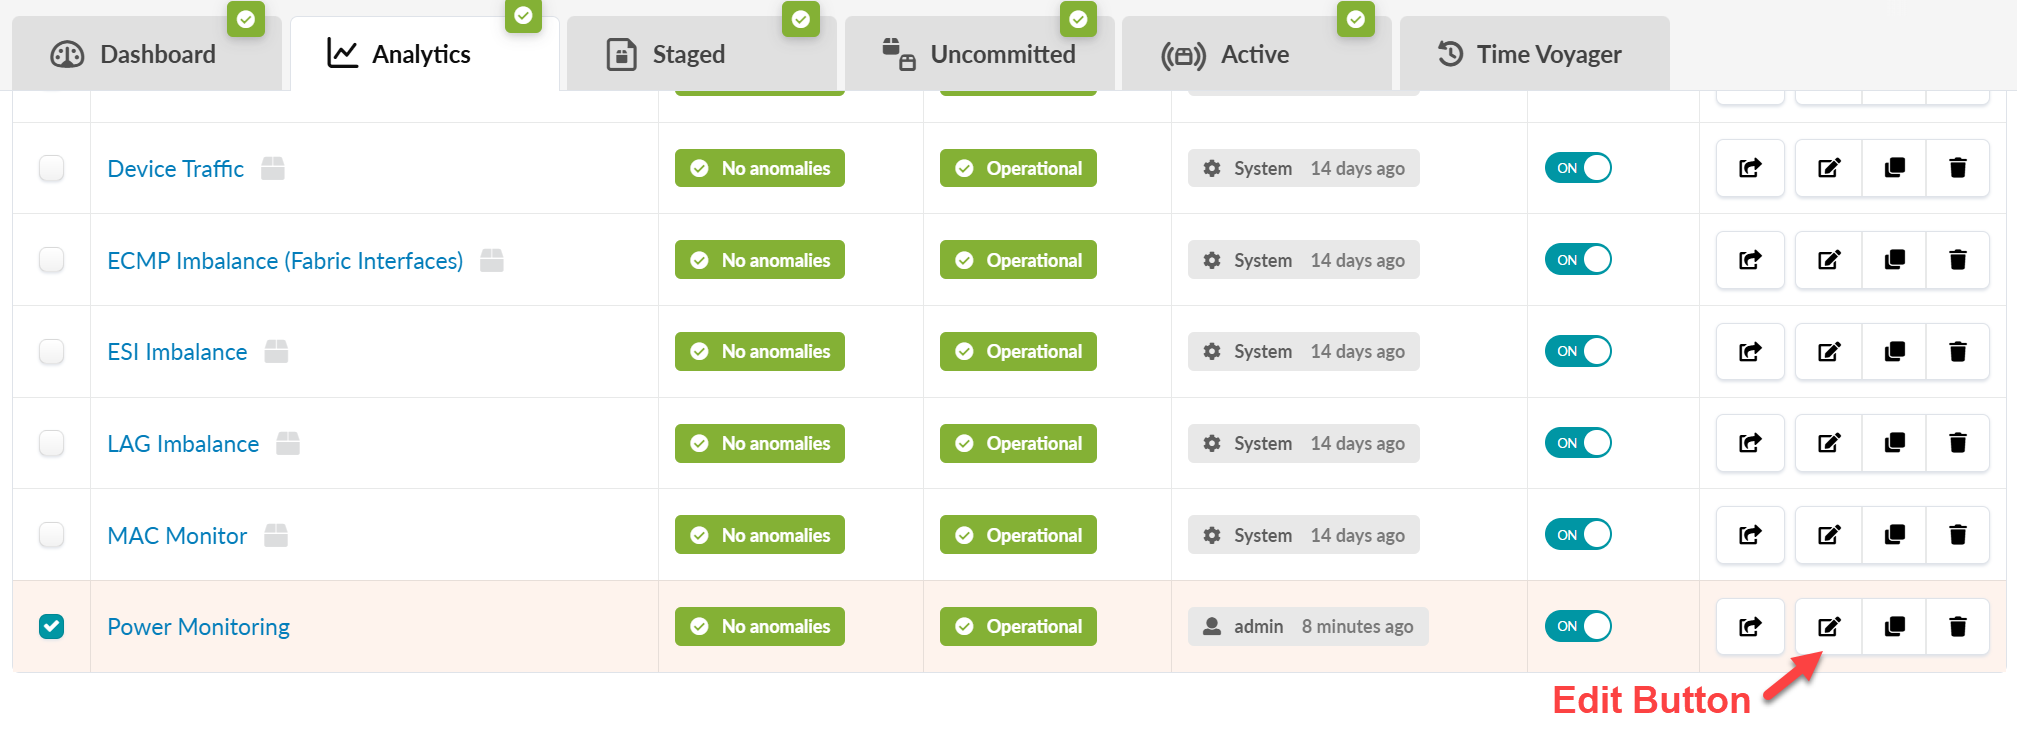
Click the Edit button next to the power monitoring probe you created in Create a Probe.
Click the Add Processor button to start adding processors.

We'll now show you some examples of some different types of processors you can add to your probe. SeeFigure 1.
Note: Processors fall into two categories: source and analytical. Each category hold various sub-categories. Every probe requires at least one source processor. Although you can use any type of processors, most probes use analytical processors, as shown in the following examples.Figure 1: Example of Power Processors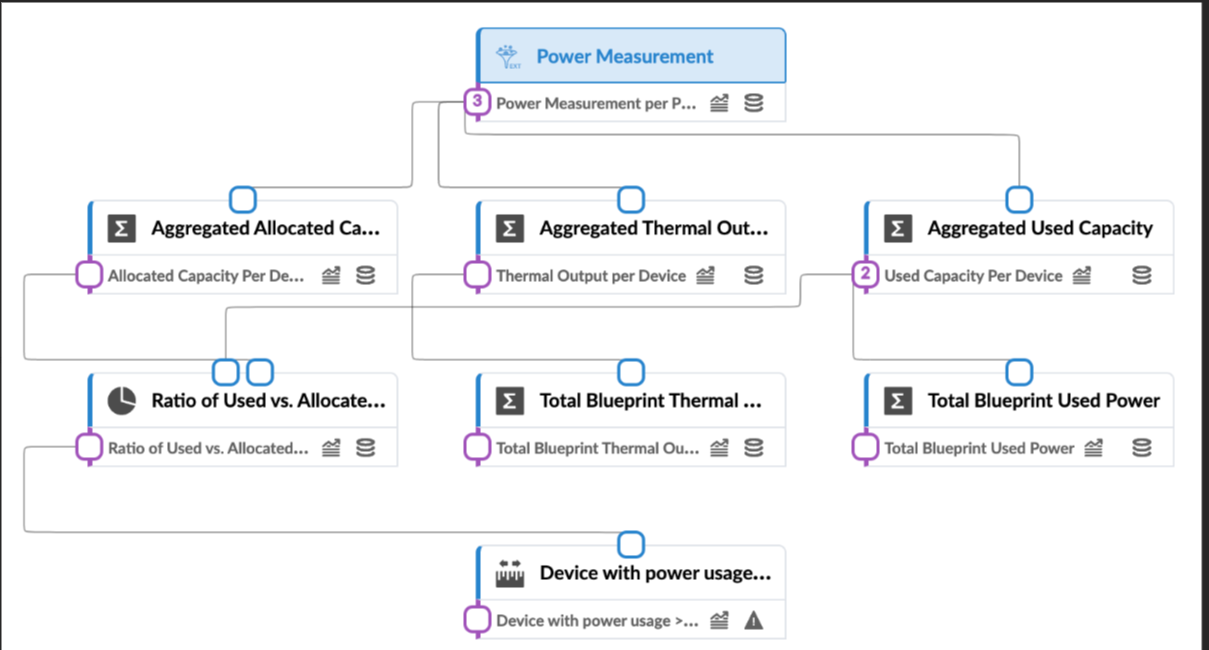
- Sum Processor to Aggregate Allocated Capacity
- Sum Processor to Aggregate Thermal Output
- Sum Processor to Aggregate Used Capacity
- Ratio Processor to Calculate the Proportion of Used Capacity to Allocated Capacity
- Sum Processor to Calculate Total Thermal Output and User Power
- Range processor to set threshold based anomaly
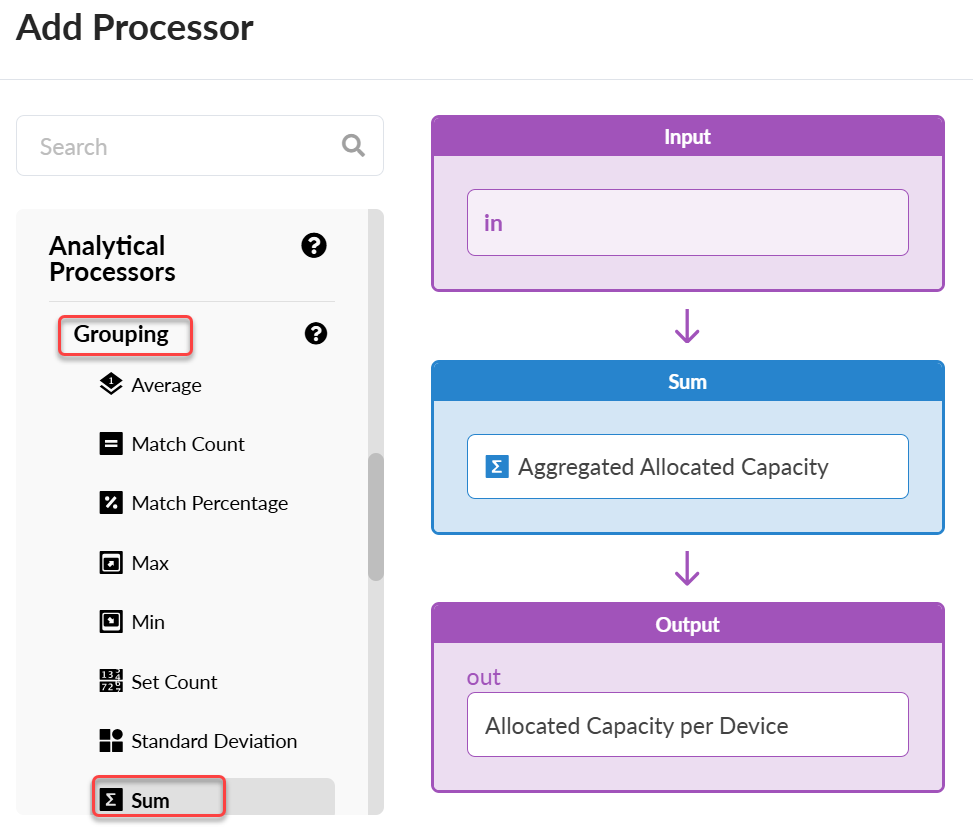
Sum Processor to Aggregate Allocated Capacity
From the Analytical Processors list, under the Grouping category, select Sum. In the Sum and Output fields, enter Aggregated Allocated Capacity and Allocated Capacity Per Device.
Edit the processor.
Enter Power Measurement per PSU per Device for the Stage Name and Allocated_Capacity for the Column Name. We'll then group this data by
system idto provide a consolidated view of the allocated capacity for each device's power supplies.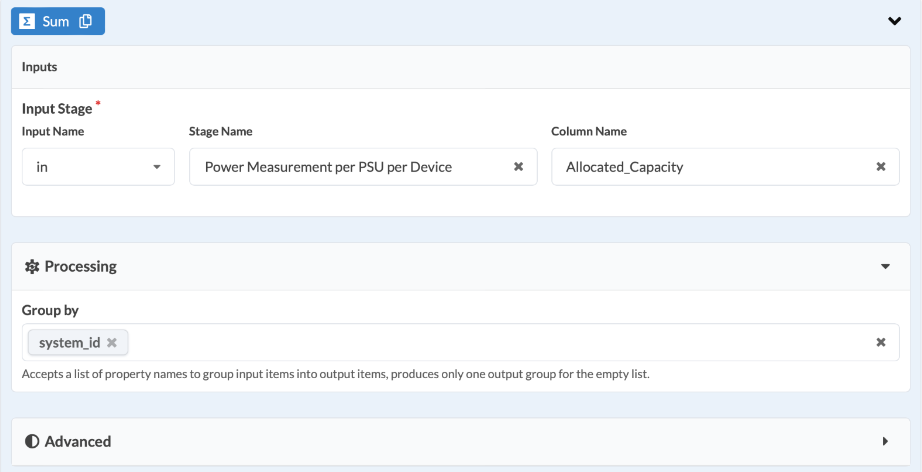
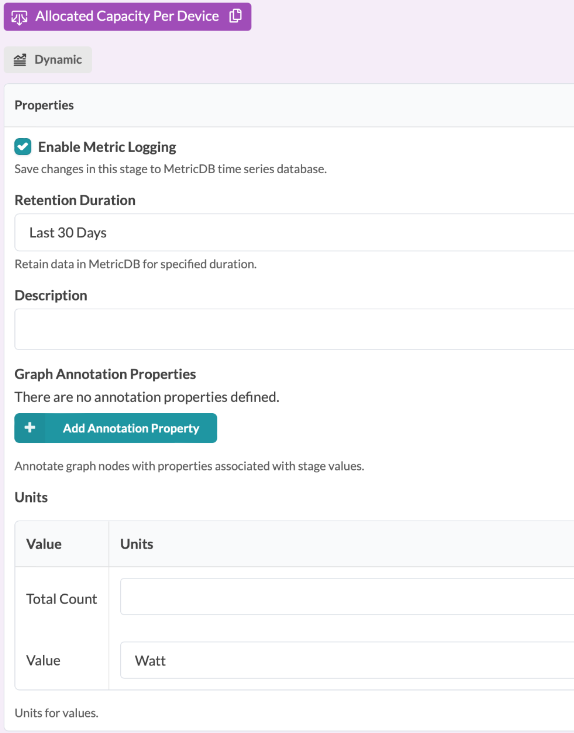
Check Enable Metric Logging to enable logging, then enter the value such as Watt, to measure the Allocated Capacity Per Device. This action allows tracking of aggregate usage history for the past 30 days.
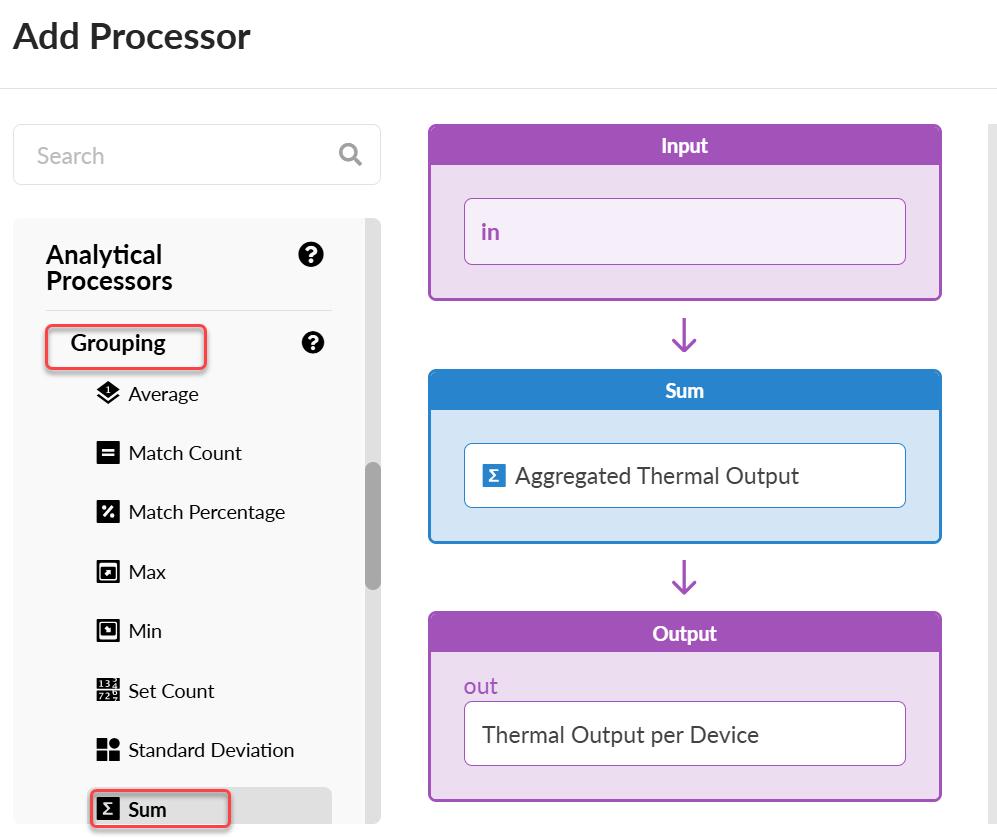
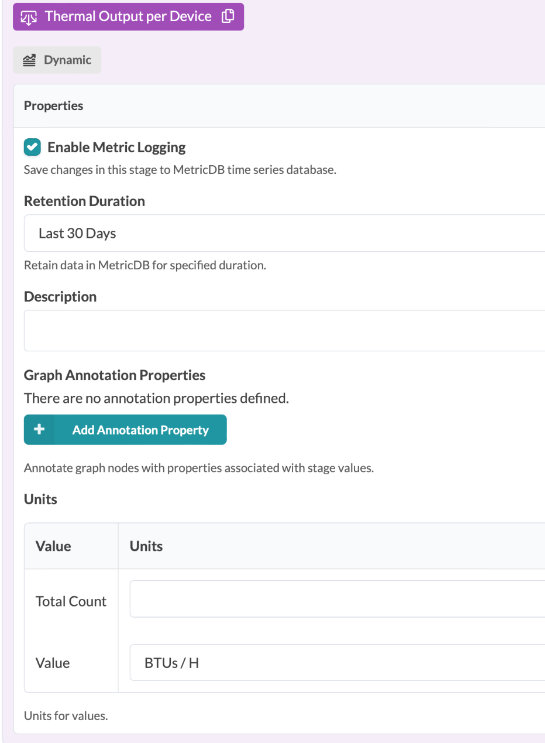
Sum Processor to Aggregate Thermal Output
The thermal output of devices is an important metric to monitor. It plays a key role in data center capacity planning and power usage. Having knowledge of the actual power utilization and thermal output for devices and your EVPN fabric helps the DC Manager plan for power and cooling capacity expansion. The thermal output data from our custom telemetry collector provides a comprehensive fabric total.
From the Analytical Processors list, under the Grouping category, select Sum. In the Sum and Output fields, enter Aggregated Thermal Output and Thermal Output Per Device.
Edit the processor.
Enter Power Measurement per PSU per Device for the Stage Name and Thermal_Output for the Column Name. We'll then group this data by
system idto provide a consolidated view of the thermal output for each device.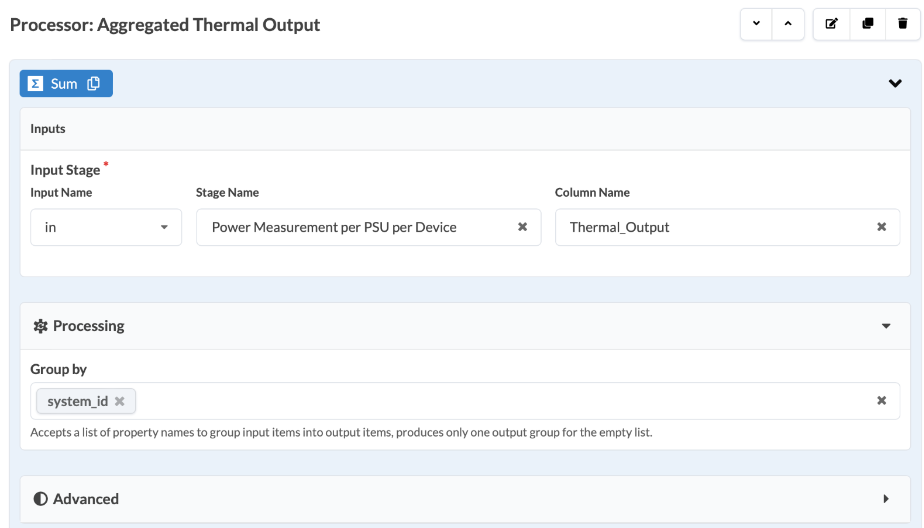
Check Enable Metric Logging to enable logging Then specify the power consumption value, such as BTUs, to measure the thermal output.
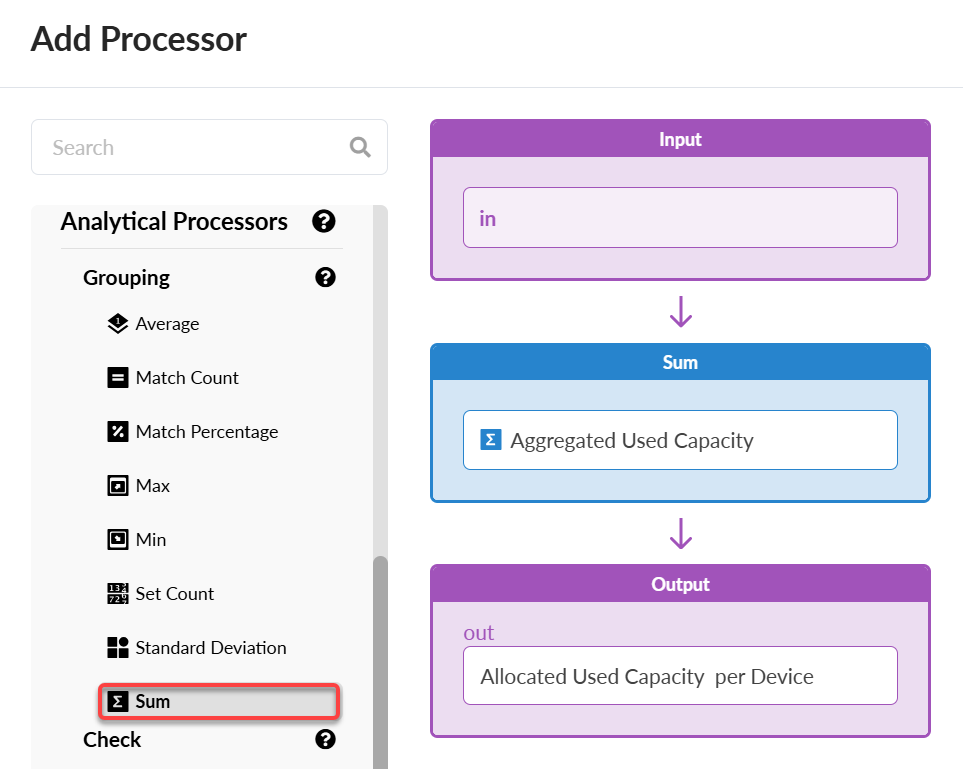
Sum Processor to Aggregate Used Capacity
From the Analytical Processors list, under the Grouping category, select Sum. In the Sum and Output fields, enter Aggregated Used Capacity and Allocated Used Capacity per Device.
Edit the processor.
Enter Power Measurement per PSU per Device for the Stage Name and Used_Capacity for the Column Name. We'll then group this data by
system idto provide a consolidated view of the actual power usage for each device.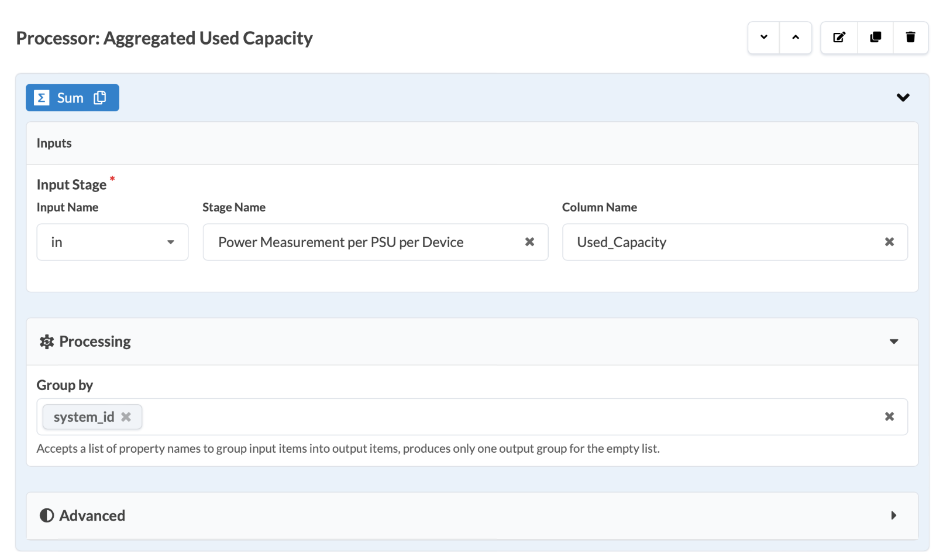
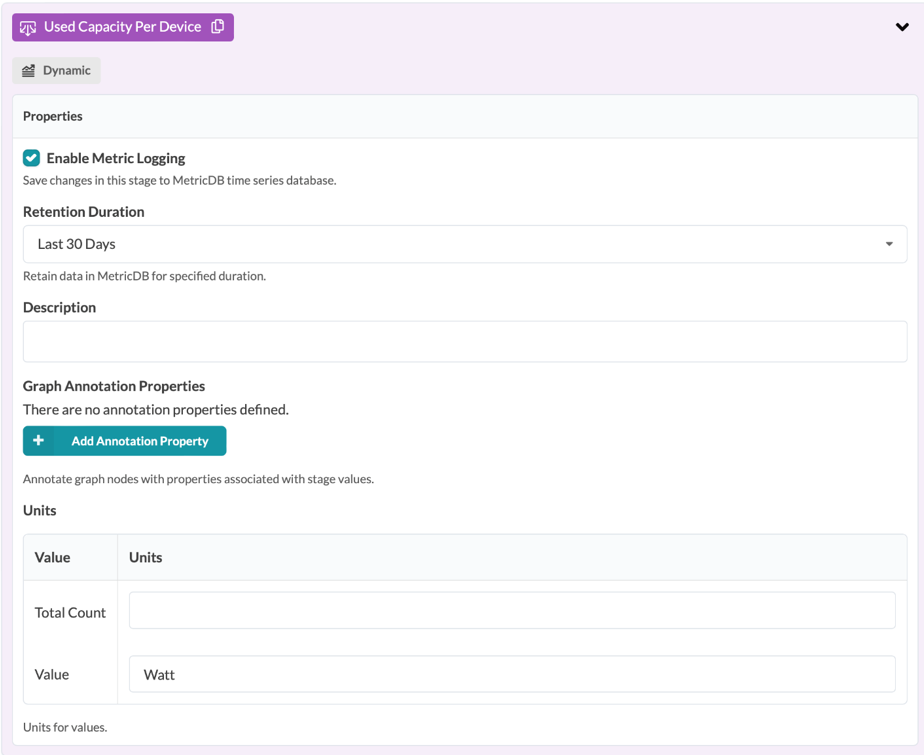
Check Enable Metric Logging to enable logging. Then specify the power consumption value, such as Watt, to measure the used capacity.
Ratio Processor to Calculate the Proportion of Used Capacity to Allocated Capacity
The Arithmetic processor, an Analytical processor type, calculates power usage ratios for each device. This offers a clear view of power distribution.
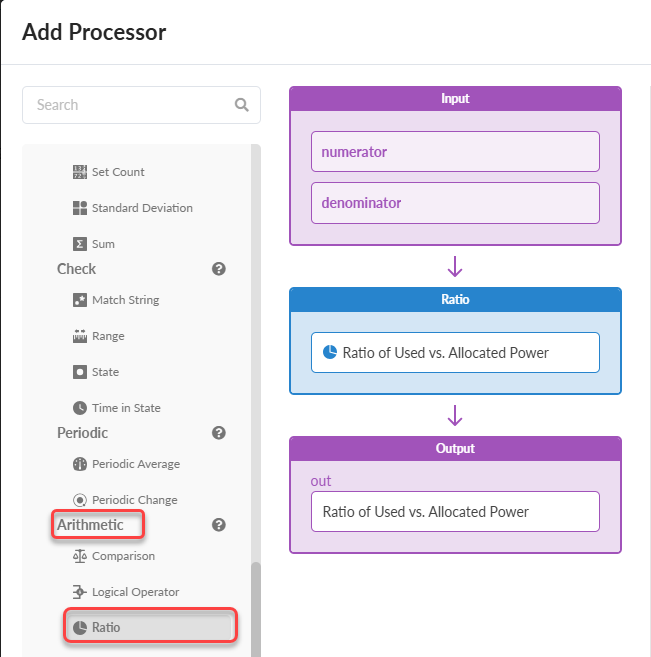
From the Analytical Processor list, under the Arithmetic category, select Ratio. In the Sum and Output fields, enter Ratio of Used vs. Allocated Power.
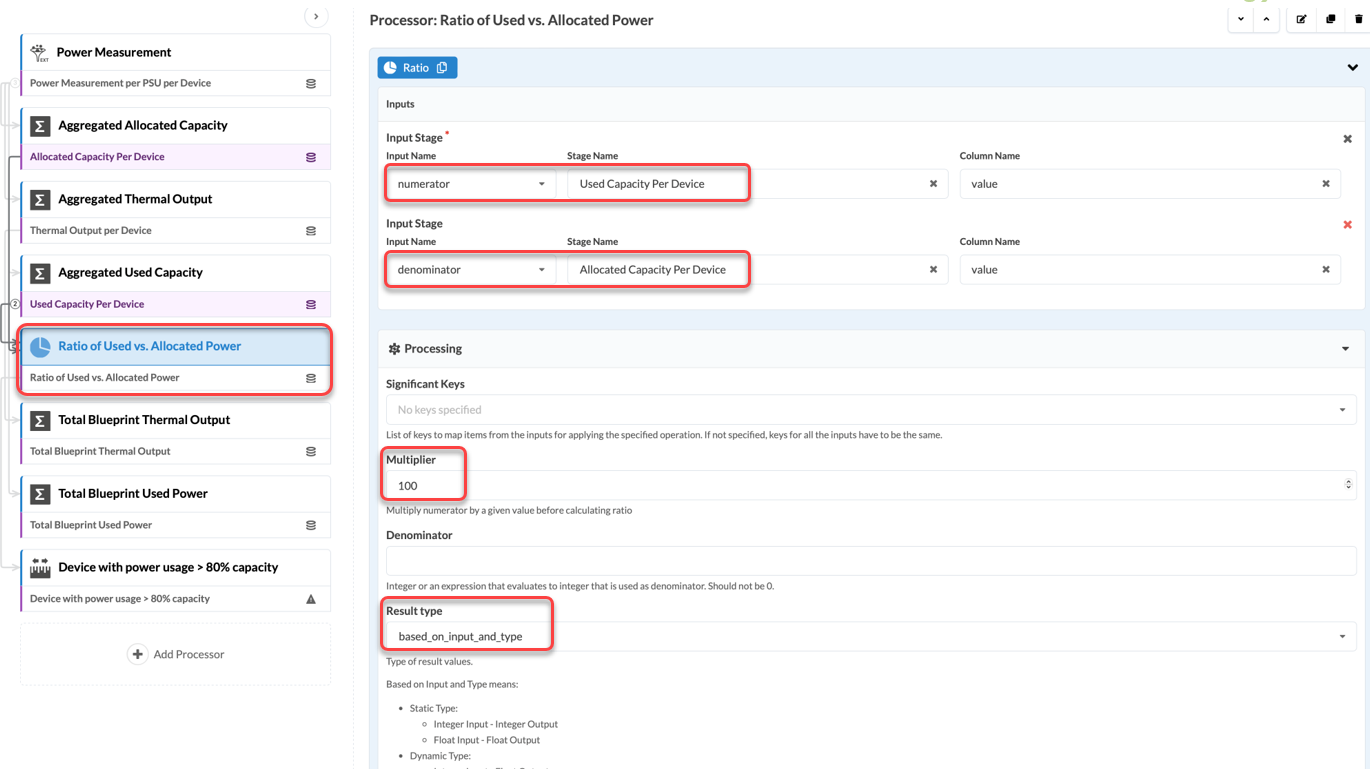
Enter Used Capacity Per Device as the numerator and Allocated Capacity Per Device as the denominator. Use 100 as the Multiplier value so that the result shows as a percentage.
Set the Result type based on input and type.
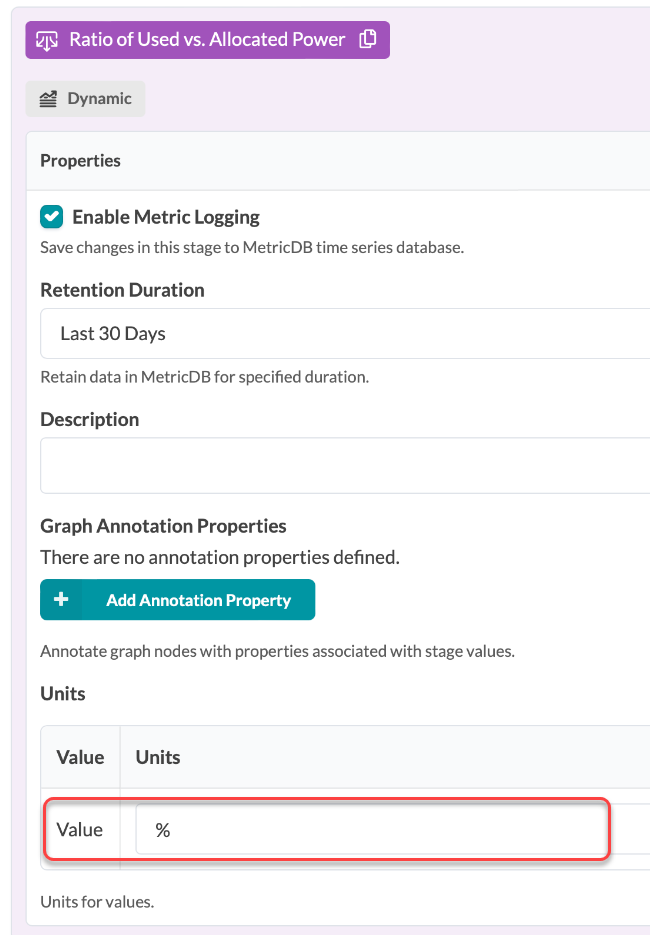
Check Enable Metric Logging to enable logging. Then specify the power consumption value in percentages (%) to measure the Ratio of Used vs. Allocated Power for each device.
Sum Processor to Calculate Total Thermal Output and User Power
For capacity planning purposes, it’s useful to know the total power usage and thermal output for your entire fabric. For this information, we'll create two more Sum processors for Total Blueprint Thermal Output and Total Blueprint Used Power.
In both processors, the Group by field remains empty. This approach allows for an aggregate across the blueprint.
To add a processor for total thermal output:
From the Analytical Processor list, under the Grouping category, select Sum. In the Sum and Output fields, enter Total Blueprint Thermal Output.
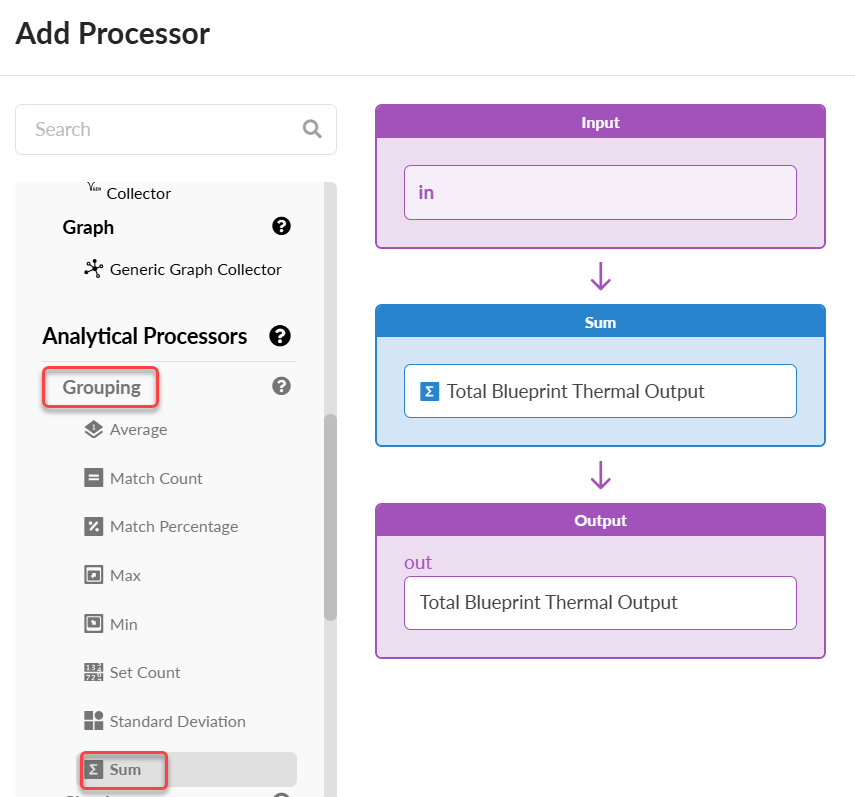
Edit the processor.
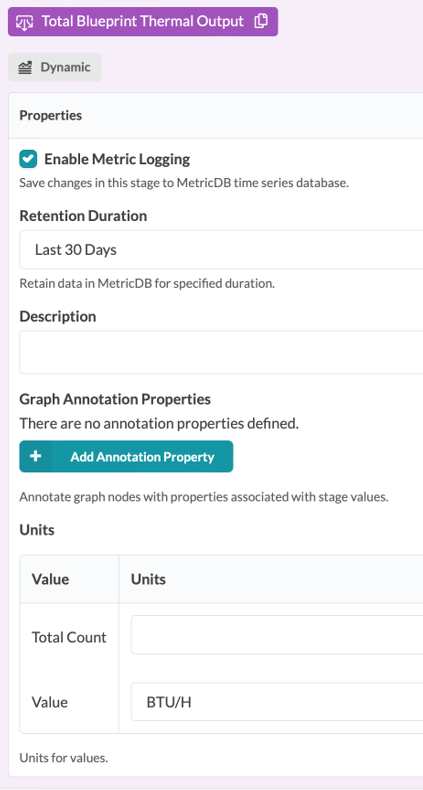
Enter Thermal Output per Device for the Stage Name and value for the Column Name.
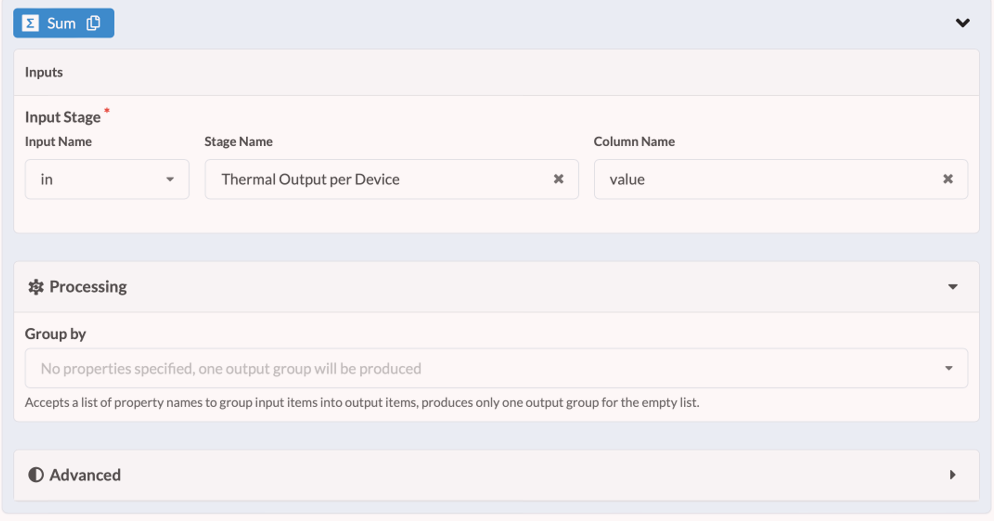
Check Enable Metric Logging to enable logging.
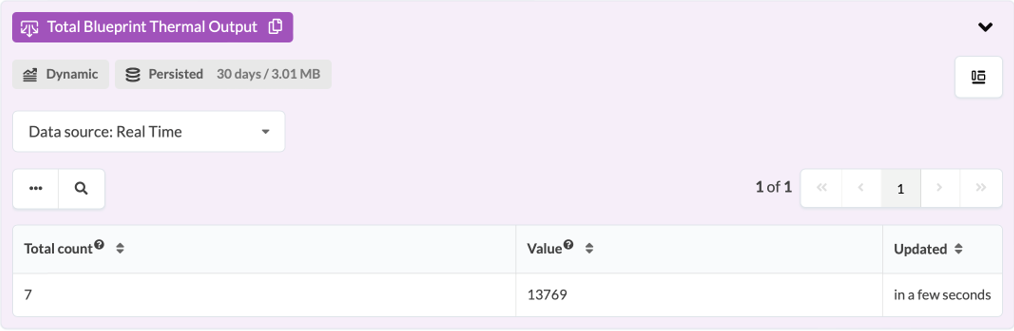
View your result.
Next, we'll create a processor for Total Blueprint Used Power.
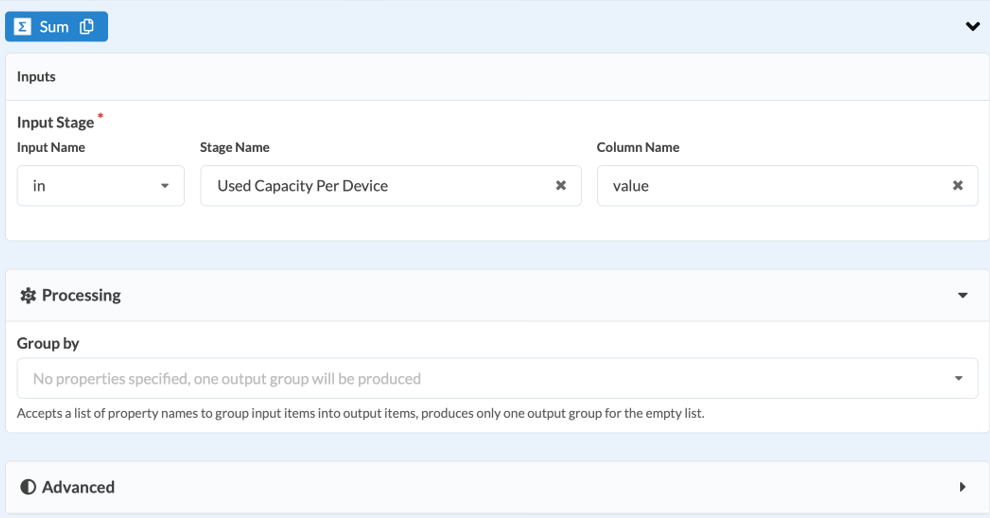
From the Analytical Processor list, under Grouping, select Sum. In the Sum and Output fields, enter Total Blueprint Used Power.
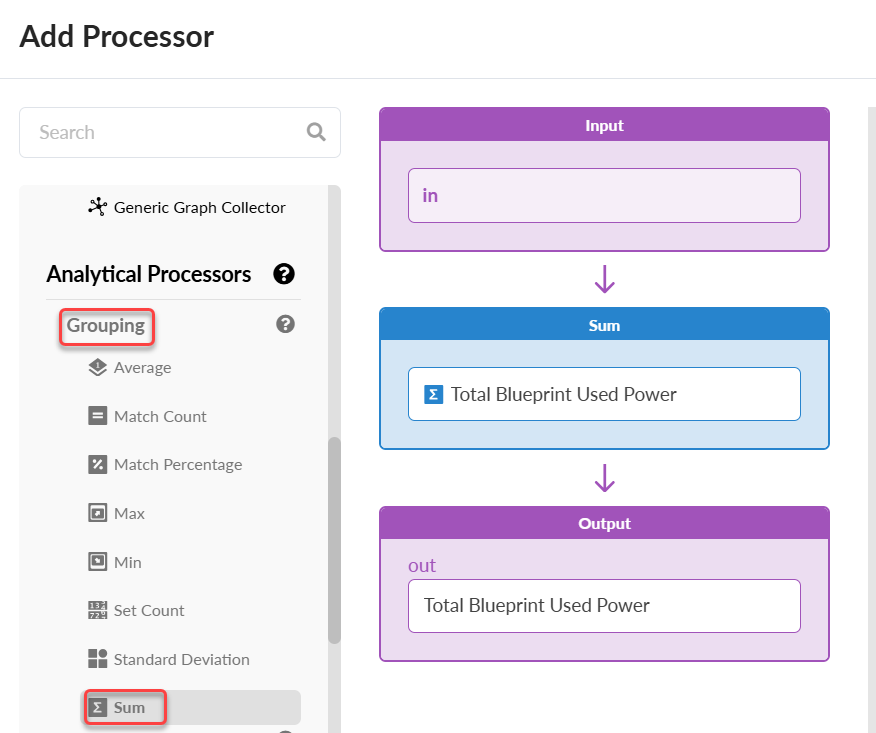
Edit the processor.
Enter Used Capacity Per Device for the Stage Name and value for the Column Name.
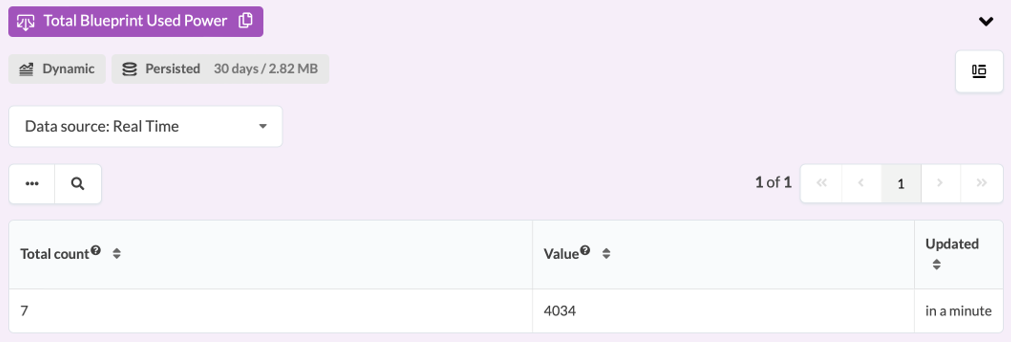
View your result.
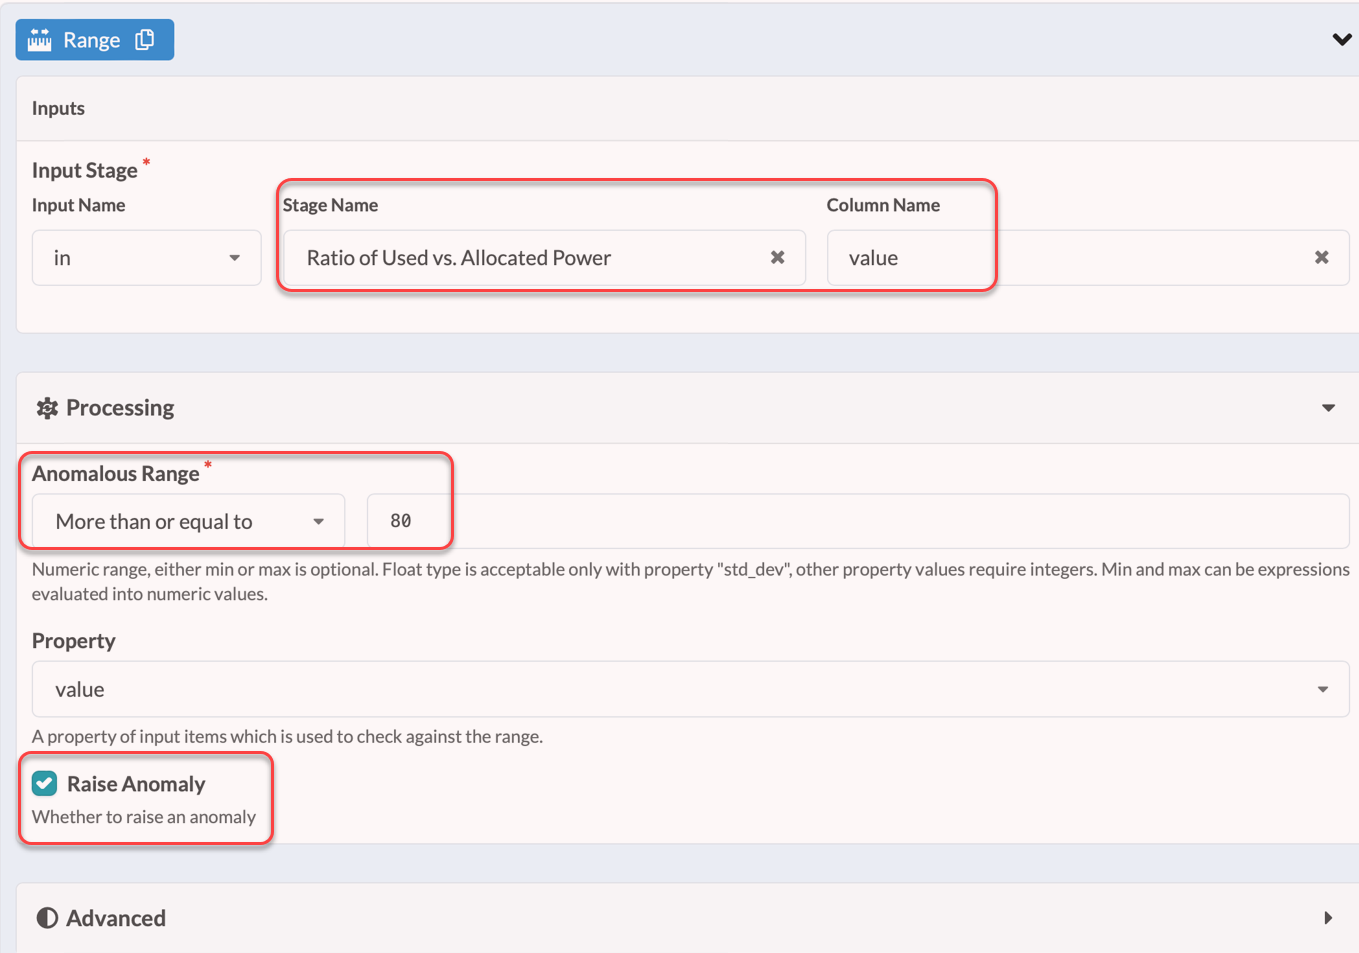
Range processor to set threshold based anomaly
You can create a range processor to generate an alert when a device uses more than 80 percent of its allocated capacity. A range processor checks the value against a defined range.
To create a range processor:
From the Analytical Processor list, under the Check category, select Range. In the Range and Output fields, enter Device with power usage > 80 % capacity.
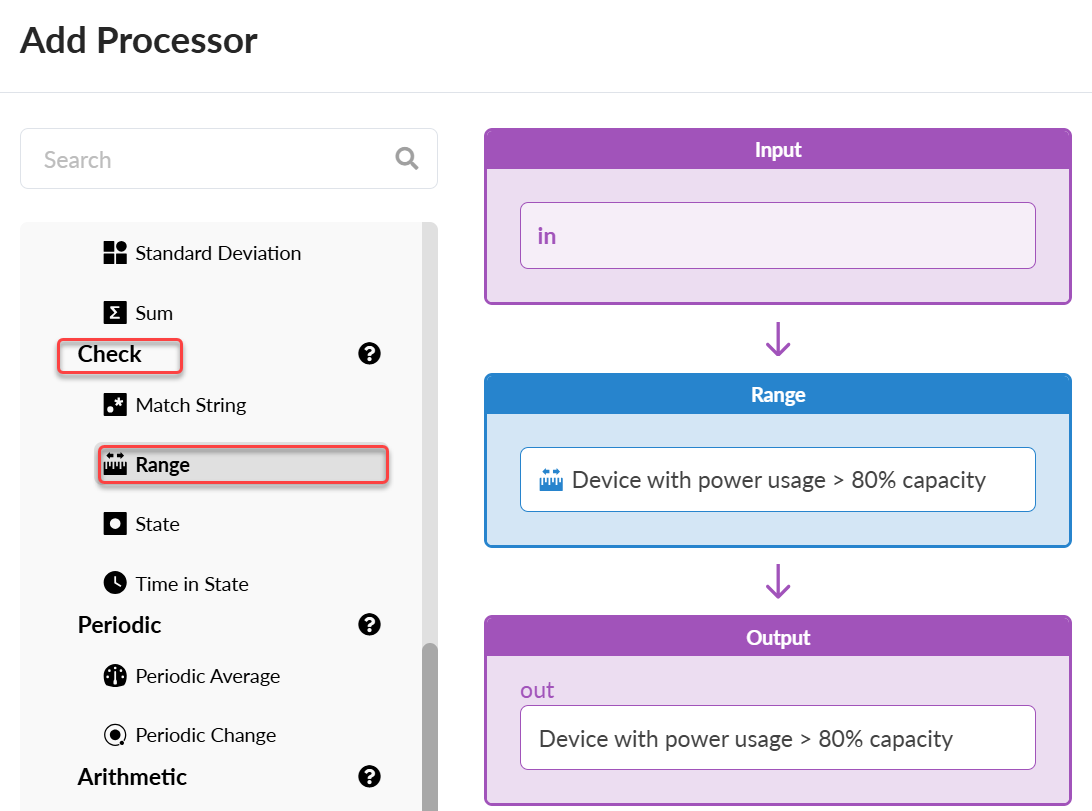
Set the range processor to the ratio of used versus allocated power and specify an anomalous range of 80 percent or more. Check Raise Anomaly to receive alerts in the Apstra GUI when this range is exceeded. This allows for efficient power management and early detection of potential issues.
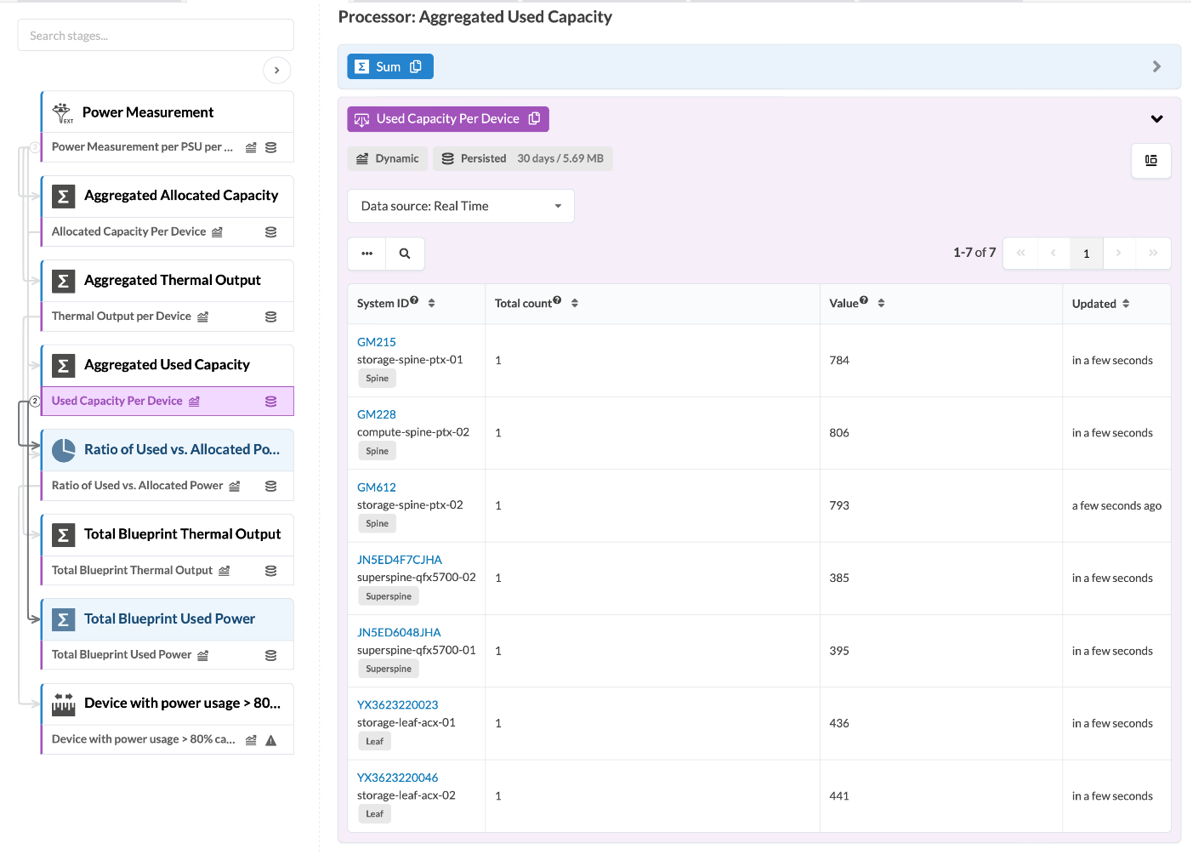
Verify Your Configuration
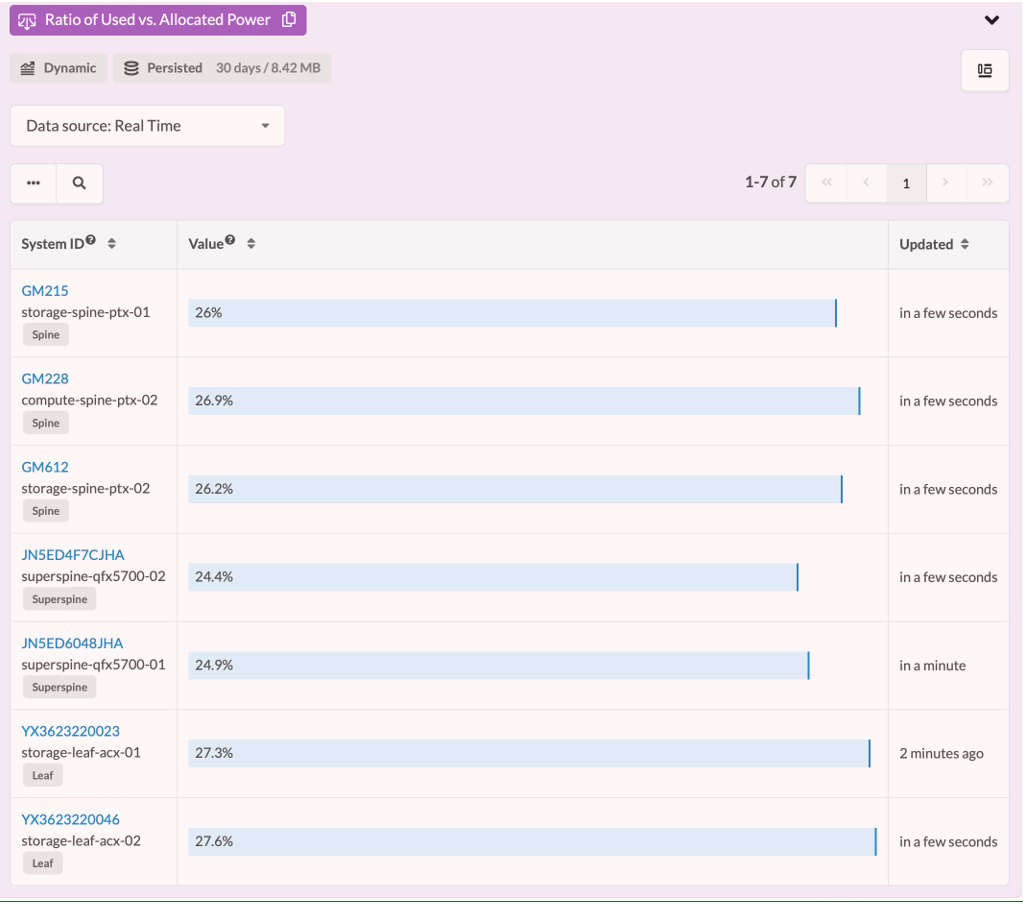
You can view your configuration by selecting your probe from the table under Analytics > Probes. The following example shows the processor we created for Aggregated Used Capacity that details the capacity used for each device.