Monitor the Health of the Telemetry Service
It is important to consider the load on your devices when creating a custom telemetry collection. Telemetry services could overload your devices based on the CLI show commands and collected data. Short intervals for collector execution can also impact impacting traffic forwarding. By default, Apstra provides an IBA telemetry health probe to monitor service health, including customer services and collectors.
To monitor the health of your telemetry service:
-
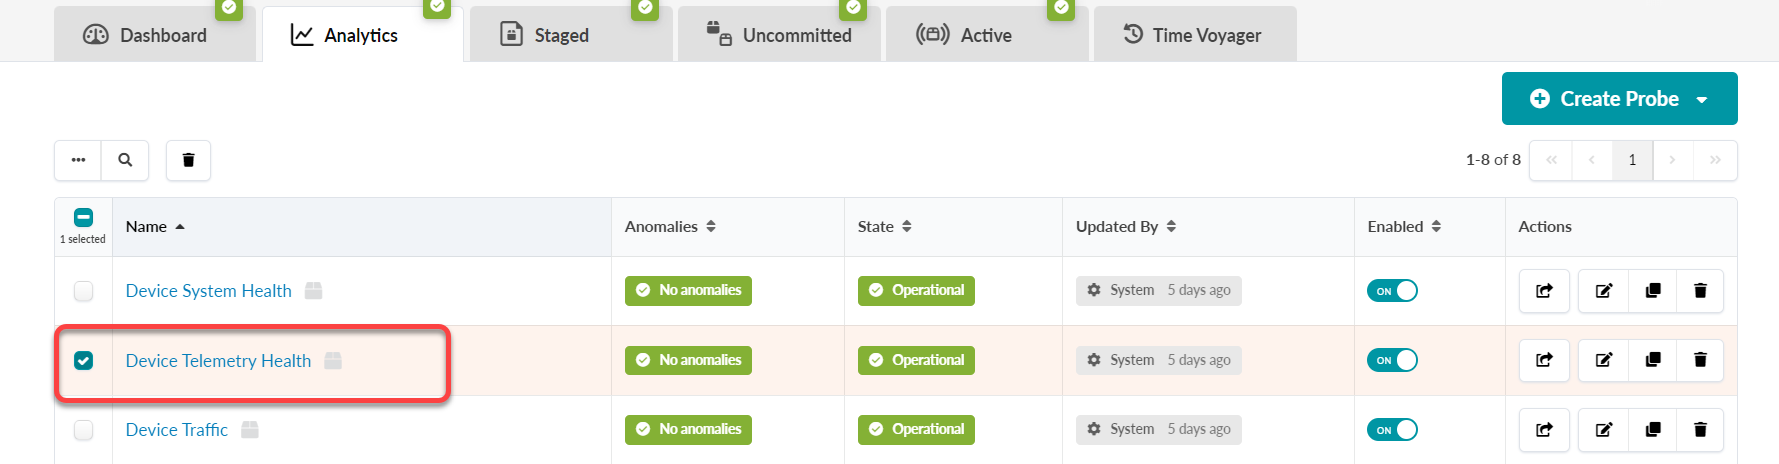
Select the Device Telemetry Health probe from the table.
-
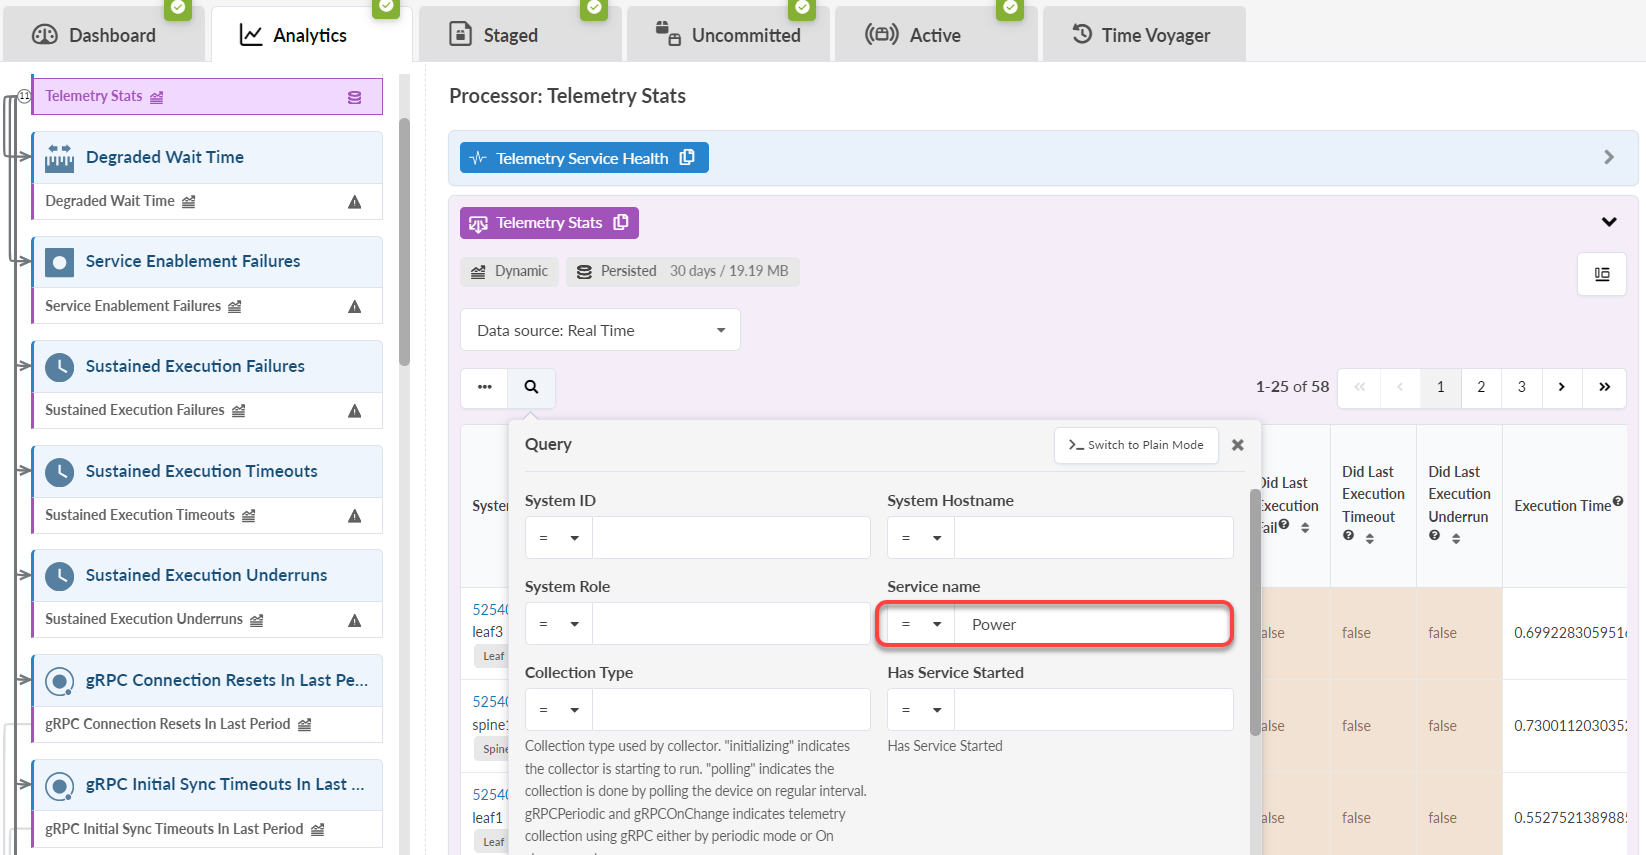
To filter the telemetry health, click the magnifying glass icon.
To display data for your new custom telemetry service, select a service name from the Service name drop-down filter (in this example, Power).
-
Click Apply. The table now shows the health metric for your
custom telemetry service.
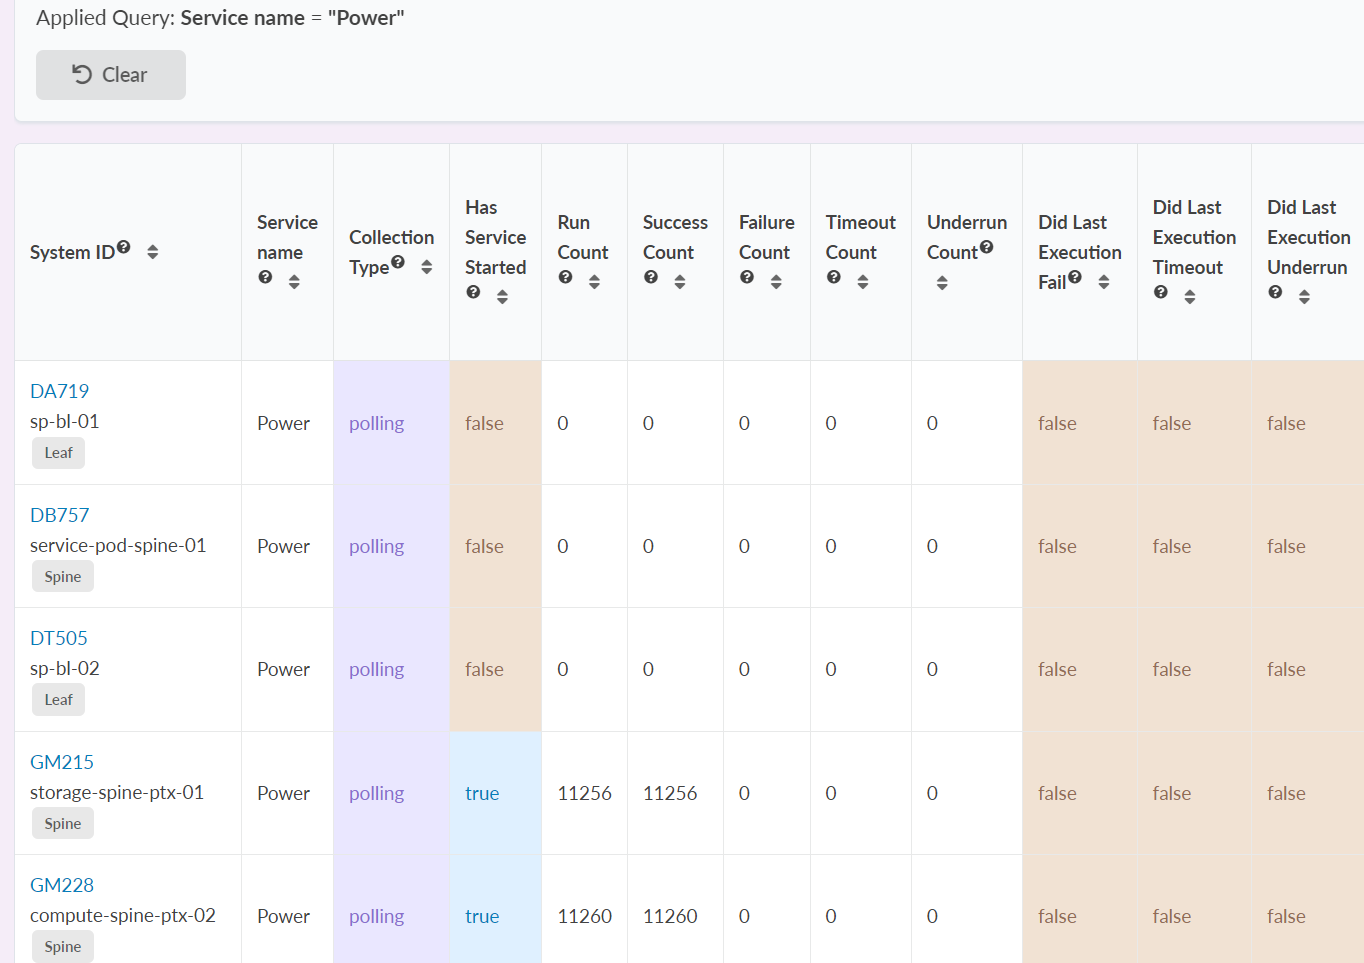
Check the following:
-
Ensure that the Success Count value has increased. If the value remains the same, your service might be failing. Alternatively, your custom collector could be misconfigured.
-
Check the Execution Time.
If the execution time resembles or exceeds the service interval, there might be an issue. If so, adjust your probe settings and increase the service interval. For instructions on setting the service interval, see Create a Probe.
Similarly, a sustained nonzero Waiting Time can indicate that the device is taking too long to complete your service request.
-
-
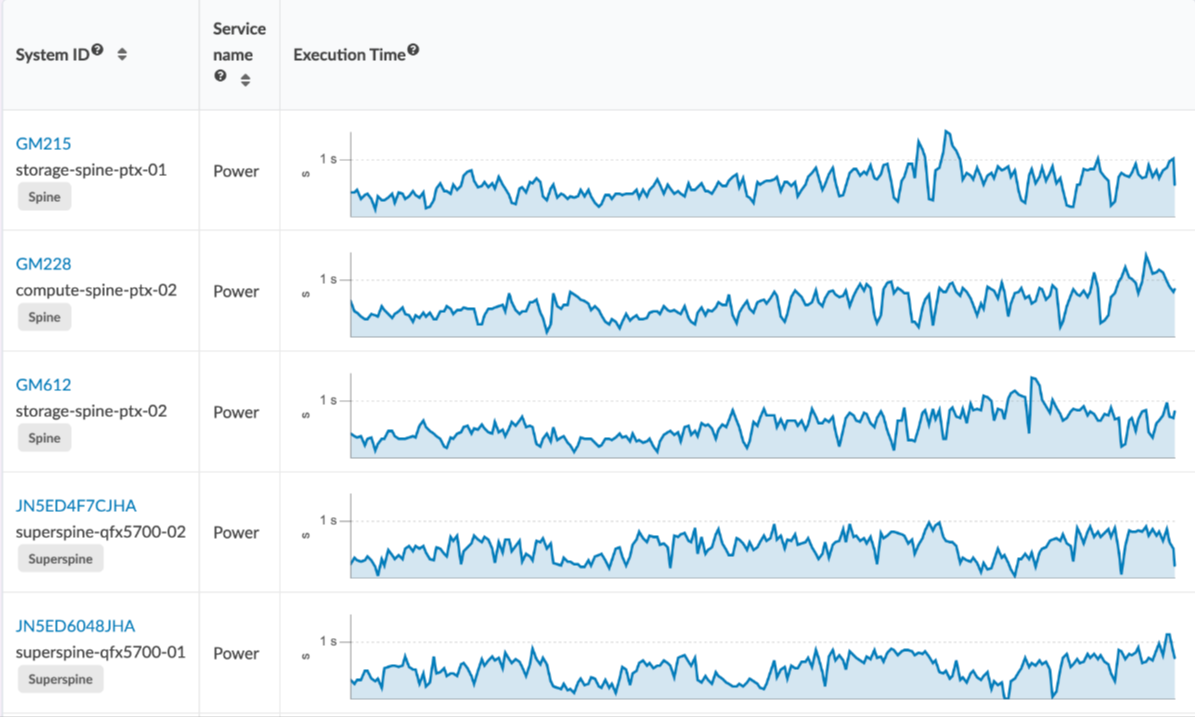
To see how your metrics are trending, switch to Time Series view
under the Data Source drop-down. The following graph shows the
metrics for Power service.
For more information about each of these columns and their definitions, see Telemetry Collection Statistics in the Juniper Apstra User Guide.