Import a CPU and Memory Probe in Apstra for Data Center Assurance
Follow these steps to import a CPU and Memory probe in Apstra. Note that you must import a probe per blueprint on your Data Center Assurance instance for CPU and Memory metrics streaming.
-
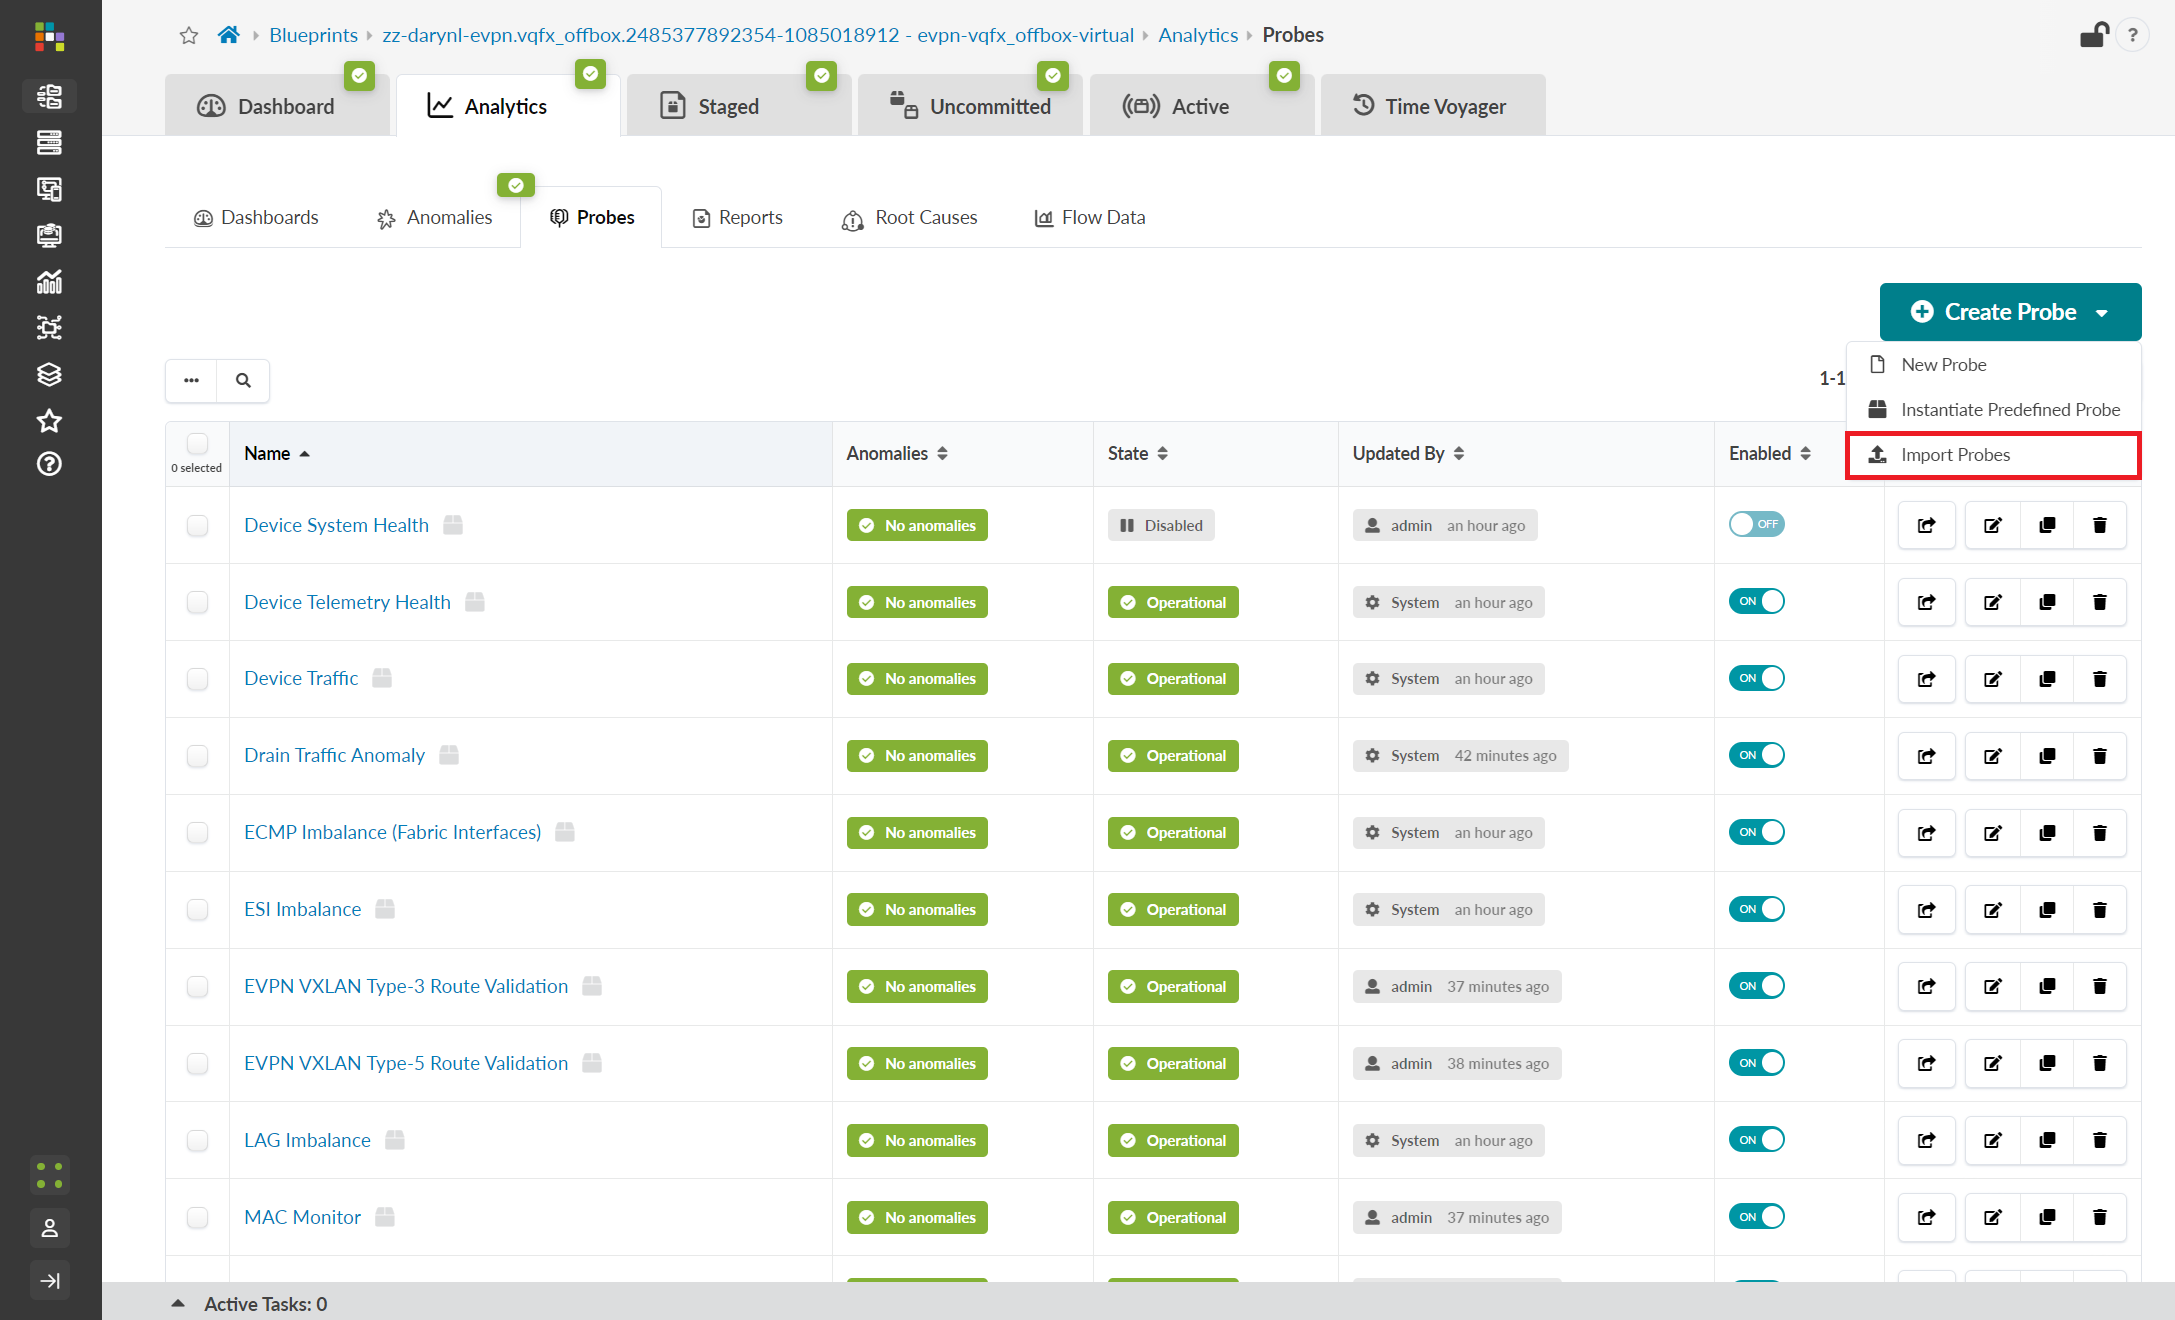
From within your blueprint in the Apstra GUI, navigate to Analytics >
Probes > Create Probe > Import Probes.
Note:
Before proceeding, you must create a blueprint if you don't already have one. For more information, see Create Blueprint.
-
Upload a JSON file with the following content and click Import.
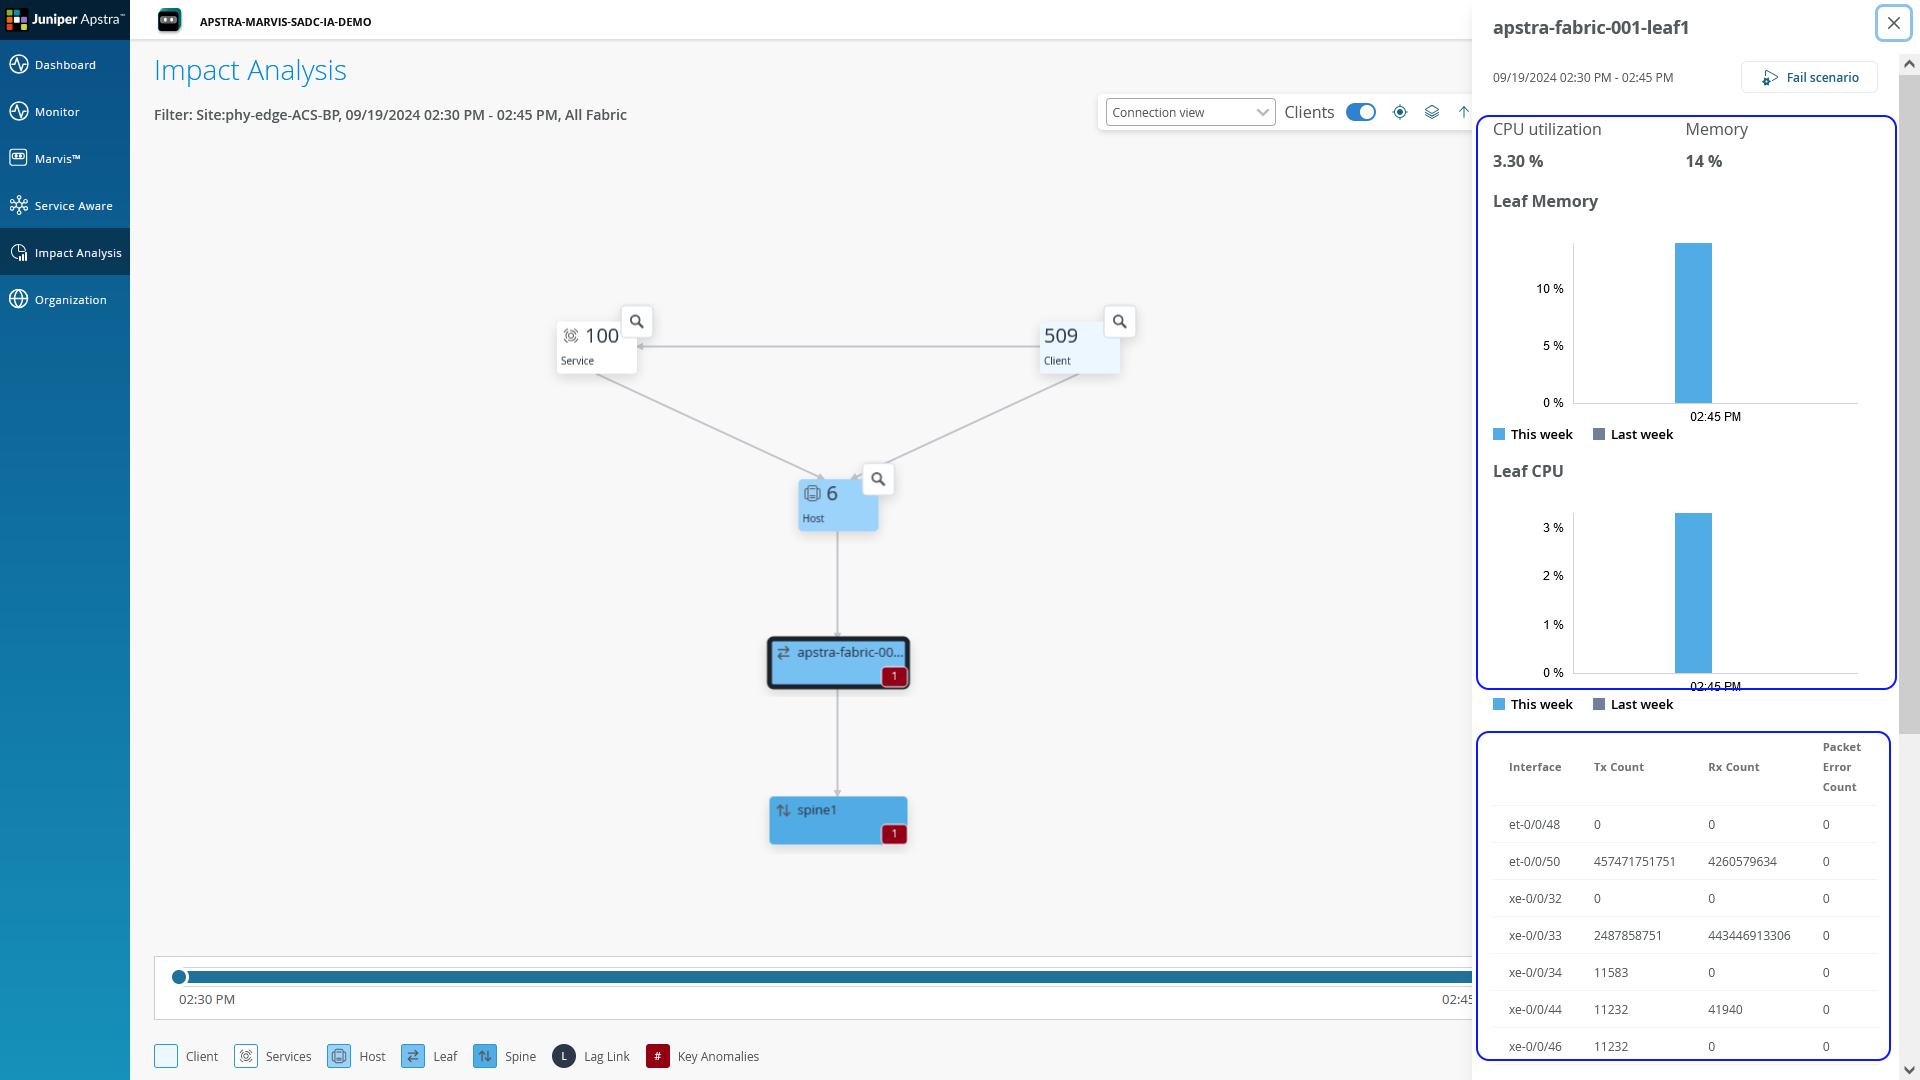
{
    "label": "Stream CPU and Memory Utilization",
    "description": "Probe used to stream cpu and memory utilization from a blueprint in Apstra to the Cloud",
    "processors": [
        {
            "name": "System cpu utilization data",
            "type": "extensible_data_collector",
            "properties": {
                "execution_count": "-1",
                "service_name": "resource_util",
                "query_expansion": {},
                "service_interval": "10",
                "enable_streaming": true,
                "system_id": "system.system_id",
                "query_tag_filter": {
                    "filter": {},
                    "operation": "and"
                },
                "graph_query": "node('system', name='system', role=is_in(['leaf', 'access', 'spine', 'superspine']), deploy_mode=is_in(['deploy', 'drain']))",
                "keys": [
                    "metric"
                ],
                "query_group_by": [],
                "ingestion_filter": {},
                "data_type": "number",
                "service_input": "''",
                "metric": "'system_cpu_utilization'"
            },
            "inputs": {},
            "outputs": {
                "out": "System cpu utilization data"
            }
        },
        {
            "name": "System memory utilization data",
            "type": "extensible_data_collector",
            "properties": {
                "execution_count": "-1",
                "service_name": "resource_util",
                "query_expansion": {},
                "service_interval": "10",
                "enable_streaming": true,
                "system_id": "system.system_id",
                "query_tag_filter": {
                    "filter": {},
                    "operation": "and"
                },
                "graph_query": "node('system', name='system', role=is_in(['leaf', 'access', 'spine', 'superspine']), deploy_mode=is_in(['deploy', 'drain']))",
                "keys": [
                    "metric"
                ],
                "query_group_by": [],
                "ingestion_filter": {},
                "data_type": "number",
                "service_input": "''",
                "metric": "'system_memory_utilization'"
            },
            "inputs": {},
            "outputs": {
                "out": "System memory utilization data"
            }
        }
    ],
    "stages": [
        {
            "description": "System memory utilization percentage",
            "enable_metric_logging": false,
            "retention_size": 0,
            "name": "System memory utilization data",
            "graph_annotation_properties": {},
            "retention_duration": 2592000,
            "units": {
                "value": "%"
            }
        },
        {
            "description": "System cpu utilization percentage",
            "enable_metric_logging": false,
            "retention_size": 0,
            "name": "System cpu utilization data",
            "graph_annotation_properties": {},
            "retention_duration": 2592000,
            "units": {
                "value": "%"
            }
        }
    ]
}
The new probe appears in the Probes view. The probe automatically starts streaming metrics data to the Apstra Edge. The Edge forwards that information for use by Data Center Assurance.The CPU and memory metrics should now be visible in the Data Center Assurance GUI in the Service Aware topology view. Select a topology device to view CPU and memory metrics.