Intent-Based Analytics with apstra-cli Utility
IBA with apstra-cli Overview
You can work with Intent-based analytics (IBA) from the Apstra GUI, or for non-production environments you can use the experimental apstra-cli utility (formerly called aos-cli). For information about how to use IBA probes from the GUI, see Probes Introduction in the Analytics section. This guide shows you how to use apstra-cli.
The apstra-cli utility is an experimental tool and has limited support. Do not use it in production environments unless advised by Juniper Support. Some versions of apstra-cli are not intended for certain Apstra releases. Some apstra-cli commands may or may not work between different Apstra releases. It's always best to test a version of apstra-cli with a specific Apstra release in a non-production environment, or contact Juniper Support for assistance.
The apstra-cli utility enables you to extract information from the Apstra server for analytics (and other functionalities). The workflow for IBA probes is as follows:
- Install apstra-cli.
- Install packages.
- Create device agent profiles.
- Install device agents.
- Install IBA probes.
After probes are instantiated you can use Syslog to send messages to Syslog servers.
Install apstra-cli
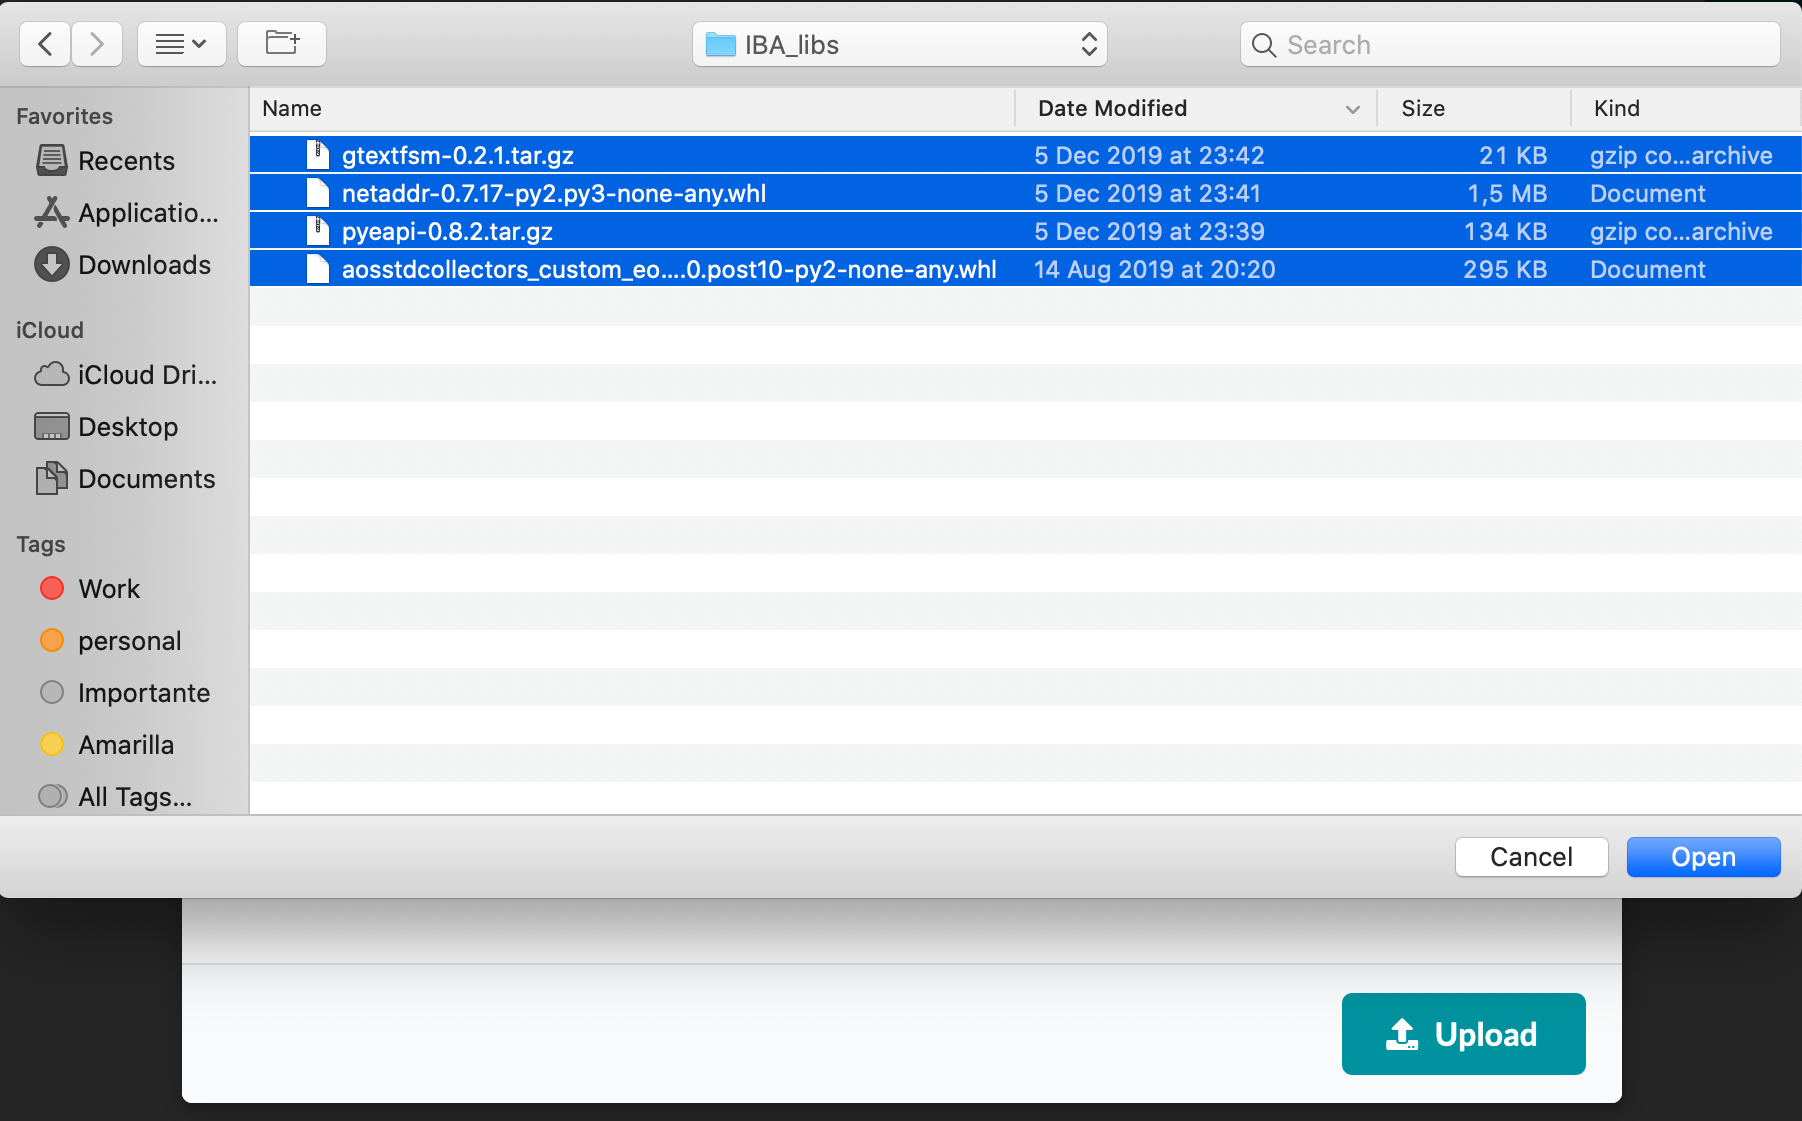
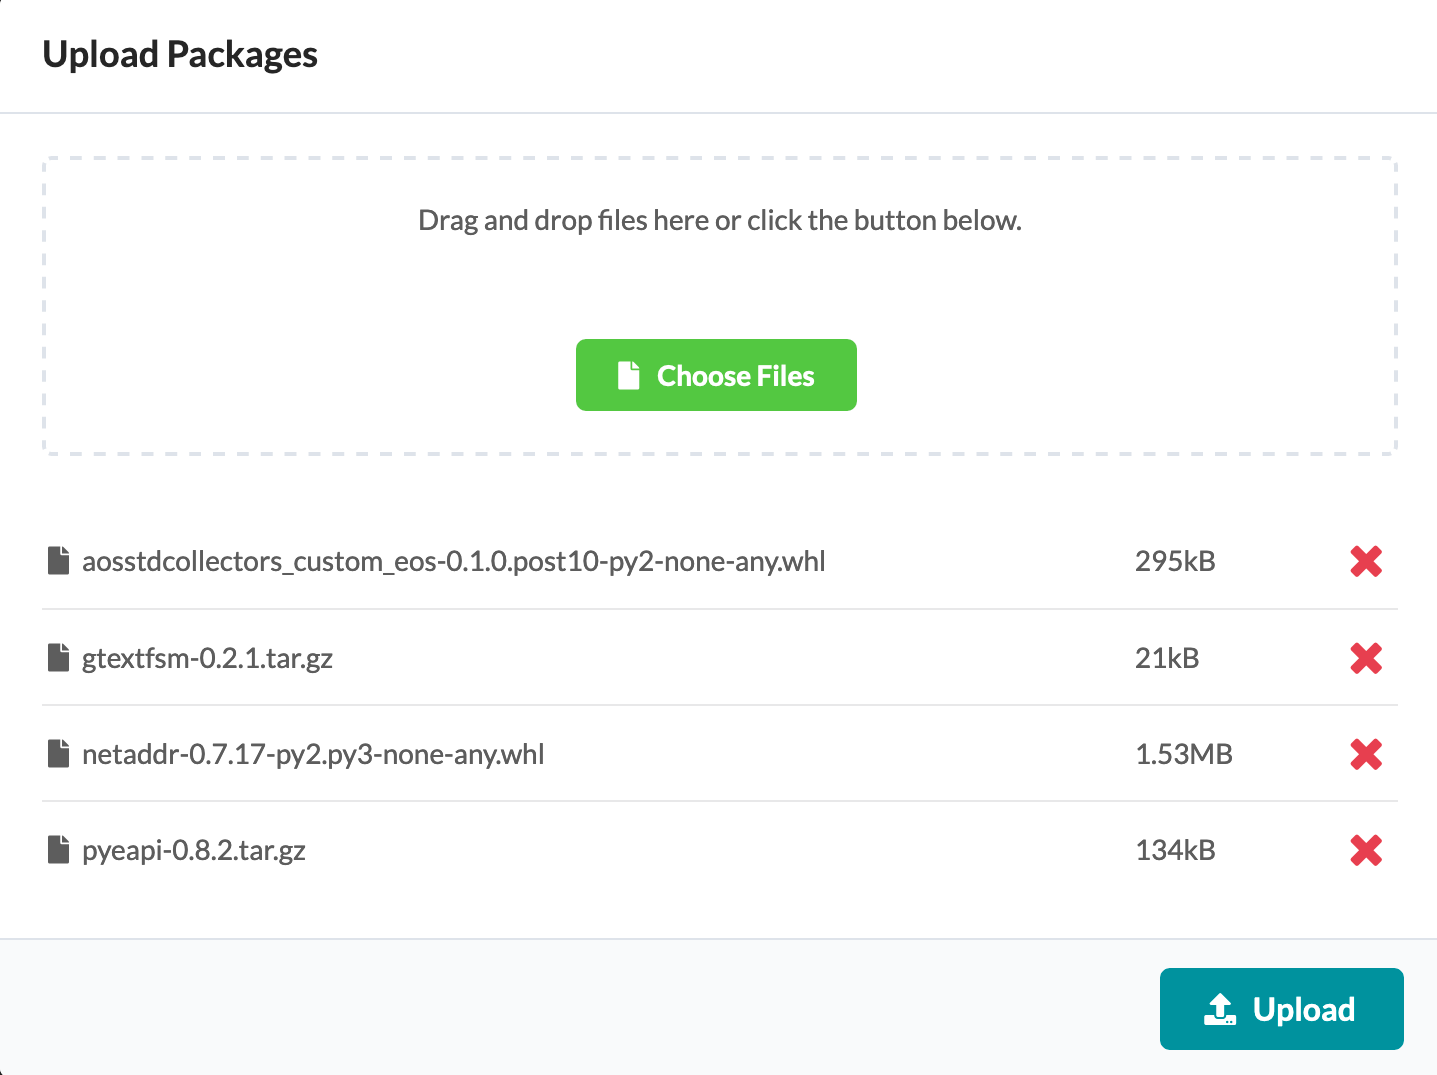
Install Packages
Create Agent Profiles
With agent profiles you can specify packages once in the profile, then apply the profile to multiple agents at the same time. Let's create a profile that contains all four packages. (Remember, if your environment has Internet access, you only need to include the custom collector package.)
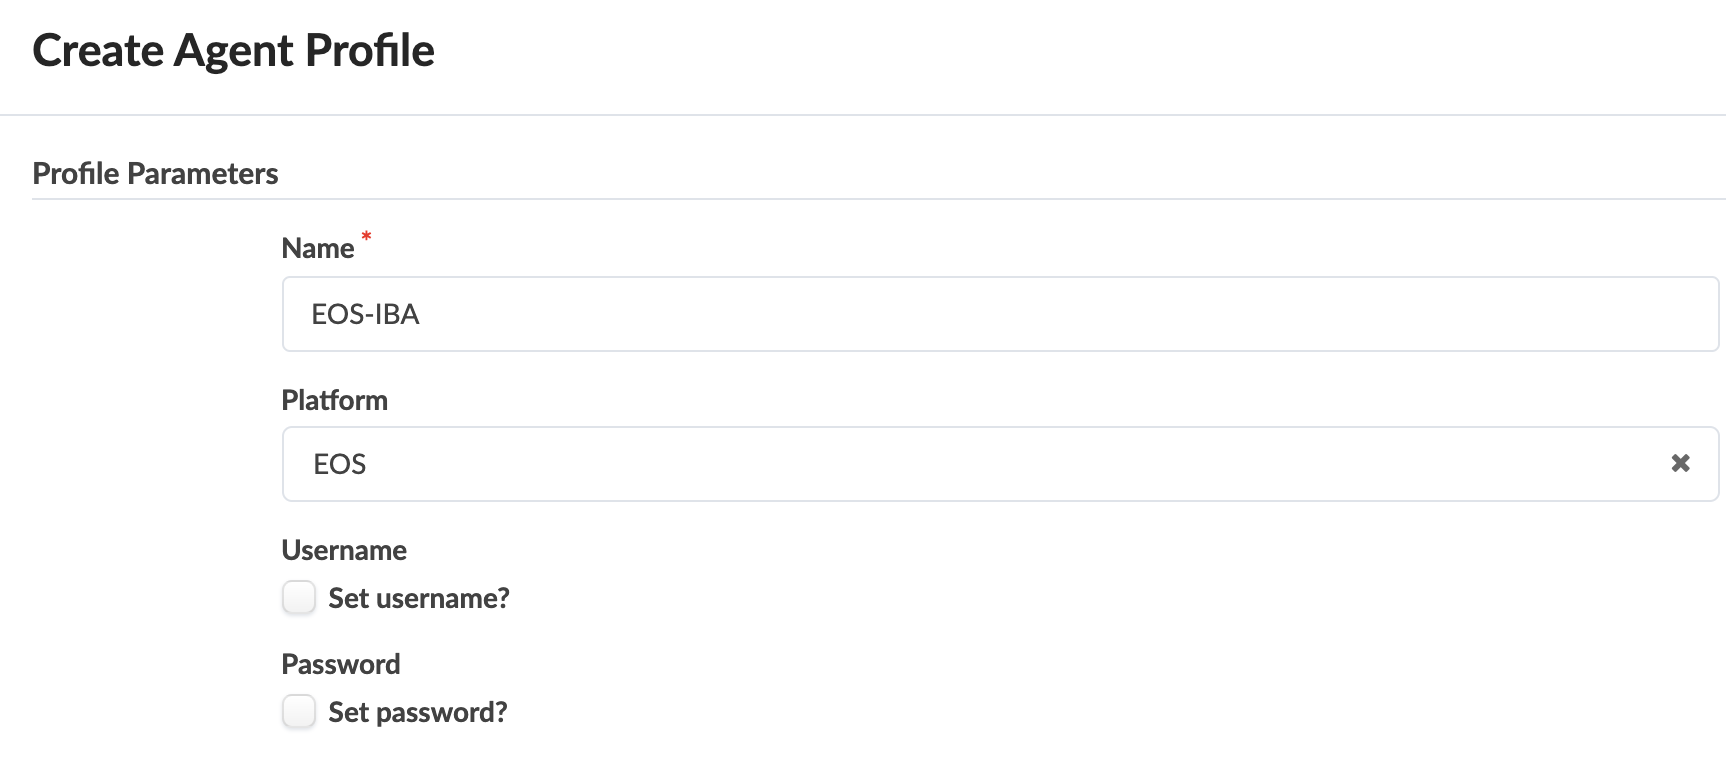
- From the left navigation menu, navigate to Devices > System Agents > Agent Profiles and click Create Agent Profile.
-
For this example, select EOS from the platform
drop-down list.
-
In the Packages section, select the four
uploaded packages to associate them with the agent profile. (If your
environment has Internet access, you only need to include the custom
collector package.)
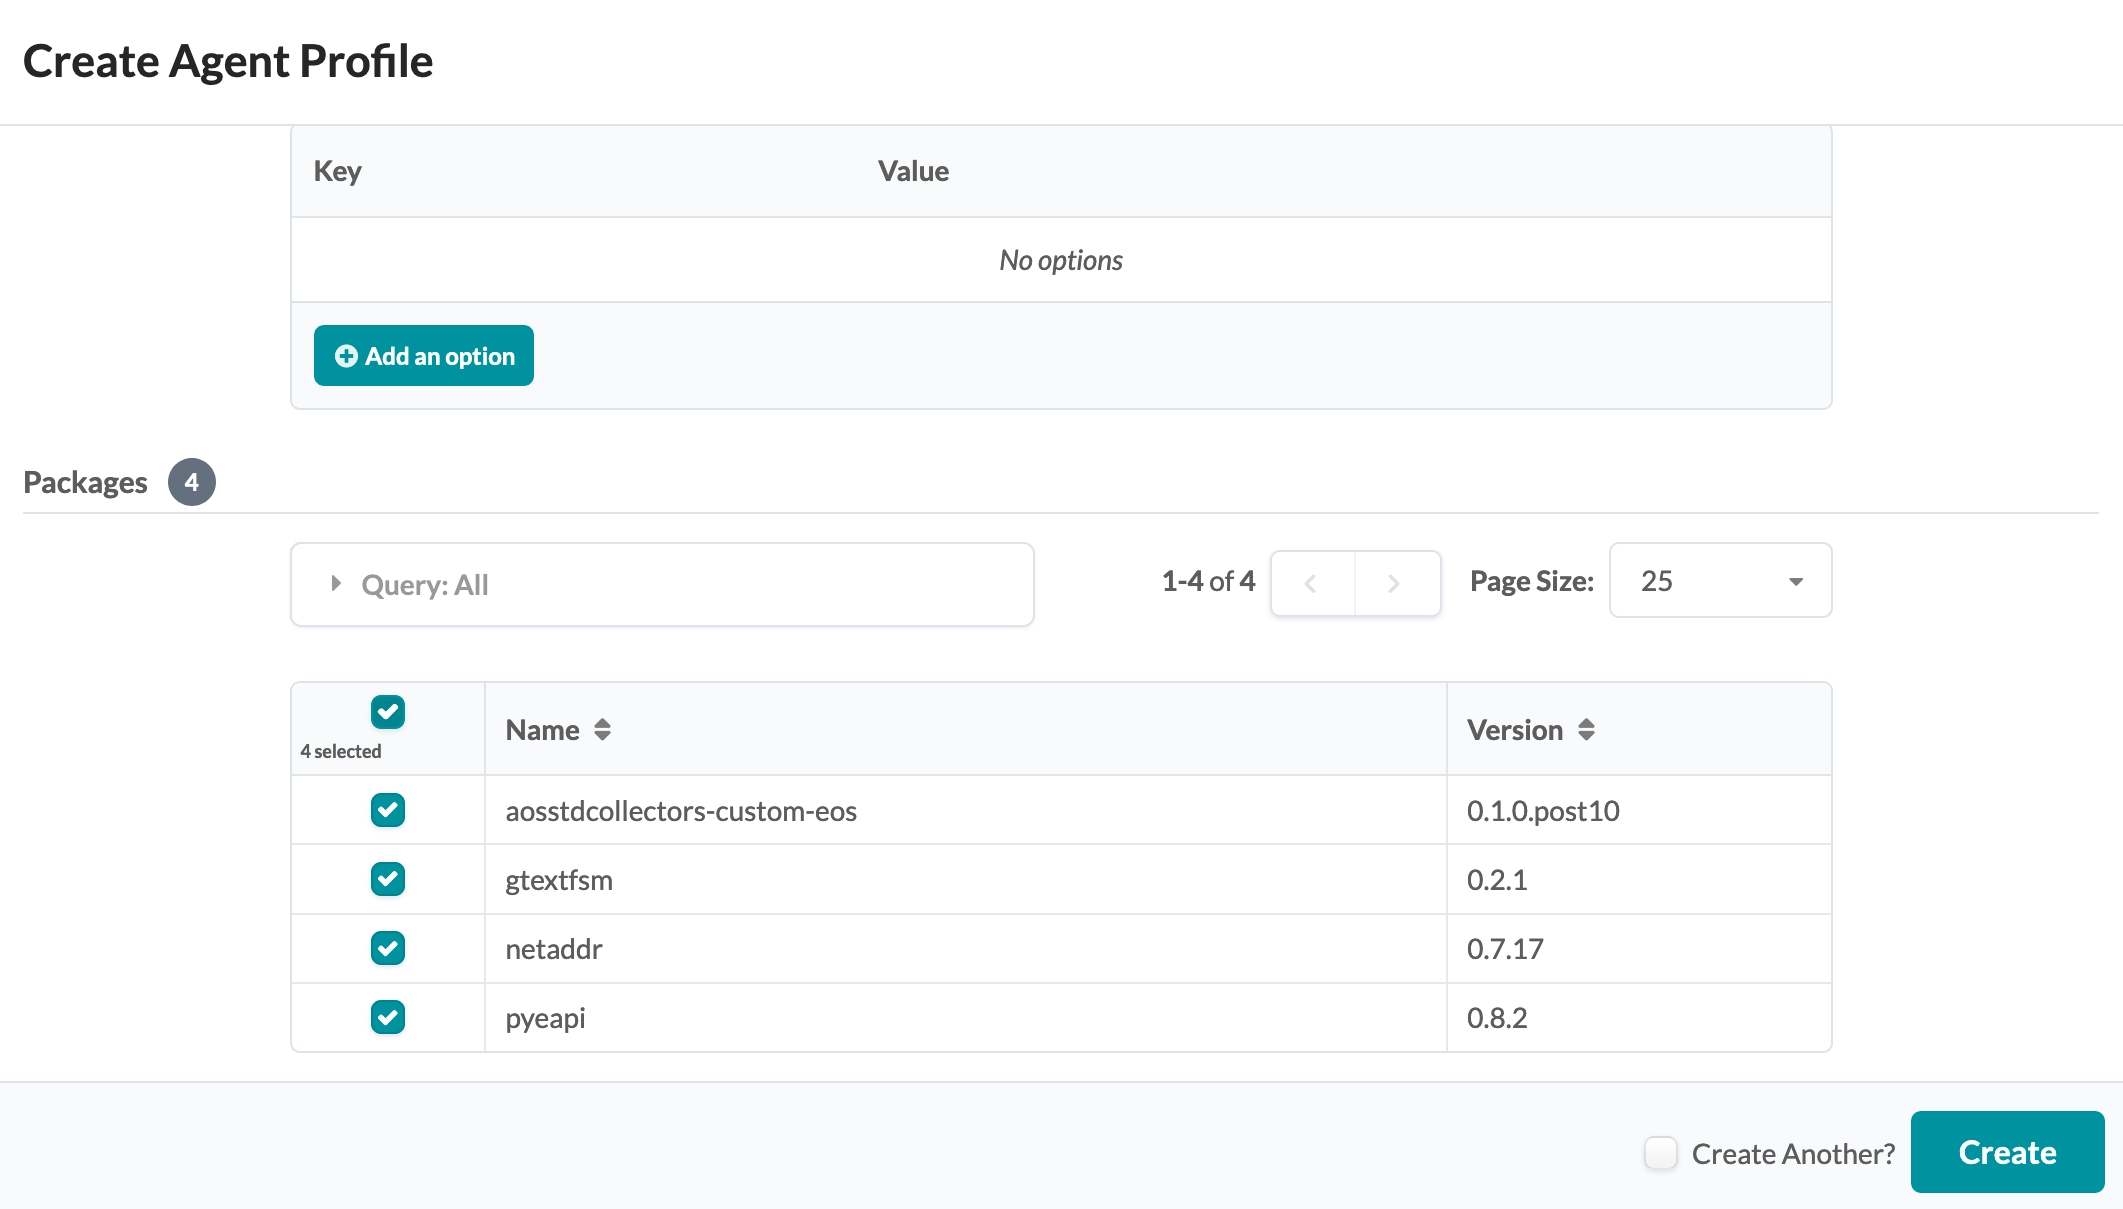
- Click Create to create the agent profile and return to the summary table view.
For more information about agent profiles, see Agent Profiles.
Create Agents
Now let's create agents for Arista devices and use the agent profile to associate the packages to them. We recommend that you use agent profiles to associate custom collector packages so you can bulk update agents later, as needed, with a single command.
- From the left navigation menu, navigate to Devices > System Agents > Agents and click Create Onbox Agent(s).
-
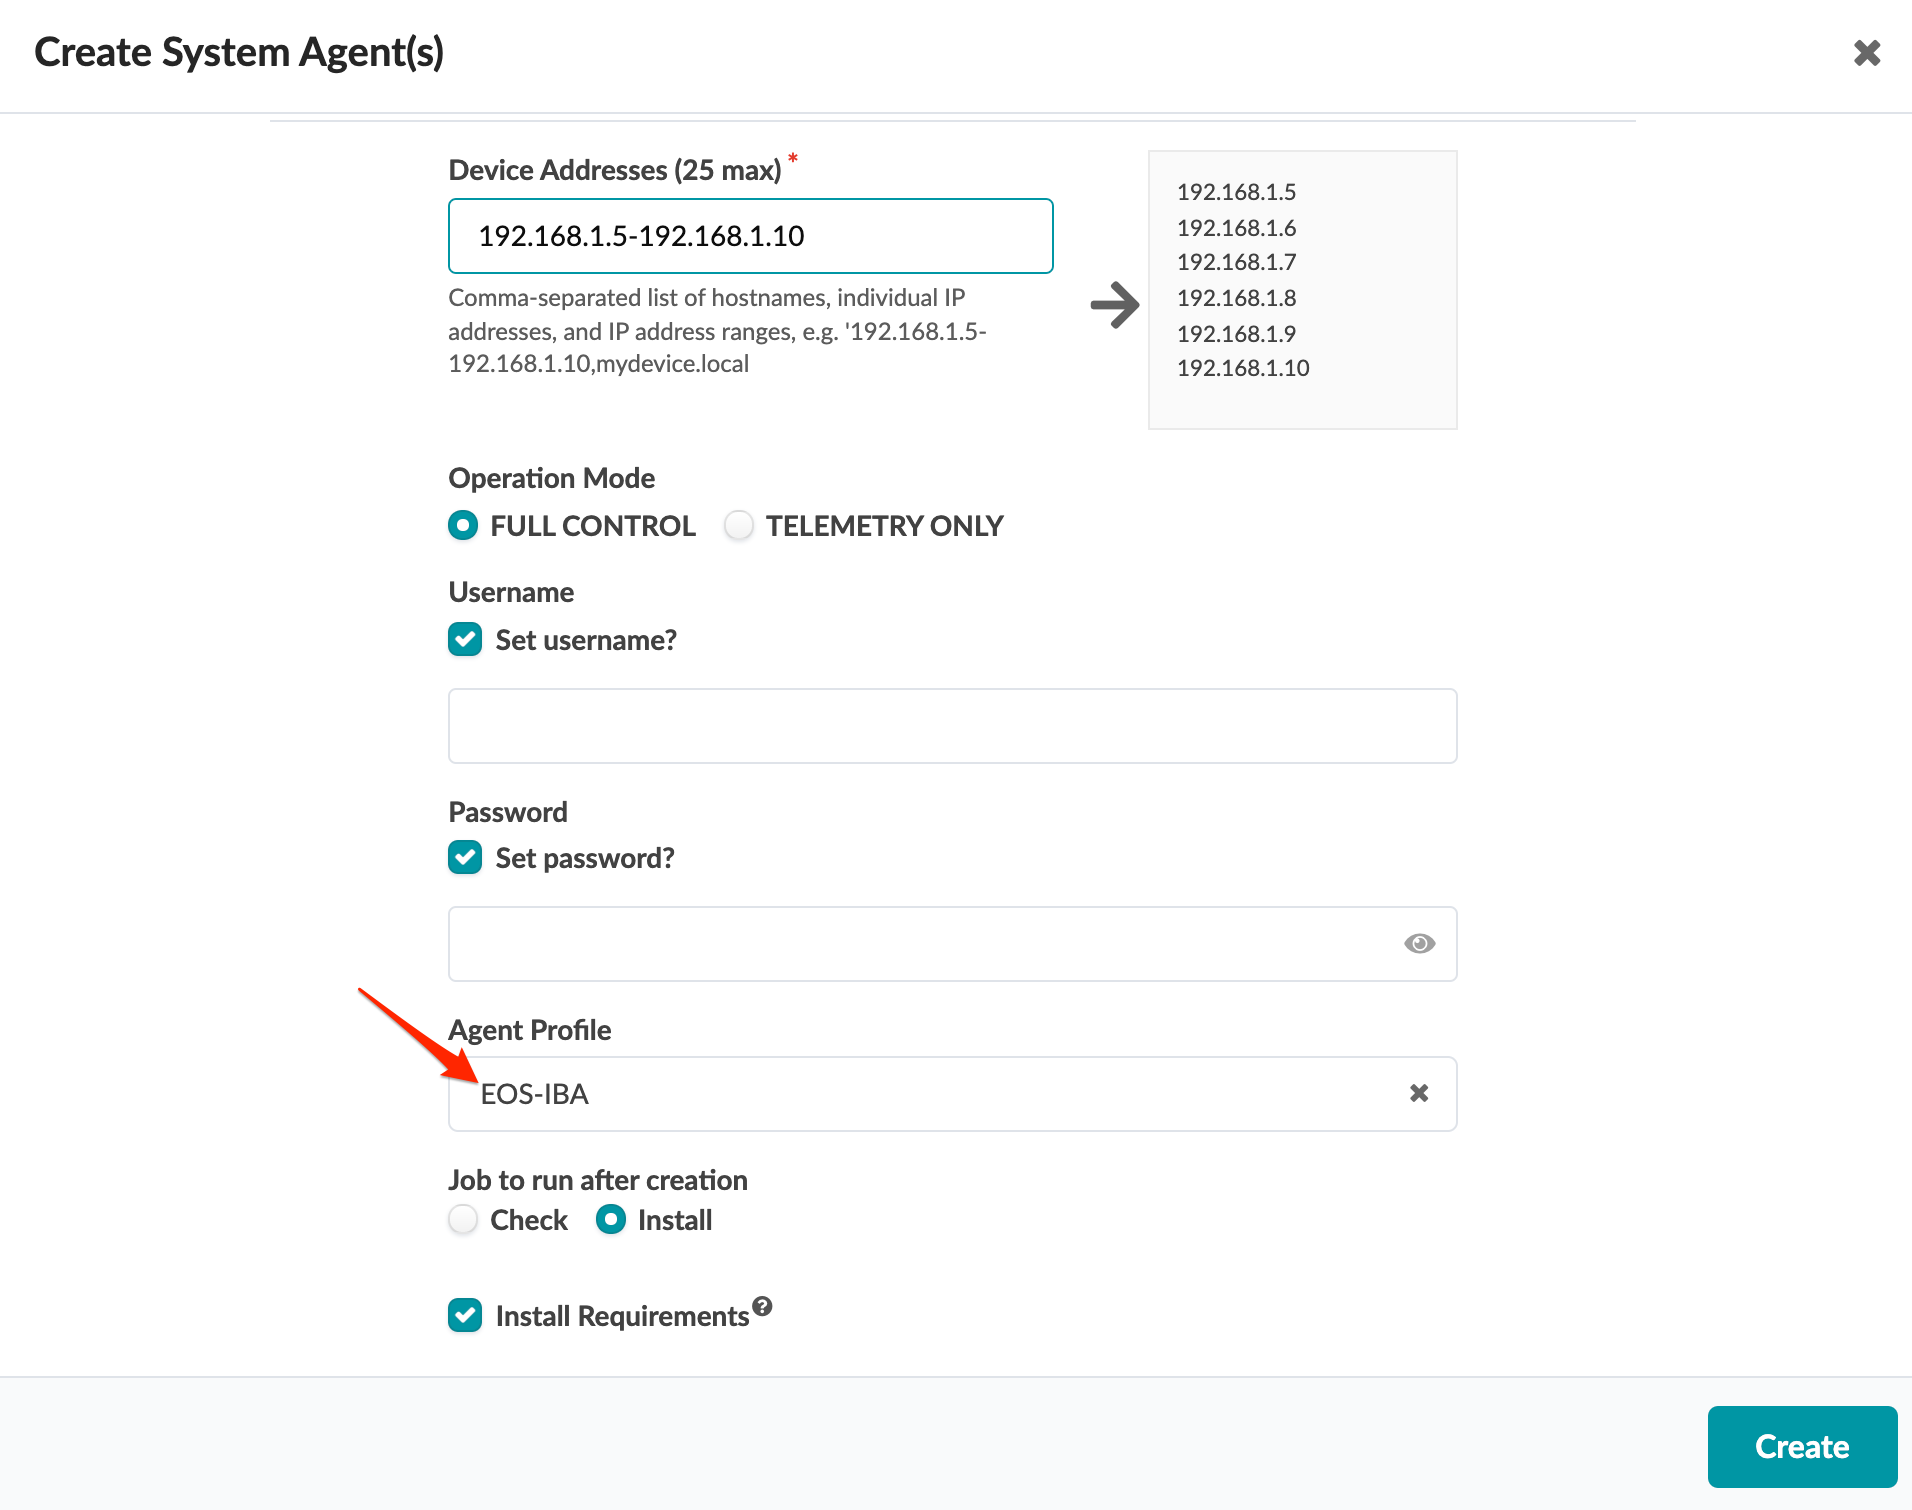
Enter details for the agent and select the agent profile from the drop-down
list as shown in the image below:
-
To verify that packages have been successfully installed on agents, from
the left navigation menu, navigate to Devices > Managed
Devices and click the management IP of the device. Click the
Agent tab. The Config
section lists any installed packages. If you manually uploaded the Python
packages (netaddr, gtextfsm and pyeapi) they are listed. If the Apstra
server has Internet access, they were automatically uploaded and won't be
listed here. (To see all packages installed on the device, log in to the
device and check the
/tmp/pluginsfolder.)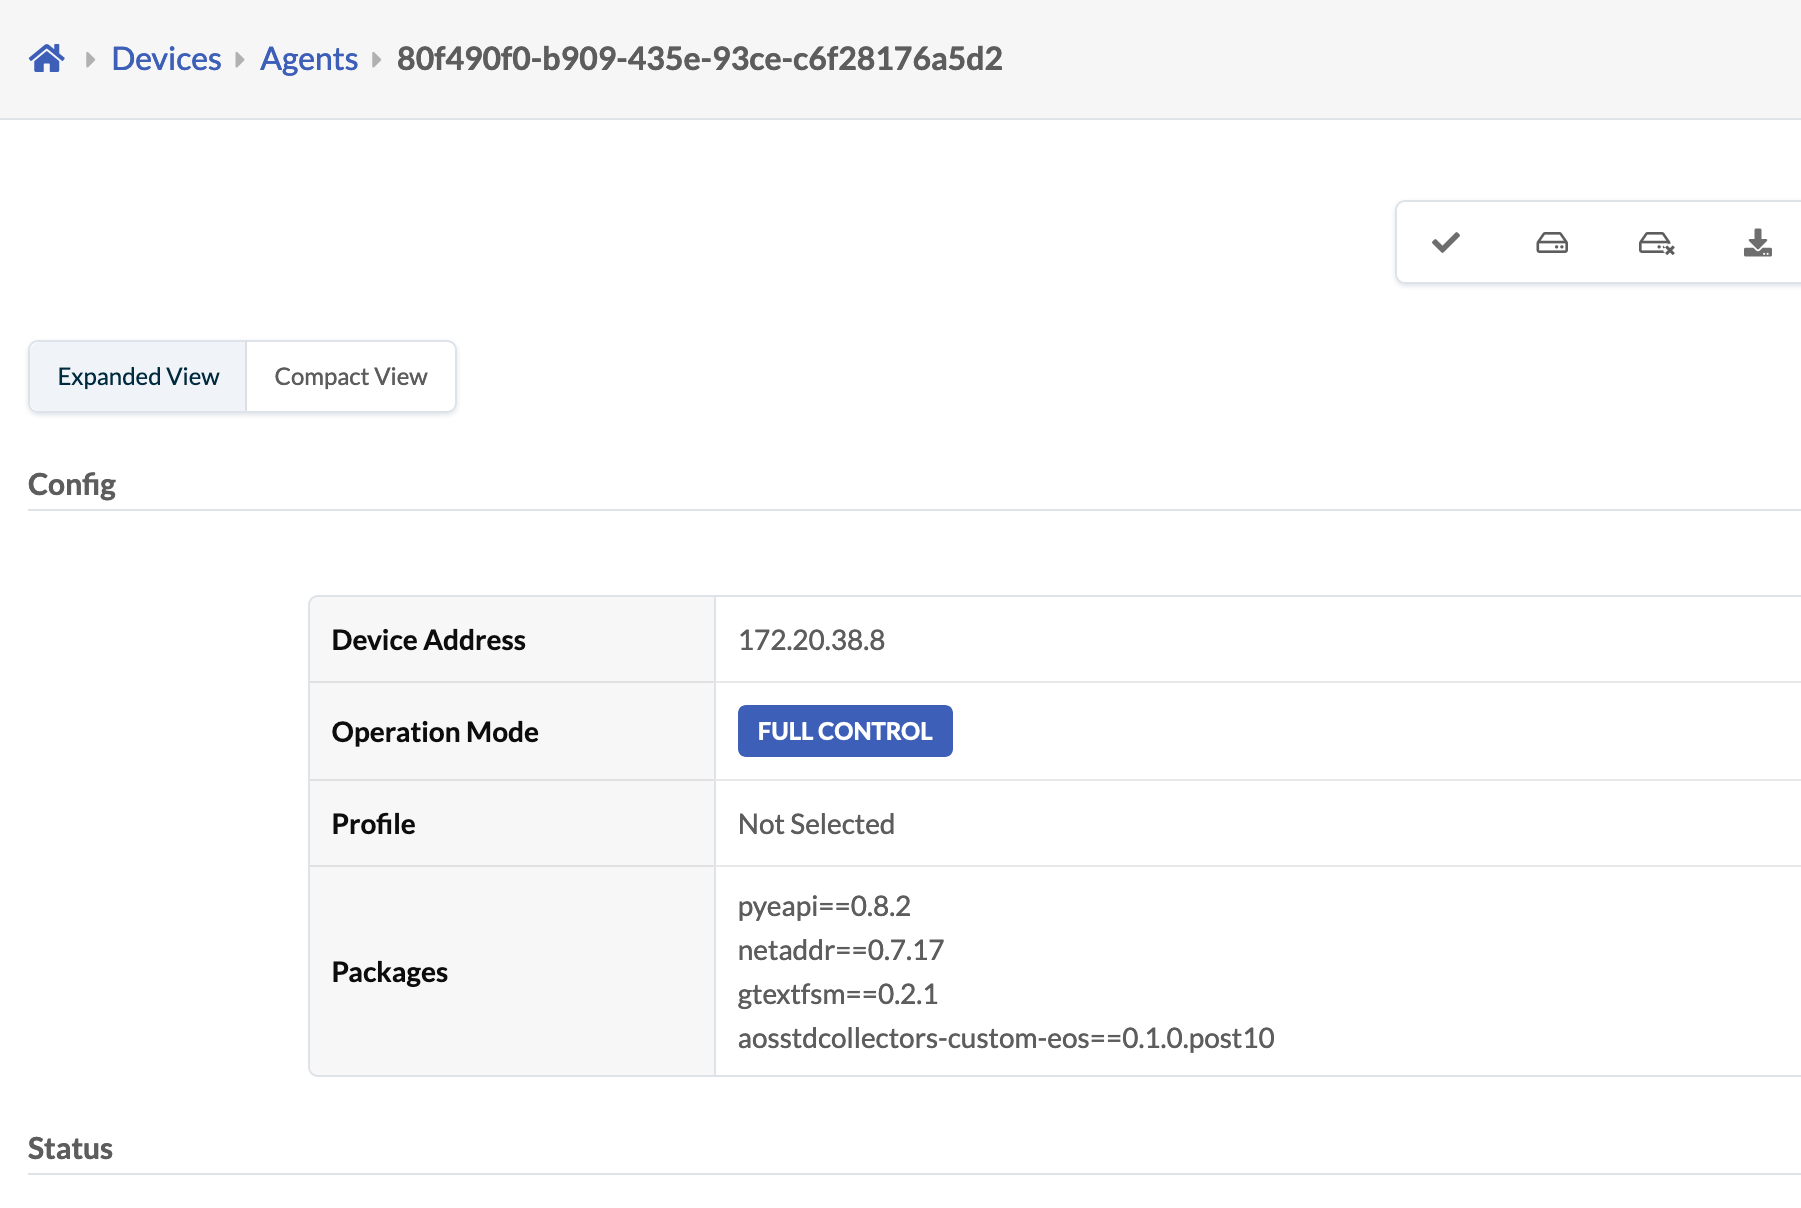
Update Agents from apstra-cli
As of apstra-cli build 423, you can update agents with a given agent profile, as needed, based on IP/ID or OS type (os_type) (for example, EOS).
To update agents by IP range with a specific agent profile, use the command
system-agents update-profile as shown in the example below.
When setting the --profile option, apstra-cli shows available agent
profiles. To select, use the up and down arrow keys.
apstra-cli> system-agents update-profile --ip 172.20.120.6-11 --profile
                                                                  EOS-IBA  EOS
For example.
apstra-cli> system-agents update-profile --ip 172.20.120.6-11 --profile 692bb0bb-c5e0-4d7e-a70c-c24b0d5650a8
Successfully updated agent 172.20.120.9 with given profile
Successfully updated agent 172.20.120.6 with given profile
Successfully updated agent 172.20.120.11 with given profile
Successfully updated agent 172.20.120.7 with given profile
Successfully updated agent 172.20.120.10 with given profile
Successfully updated agent 172.20.120.8 with given profile
apstra-cli>
Install IBA Probes
You can install IBA probes using the Apstra GUI, or for non-production environments you can use apstra-cli. For information about how to create or instantiate predefined probes from the GUI, see Probes Introduction in the Analytics section. This section shows you how to use the apstra-cli utility.
All probes described in this document are included in apstra-cli build 412 and later.
Probe .j2 files may be made available if the probe file is not
built into the apstra-cli build.
Some of these probes require an updated service registry. Download the latest Apstra
SDK and extract the json-schemas.tar.gz file. Copy the file to the
/home/admin directory of the Apstra server so it is available
in the apstra-cli /mytmp directory.
apstra-cli> service-registry import-from --file /mytmp/json-schemas.tar.gz
Successfully imported service registry entry for interface_details
Successfully imported service registry entry for route_count
Successfully imported service registry entry for multicast_groups
Successfully imported service registry entry for sfp
Successfully imported service registry entry for resource_usage
Successfully imported service registry entry for mlag_domain
Successfully imported service registry entry for stp
Successfully imported service registry entry for vtep_counters
Successfully imported service registry entry for vlan
Successfully imported service registry entry for evpn_type5
Successfully imported service registry entry for ping
Successfully imported service registry entry for vxlan_info
Successfully imported service registry entry for pim_neighbor_count
Successfully imported service registry entry for lldp_details
Successfully imported service registry entry for evpn_type3
Successfully imported service registry entry for multicast_info
Successfully imported service registry entry for bgp_vrf
Successfully imported service registry entry for traceroute
Successfully imported service registry entry for vrf
Successfully imported service registry entry for table_usage
Successfully imported service registry entry for vxlan_address_table
Successfully imported service registry entry for acl_stats
Successfully imported service registry entry for device_info
Successfully imported service registry entry for power_supply
Successfully imported service registry entry for interface_buffer
Successfully imported service registry entry for pim_rp
Successfully imported service registry entry for anycast_rp
Successfully imported service registry entry for bgp_iba
Successfully imported service registry entry for interface_iba
apstra-cli>
To create probes, use the probe create apstra-cli command. You'll be
prompted for additional options.
apstra-cli> probe create
--blueprint           Id of the blueprint
--file                Filename of json file with probe data. Choose from dropdown or specify custom path
--skip-service-check  [Optional] By default, required telemetry services are checked and enabled on target
--check-status        [Optional] Wait for probe to become operational. Default: False
--service-interval    When skip-service-check is False and service is not alreadypresent, this indicates
To select the blueprint ID, use --blueprint and tab-completion.
apstra-cli> probe create --blueprint 67cd936d-c2de-49f8-8708-df465f0cdc68
                              L2 Virtual  two_stage_l3clos
To list available probes supplied with apstra-cli, use --file and
tab-completion. Scroll through the list with the up and down arrow keys.
apstra-cli> probe create --blueprint 67cd936d-c2de-49f8-8708-df465f0cdc68 --file
                                                                      evpn.j2
                                                                      sfp.j2
                                                                      memory_usage_threshold_anomalies.j2
                                                                      bandwidth_utilization_history.j2
                                                                      power_supply_anomalies.j2
                                                                      virtual_infra_vlan_mismatch.j2
                                                                      hardware_vtep_counters_enabled.j2
Some probes need additional Probe template variables.
apstra-cli> probe create --blueprint 67cd936d-c2de-49f8-8708-df465f0cdc68 --file /usr/local/lib/python2.7/site-packages/aos_cli/resources/probes/memory_usage_threshold_anomalies.j2
--skip-service-check  [Optional] By default, required telemetry services are checked and enabled on target
--check-status        [Optional] Wait for probe to become operational. Default: False
--service-interval    When skip-service-check is False and service is not alreadypresent, this indicates
--process             Probe template variable
--os_family           Probe template variable
To see installed IBA probes in the blueprint, navigate to Analytics > Probes.
Apstra IBA Probes Examples
The following section describes how to install some of the most interesting probes which are not available by default.
Packet Drops
Packet drop IBA probes detect an abnormal amount of packet drops on device interfaces that the Apstra software manages, based on interface telemetry that device agents collect.
| Filename | Description |
|---|---|
| pkt_discard_anomalies.j2 | Detect Fabric interfaces having sustained packet discards |
To install the pkt_discard_anomalies.j2 IBA Probe:
apstra-cli> probe create --blueprint 67cd936d-c2de-49f8-8708-df465f0cdc68 --file /usr/local/lib/python2.7/site-packages/aos_cli/resources/probes/pkt_discard_anomalies.j2
Ensuring needed telemetry services for probe are enabled...
Successfully created probe f472ba21-d60f-44dc-9f5d-8318c8b9c07b in blueprint 67cd936d-c2de-49f8-8708-df465f0cdc68
apstra-cli>
Switch Memory Leak (Arista EOS only)
Switch Memory Leak IBA probes detect abnormal memory leaks in specified processes on devices that the Apstra software manages, based on system telemetry that device agents collect. This probe requires device user credentials set in the device agent configuration that has login and access to the device BASH prompt.
| Filename | Description |
|---|---|
| memory_usage_threshold_anomalies.j2 | Detect memory leaks in specified process on all switches in the Fabric |
| system_memory_usage_threshold_anomalies.j2 | Detect switches having potential memory leaks in the Fabric |
The memory_usage_threshold_anomalies.j2 IBA probe requires
additional "Probe template variables" for os_family and
process.
apstra-cli> probe create --blueprint 67cd936d-c2de-49f8-8708-df465f0cdc68 --file /usr/local/lib/python2.7/site-packages/aos_cli/resources/probes/memory_usage_threshold_anomalies.j2
  --skip-service-check  [Optional] By default, required telemetry services are checked and enabled on target
  --check-status        [Optional] Wait for probe to become operational. Default: False
  --service-interval    When skip-service-check is False and service is not alreadypresent, this indicates
  --process             Probe template variable
  --os_family           Probe template variable
The only option for os_family is eos for Arista
EOS. The (2) options for process are
edac-poller and fastcapi or
configagent.
apstra-cli> probe create --blueprint 67cd936d-c2de-49f8-8708-df465f0cdc68 --file /usr/local/lib/python2.7/site-packages/aos_cli/resources/probes/memory_usage_threshold_anomalies.j2 --os_family eos --process fastcapi
Ensuring needed telemetry services for probe are enabled...
Enabled service resource_usage on device l2-virtual-002-leaf1:172.20.60.11
Enabled service resource_usage on device l2-virtual-001-leaf1:172.20.60.9
Enabled service resource_usage on device spine2:172.20.60.8
Enabled service resource_usage on device spine1:172.20.60.6
Enabled service resource_usage on device l2-virtual-003-leaf1:172.20.60.10
Enabled service resource_usage on device l2-virtual-004-leaf1:172.20.60.7
Successfully created probe 6a258d83-1053-42ad-935c-0550cc500b7d in blueprint 67cd936d-c2de-49f8-8708-df465f0cdc68
apstra-cli>
apstra-cli> probe create --blueprint rack-based-blueprint-10990707 --file /usr/local/lib/python2.7/site-packages/aos_cli/resources/probes/memory_usage_threshold_anomalies.j2 --os_family eos --process configagent
Ensuring needed telemetry services for probe are enabled...
Successfully created probe ed2c6be1-b4b1-4e1b-bd07-da431e89eeec in blueprint rack-based-blueprint-10990707
apstra-cli>
"FastCapi" as service process is valid only for EOS version 4.18. For the
newer version of EOS, for example 4.20 and later only ConfigAgent is valid.
Take extra care that service name is in lowercase during probe creation. So
it should be configagent instead of
ConfigAgent.
To install the IBA probe for a second process, repeat the probe
create command for the other process.
You can edit the IBA probe name to include the process name.
To install the system_memory_usage_threshold_anomalies.j2 IBA
probe:
apstra-cli> probe create --blueprint 67cd936d-c2de-49f8-8708-df465f0cdc68 --file /usr/local/lib/python2.7/site-packages/aos_cli/resources/probes/system_memory_usage_threshold_anomalies.j2
Ensuring needed telemetry services for probe are enabled...
Successfully created probe a669ccf8-cba7-414b-ad46-a7d4b4ca3928 in blueprint 67cd936d-c2de-49f8-8708-df465f0cdc68
apstra-cli>
Fault Tolerance
These (2) probes require apstra-cli build 430 or later.
| Filename | Description |
|---|---|
| spine_fault_tolerance.j2 | Find out if failure of given number of spines in the fabric is going to be tolerated. Raise anomaly if total traffic on all spines is more than the available spine capacity, with the specified number of spine failures. |
| lag_link_fault_tolerance.j2 | Find out if failure of one link in a server LAG is going to be tolerated. Monitors total traffic in each LAG against total available capacity of the bond, with one link failure. Raise anomaly for racks with more than 50% of such overused bonds, sustained for certain duration. |
To install the spine_fault_tolerance.j2 IBA Probe:
apstra-cli> probe create --blueprint bf7a322c-ee3a-4dcf-aa20-df0560f538da --file /usr/local/lib/python2.7/site-packages/aos_cli/resources/probes/spine_fault_tolerance.j2 --number_of_faulty_spines_to_be_tolerated 1
Successfully created probe 0f0e9bf7-d9b3-43d7-906e-a9f0675e68f2 in blueprint bf7a322c-ee3a-4dcf-aa20-df0560f538da
apstra-cli>
number_of_faulty_spines_to_be_tolerated must be
specified.
To install the lag_link_fault_tolerance.j2 IBA Probe:
apstra-cli> probe create --blueprint bf7a322c-ee3a-4dcf-aa20-df0560f538da --file /usr/local/lib/python2.7/site-packages/aos_cli/resources/probes/lag_link_fault_tolerance.j2
Successfully created probe 45ce5fe8-555f-41a9-b0ae-267125669d3f in blueprint bf7a322c-ee3a-4dcf-aa20-df0560f538da
apstra-cli>

