Troubleshooting the MX240 Components
Troubleshooting Resources for MX240 Routers
- Command-Line Interface
- Chassis and Interface Alarm Messages
- Alarm Relay Contacts
- Craft Interface LEDs
- Component LEDs
- Juniper Networks Technical Assistance Center
Command-Line Interface
The Junos OS command-line interface (CLI) is the primary tool
for controlling and troubleshooting router hardware, Junos OS, routing
protocols, and network connectivity. CLI commands display information
from routing tables, information specific to routing protocols, and
information about network connectivity derived from the ping and traceroute utilities.
You enter CLI commands on one or more external management devices connected to ports on the Routing Engine.
For information about using the CLI to troubleshoot Junos OS, see the appropriate Junos OS configuration guide.
Chassis and Interface Alarm Messages
When the Routing Engine detects an alarm condition, it lights
the red or yellow alarm LED on the craft interface as appropriate.
To view a more detailed description of the alarm cause, issue the show chassis alarms command:
user@host> show chassis alarms
There are two classes of alarm messages:
Chassis alarms—Indicate a problem with a chassis component such as the cooling system or power supplies.
Interface alarms—Indicate a problem with a specific network interface.
Alarm Relay Contacts
The craft interface has two alarm relay contacts for connecting the router to external alarm devices. Whenever a system condition triggers either the red or yellow alarm on the craft interface, the alarm relay contacts are also activated. The alarm relay contacts are located on the upper right of the craft interface.
Craft Interface LEDs
The craft interface is the panel on the front of the router located above the DPC cards that contains LEDs and buttons that allow you to troubleshoot the router.
LEDs on the craft interface include the following:
Alarm LEDs—One large red circular LED and one large yellow triangular LED, located on the upper right of the craft interface, indicate two levels of alarm conditions. The circular red LED lights to indicate a critical condition that can result in a system shutdown. The triangular yellow LED lights to indicate a less severe condition that requires monitoring or maintenance. Both LEDs can be lit simultaneously. A condition that causes an alarm LED to light also activates the corresponding alarm relay contact on the craft interface.
Host subsystem LEDs—Three LEDs, MASTER, ONLINE, and OFFLINE, indicate the status of the host subsystem. A green MASTER LED indicates that the host is functioning as the primary. The ONLINE LED indicates that the host is online. The OFFLINE LED indicates that the host is installed but the routing engine is offline. The host subsystem LEDs are located on the left of the craft interface and are labeled RE0 and RE1.
Power supply LEDs—Two LEDs (PEM) indicate the status of each power supply. Green indicates that the power supply is functioning normally. Red indicates that the power supply is not functioning normally. The power supply LEDs are located in the center craft interface, and are labeled 0 through 3.
DPC LEDs—Two LEDs, OK and FAIL, indicate the status of each DPC. Green indicates OK and red indicates a failure. The DPC LEDs are located along the bottom of the craft interface.
FPC LEDs—Two LEDs, OK and FAIL, indicate the status of an FPC. Green indicates OK and red indicates a failure. The FPC LEDs are located along the bottom of the craft interface.
SCB LEDs—Two LEDs, OK and FAIL, indicate the status of each SCB. Green indicates OK and red indicates a failure. The SCB LEDs are located on the left of the craft interface along the bottom.
Fan LEDs—Two LEDs indicate the status of the fans. Green indicates the fans are functioning normally and red indicates a fan has failed. The fan LEDs are located on the upper left of the craft interface.
Component LEDs
The following LEDs are located on various router components and display the status of those components:
DPC LED—One LED labeled OK/FAIL on each DPC faceplate indicates the DPC's status. For more information, see the MX Series Interface Module Reference.
FPC LED—One LED labeled OK/FAIL on each FPC faceplate indicates the FPC's status.
PIC LED—One LED labeled OK/FAIL on each PIC faceplate indicates the PIC’s status. For more information, see the MX Series Interface Module Reference.
SCB LEDs—Three LEDs, labeled FABRIC ACTIVE, FABRIC ONLY, and OK/FAIL, on each SCB faceplate indicate the status of the SCB. If no LEDs are lit, the master RE might still be booting or the SCB is not receiving power.
Routing Engine LEDs—Four LEDs, labeled MASTER, HDD, ONLINE, and FAIL on each Routing Engine faceplate indicate the status of the Routing Engine and hard disk drive.
Power supply LEDs—Two LEDs on each power supply faceplate indicate the status of that power supply.
Juniper Networks Technical Assistance Center
If you need assistance during troubleshooting, you can contact the Juniper Networks Technical Assistance Center (JTAC) by using the Web or by telephone. For more information see Contact Customer Support.
See Also
Troubleshooting the MX240 Cooling System
Problem
Description
The fans in the fan tray are not functioning normally.
Solution
Follow these guidelines to troubleshoot the fans:
Check the fan LEDs and alarm LEDs on the craft interface.
If the red alarm LED on the craft interface lights, use the CLI to get information about the source of an alarm condition: user@host> show chassis alarms.
If the CLI output lists only one fan failure, and the other fans are functioning normally, the fan is most likely faulty and you must replace the fan tray.
Place your hand near the exhaust vents at the side of the chassis to determine whether the fans are pushing air out of the chassis.
If a fan tray is removed, a yellow alarm and a red alarm occur.
The following conditions automatically cause the fans to run at full speed and also trigger the indicated alarm:
A fan fails (red alarm).
The router temperature exceeds the “temperature warm” threshold (yellow alarm).
The temperature of the router exceeds the maximum (“temperature hot”) threshold (red alarm and automatic shutdown of the power supplies).
See Also
Troubleshooting the MX240 DPCs
Problem
Description
The DPCs are not functioning normally.
Solution
Monitor the green LED labeled OK above the DPC on the craft interface as soon as a DPC is seated in an operating router.
The Routing Engine downloads the DPC software to it under two conditions: the DPC is present when the Routing Engine boots Junos OS, and the DPC is installed and requested online through the CLI or push button on the front panel. The DPC then runs diagnostics, during which the OK LED blinks. When the DPC is online and functioning normally, the OK LED lights green steadily.
Make sure the DPC is properly seated in the midplane. Check that each ejector handle has been turned clockwise and is tight.
Check the OK/FAIL LED on the DPC and OK and FAIL DPC LEDs on the craft interface. When the DPC is online and functioning normally, the OK LED lights green steadily.
Issue the show chassis fpc command to check the status of installed DPCs. As shown in the sample output, the value Online in the column labeled State indicates that the DPC is functioning normally:
user@host> show chassis fpc Temp CPU Utilization (%) Memory Utilization (%) Slot State (C) Total Interrupt DRAM (MB) Heap Buffer 0 Online 41 9 0 1024 15 57 1 Online 43 5 0 1024 16 57 2 Online 43 11 0 1024 16 57 3 Empty 4 Empty 5 Online 42 6 0 1024 16 57Note:The show chassis fpc command displays the status of the DPCs.
For more detailed output, add the detail option. The following example does not specify a slot number, which is optional:
user@host> show chassis fpc detail
Slot 2 information:
  State                               Online
  Temperature                      22 degrees C / 71 degrees F
  Total CPU DRAM                 1024 MB
  Total SRAM                      256 MB
  Total SDRAM                       0 MB
  Start time                          2006-11-03 07:35:40 PST
  Uptime                              2 hours, 27 minutes, 1 second
Slot 4 information:
  State                               Online
  Temperature                      22 degrees C / 71 degrees F
  Total CPU DRAM                 1024 MB
  Total SRAM                      256 MB
  Total SDRAM                       0 MB
  Start time                          2006-11-03 07:35:48 PST
  Uptime                              2 hours, 26 minutes, 53 seconds
Slot 7 information:
  State                               Online
  Temperature                      24 degrees C / 75 degrees F
  Total CPU DRAM                 1024 MB
  Total SRAM                      256 MB
  Total SDRAM                       0 MB
  Start time                          2006-11-03 07:35:53 PST
  Uptime                              2 hours, 26 minutes, 48 seconds
For further description of the output from the commands, see the Junos OS Administration Library for Routing Devices.
See Also
Troubleshooting the MX240 FPCs
Problem
Description
The FPCs are not functioning normally.
Solution
Monitor the green LED labeled OK above the FPC on the craft interface as soon as an FPC is seated in an operating router.
The Routing Engine downloads the FPC software to it under two conditions: the FPC is present when the Routing Engine boots Junos OS, and the FPC is installed and requested online through the CLI or push button on the front panel. The FPC then runs diagnostics, during which the OK LED blinks. When the FPC is online and functioning normally, the OK LED lights green steadily.
Make sure the FPC is properly seated in the midplane. Check that each ejector handle has been turned clockwise and is tight.
Check the OK/FAIL LED on the FPC and OK and FAIL FPC LEDs on the craft interface. When the FPC is online and functioning normally, the OK LED lights green steadily.
Issue the show chassis fpc command to check the status of installed FPCs. As shown in the sample output, the value Online in the column labeled State indicates that the FPC is functioning normally:
user@host> show chassis fpc Temp CPU Utilization (%) Memory Utilization (%) Slot State (C) Total Interrupt DRAM (MB) Heap Buffer 0 Online 24 3 0 1024 13 21 1 Empty 2 Online 41 9 0 1024 15 57 3 Online 43 5 0 1024 16 57 4 Online 43 11 0 1024 16 57 5 Online 41 9 0 1024 15 57 6 Online 43 5 0 1024 16 57 7 Empty 8 Empty 9 Empty 10 Online 24 3 0 1024 13 21 11 EmptyNote:The show chassis fpc command displays the status of the FPCs.
For more detailed output, add the detail option. The following example does not specify a slot number, which is optional:
user@host> show chassis fpc detail
Slot 0 information:
  State                                 Online
  Temperature                        24 degrees C / 75 degrees F
  Total CPU DRAM                   1024 MB
  Total RLDRAM                      128 MB
  Total DDR DRAM                   2048 MB
  Start time:                           2008-12-11 16:53:24 PST
  Uptime:                               15 hours, 2 minutes, 47 seconds
Slot 2 information:
  State                                 Online
  Temperature                        29 degrees C / 84 degrees F
  Total CPU DRAM                   1024 MB
  Total RLDRAM                      256 MB
  Total DDR DRAM                   4096 MB
  Start time:                           2008-12-11 16:53:18 PST
  Uptime:                               15 hours, 2 minutes, 53 seconds
Slot 3 information:
  State                                 Online
  Temperature                        29 degrees C / 84 degrees F
  Total CPU DRAM                   1024 MB
  Total RLDRAM                      256 MB
  Total DDR DRAM                   4096 MB
  Start time:                           2008-12-11 16:53:18 PST
  Uptime:                               15 hours, 2 minutes, 53 seconds
Slot 4 information:
  State                                 Online
  Temperature                        29 degrees C / 84 degrees F
  Total CPU DRAM                   1024 MB
  Total RLDRAM                      256 MB
  Total DDR DRAM                   4096 MB
  Start time:                           2008-12-11 16:53:18 PST
  Uptime:                               15 hours, 2 minutes, 53 seconds
Slot 5 information:
  State                                 Online
  Temperature                        29 degrees C / 84 degrees F
  Total CPU DRAM                   1024 MB
  Total RLDRAM                      256 MB
  Total DDR DRAM                   4096 MB
  Start time:                           2008-12-11 16:53:22 PST
  Uptime:                               15 hours, 2 minutes, 49 seconds
Slot 6 information:
  State                                 Online
  Temperature                        29 degrees C / 84 degrees F
  Total CPU DRAM                   1024 MB
  Total RLDRAM                      256 MB
  Total DDR DRAM                   4096 MB
  Start time:                           2008-12-11 16:53:18 PST
  Uptime:                               15 hours, 2 minutes, 53 seconds
Slot 10 information:
  State                                 Online
  Temperature                        24 degrees C / 75 degrees F
  Total CPU DRAM                   1024 MB
  Total RLDRAM                      128 MB
  Total DDR DRAM                   2048 MB
  Start time:                           2008-12-11 16:53:24 PST
  Uptime:                               15 hours, 2 minutes, 47 seconds
For further description of the output from the commands, see the Junos OS Administration Library for Routing Devices.
See Also
Troubleshooting the MX240 MICs
Problem
Description
The MICs are not functioning normally.
Solution
Check the status of each port on a MIC by looking at the LED located on the MIC faceplate. For information about the meaning of LED states on different MICs, see the MX Series Interface Module Reference.
Check the status of a MIC by issuing the
show chassis
fpc pic-status
CLI command. The MIC slots in the MPC are labeled PIC 0/1 and PIC 2/3, left to right:user@host> show chassis fpc pic-status Slot 0 Online MPC Type 2 3D EQ PIC 0 Online 1x 10GE XFP PIC 1 Online 1x 10GE XFP Slot 1 Online MPC 3D 16x 10GE PIC 0 Online 4x 10GE(LAN) SFP+ PIC 1 Online 4x 10GE(LAN) SFP+ PIC 2 Online 4x 10GE(LAN) SFP+ PIC 3 Online 4x 10GE(LAN) SFP+ Slot 2 Online MS-DPC PIC 0 Online MS-DPC PIC PIC 1 Online MS-DPC PIC
For further description of the output from the command, see the CLI Explorer.
See Also
Troubleshooting the MX240 MPCs
Problem
Description
The MPCs are not functioning normally.
Solution
Monitor the green LED labeled OK above the MPC on the craft interface as soon as an MPC is seated in an operating router.
The Routing Engine downloads the MPC software to it under two conditions: The MPC is present when the Routing Engine boots Junos OS, and the MPC is installed and requested online through the CLI or push button on the front panel. The MPC then runs diagnostics, during which the OK LED blinks. When the MPC is online and functioning normally, the OK LED lights green steadily.
Make sure the MPC is properly seated in the midplane. Check that each ejector handle has been turned clockwise and is tight.
Check the OK/FAIL LED on the MPC and OK and FAIL line card LEDs on the craft interface. When the MPC is online and functioning normally, the OK LED lights green steadily.
Issue the
show chassis fpccommand to check the status of installed MPCs. As shown in the sample output, the valueStatein the column labeledStateindicates that the MPC is functioning normally:user@host> show chassis fpc Temp CPU Utilization (%) Memory Utilization (%) Slot State (C) Total Interrupt DRAM (MB) Heap Buffer 0 Online 36 3 0 2048 14 13 1 Online 40 5 0 2048 26 13 2 EmptyNote:The
show chassis fpccommand displays the status of the MPCs.For more detailed output, add the
detailoption. The following example does not specify a slot number, which is optional:user@host> show chassis fpc detail Slot 0 information: State Online Temperature 36 degrees C / 96 degrees F Total CPU DRAM 2048 MB Total RLDRAM 806 MB Total DDR DRAM 2632 MB Start time: 2009-12-22 12:27:04 PST Uptime: 6 days, 3 hours, 8 minutes, 41 seconds Max Power Consumption 450 Watts Slot 1 information: State Online Temperature 40 degrees C / 104 degrees F Total CPU DRAM 2048 MB Total RLDRAM 1324 MB Total DDR DRAM 5120 MB Start time: 2009-12-22 12:27:02 PST Uptime: 6 days, 3 hours, 8 minutes, 43 seconds Max Power Consumption 440 Watts
For further description of the output from the commands, see the Junos OS System Configuration Guide.
See Also
Troubleshooting the MX240 PICs
Problem
Description
The PICs are not functioning normally.
Solution
Check the status of each port on a PIC by looking at the LED located on the PIC faceplate. For information about the meaning of LED states on different PICs, see the MX Series Interface Module Reference.
Check the status of a PIC by issuing the
show chassis
fpc pic-status
CLI command. The PIC slots in the FPC are numbered from 0 through 1, left to right:user@host> show chassis fpc pic-status Slot 0 Online DPC 40x 1GE R PIC 0 Online 10x 1GE(LAN) PIC 1 Online 10x 1GE(LAN) PIC 2 Online 10x 1GE(LAN) PIC 3 Online 10x 1GE(LAN) Slot 1 Online MX FPC Type 3 PIC 0 Online 1x OC-192 SONET PIC 1 Online 1x OC-192 SONETFor further description of the output from the command, see the CLI Explorer.
See Also
Troubleshooting the MX240 Power System
Problem
Description
The power system is not functioning normally.
Solution
Check the LEDs on each power supply faceplate.
If an AC power supply is correctly installed and functioning normally, the AC OK and DC OK LED’s light steadily, and the PS FAIL LED is not lit.
If a DC power supply is correctly installed and functioning normally, the PWR_OK, INPUT OK, and BRKR ON LED’s light steadily.
Issue the CLI show chassis environment pem command to check the status of installed power supply modules. As shown in the sample output, the value Online in the rows labeled State indicates that each power supply is functioning normally:
user@host> show chassis environment pem
PEM 0 status:
  State                           Online
  Temperature                     OK
  DC output                       OK
PEM 2 status:
  State                           Online
  Temperature                     OK
  DC output                       OK
If a power supply is not functioning normally, perform the following steps to diagnose and correct the problem:
If a red alarm condition occurs, issue the show chassis alarms command to determine the source of the problem.
Check that the AC input switch (—) or DC circuit breaker (|) is in the on position and that the power supply is receiving power.
Verify that the source circuit breaker has the proper current rating. Each power supply must be connected to a separate source circuit breaker.
Verify that the AC power cord or DC power cables from the power source to the router are not damaged. If the insulation is cracked or broken, immediately replace the cord or cable.
Connect the power supply to a different power source with a new power cord or power cables. If the power supply status LEDs indicate that the power supply is not operating normally, the power supply is the source of the problem. Replace the power supply with a spare.
If all power supplies have failed, the system temperature might have exceeded the threshold, causing the system to shut down.
Note:If the system temperature exceeds the threshold, the Junos OS shuts down all power supplies so that no status is displayed.
The Junos OS also can shut down one of the power supplies for other reasons. In this case, the remaining power supplies provide power to the router, and you can still view the system status through the CLI or display.
To restart a high-capacity AC power supply after a shut down due to an over-temperature situation:
Move the power switch on the power supply to the off (o) position.
Turn off power to where the AC line goes into the power distribution module (PDM) area.
Wait for the power supply LEDs to fade out and for the fans inside the power supply to shutdown. This can take up to 10 seconds.
CAUTION:Do not attempt to power-on the power supply if the LED is still lit and the fan is still running. If you do, the router will not reboot.
Turn on power to where the AC line goes into the power distribution module (PDM) area.
Move the power switch on the power supply to the on (|) position.
Verify that the LEDs on the power supply faceplate are properly lit.
Issue the CLI show chassis environment pem command and verify the State is
ONLINEand the Temperature isOK.
To restart a high-capacity DC power supply after a shut down due to an over-temperature situation:
Switch off the circuit breaker(s) on the DC distribution panel to remove power to the chassis and power supplies.
Switch on the circuit breaker(s) on the distribution panel to power up the chassis and power supplies.
Note:The power switch on the power supplies is not part of the outer or inner DC circuits and therefore does not need to be switched off when restarting the chassis.
If output power is not load-balancing correctly in the same zone on an MX router with a high-capacity AC or DC power supply module, connect two feeds and change the DIP switch to 1 to boost the voltage on the power supply module.
Each High Capacity AC or DC power supply accepts two AC or DC feeds in two unique AC or DC receptacles. It is possible to operate with one feed, but there is a reduction in the power supply output. The DIP switch must be set according to the number of AC or DC feeds that are present for the power supply. Refer to Figure 1
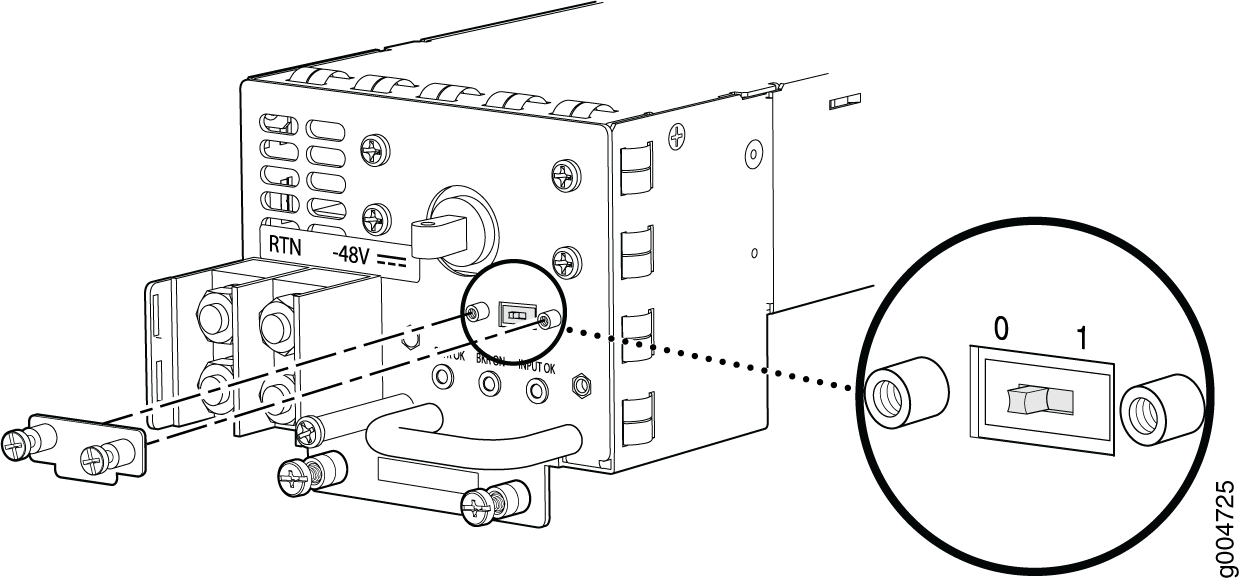
Position – 0 indicates that only one AC or DC feed is provided.
Position – 1 indicates that two AC or DC feeds are provided.
To check the DIP switch position:
Issue the
show chassis powercommand and check to see how many feeds are connected. The following example shows there are two AC input feeds connected for PEM 0 and one AC input feed connected for PEM 1. This indicates that the DIP switch for PEM 0 is in position 1 and the DIP switch for PEM 1 is in position 0. These are the proper settings.# run show chassis power PEM 0: State: Online AC input: OK (2 feed expected, 2 feed connected) Capacity: 4100 W (maximum 4100 W) DC output: 855 W (zone 0, 15 A at 57 V, 20% of capacity) PEM 1: State: Online AC input: OK (1 feed expected, 1 feed connected) Capacity: 1700 W (maximum 4100 W) DC output: 969 W (zone 1, 17 A at 57 V, 57% of capacity)
Issue the
show chassis alarmscommand to see if there are any active alarms on the DIP switch:> show chassis alarms 4 alarms currently active Alarm time Class Description 2013-01-11 14:48:26 UTC Minor PEM 0 Dipswitch 0 Feed Connection 2
If the
show chassis alarmsoutput shows an alarm onDipswitch, issue theshow chassis powercommand to check the DIP switch position.# run show chassis power PEM 0: State: Online AC input: OK (1 feed expected, 2 feed connected) Capacity: 4100 W (maximum 4100 W) DC output: 855 W (zone 0, 15 A at 57 V, 20% of capacity)
In this example, the DIP switch is in the wrong position since there is one AC feed expected but two AC feeds are connected. Change the DIP switch to position 1. This should clear the alarm.
Note:Changing the DIP switch position does not impact traffic. However, it is always recommended to do so in a maintenance window.