REST API에 GET 요청 제출
명령의 rpc 경우 끝점의 일반적인 형식은 다음과 같습니다.
scheme://device-name:port/rpc/method[@attributes]/params
-
scheme:http또는https -
method: Junos OSrpc명령의 이름입니다.method이름은 태그 요소와 동일합니다. 자세한 내용은 Junos XML API Explorer를 참조하십시오. -
params: 선택적 매개 변수 값(name[=value])입니다.
요청을 인증하려면 다음 방법 중 하나를 사용할 수 있습니다. 더 안전하므로 옵션을 사용하는 netrc 것이 좋습니다.
-
Authorization 헤더에 포함된 base64로 인코딩된 사용자 이름과 암호를 제출합니다.
curl -u "username:password" http://device-name:port/rpc/get-interface-information -
또는 .netrc 파일을 사용하여 자격 증명을 저장합니다.
사용자의 홈 디렉토리에서 .netrc 파일을 작성하고 원격 디바이스의 호스트 이름, 사용자 이름 및 비밀번호를 지정하십시오. 예를 들어:
user@host:~$ cat ~/.netrc
machine 172.16.2.1
login username
password password
사용자에게만 파일에 대한 읽기 및 쓰기 권한이 있는지 확인합니다.
user@host:~$ chmod 600 .netrc
요청에서 옵션을 지정합니다
--netrc. 예를 들어:user@host:~$ curl --netrc http://172.16.2.1:3000/rpc/get-interface-information
GET 요청에 대한 URI에서 데이터를 쿼리 문자열로 지정하려면 rpc 여러 인수를 구분하는 구분 기호와 & 함께 다음 URI를 사용하거나 ? 다음과 같은 동등한 cURL 호출에 표시된 대로 구분 기호를 / 사용할 수 있습니다.
예를 들어:
curl --netrc http://device-name:port/rpc/get-interface-information?interface-name=cbp0&snmp-index=1curl --netrc http://device-name:port/rpc/get-interface-information/interface-name=cbp0/snmp-index=1
HTTP Accept 헤더는 다음 Content-Type 값 중 하나를 사용하여 반환 형식을 지정하는 데 사용할 수 있습니다.
-
application/xml(기본값)
-
애플리케이션/json
-
text/plain
-
텍스트/html
예를 들어 다음 cURL 호출은 JSON의 출력 형식을 지정합니다.
curl --netrc http://device-name:port/rpc/get-interface-information?interface-name=cbp0 --header "Accept: application/json"
Junos OS RPC의 선택적 format 매개 변수를 사용하여 출력 형식을 지정할 수도 있습니다.
예를 들어, <get-software-information> tag 요소는 소프트웨어 프로세스 개정 수준을 검색합니다. 다음 HTTPS GET 요청은 이 명령을 실행하고 결과를 JSON 형식으로 검색합니다.
https://device-name:port/rpc/get-software-information@format=json
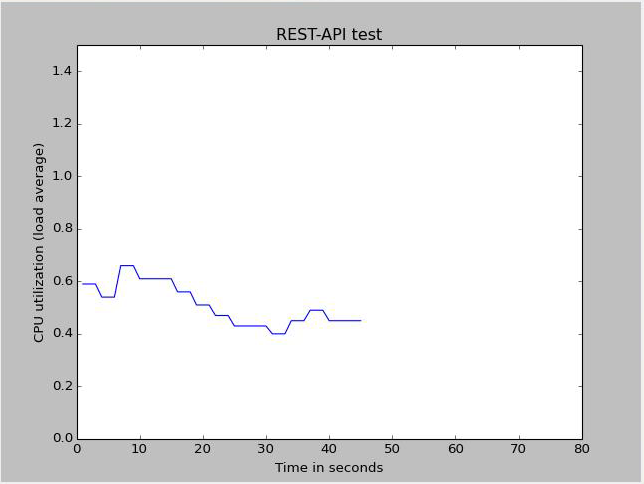
다음 Python 프로그램은 REST 인터페이스를 사용하여 RPC를 get-route-engine-information 실행하고, 응답에서 데이터를 추출하고, CPU 부하 평균 그래프를 그립니다. 모듈은 requests 사용자의 .netrc 파일에서 지정된 디바이스와 연결된 자격 증명을 자동으로 확인합니다. 또는 요청에 인수를 auth=(username, password ) 포함하여 자격 증명을 제공할 수 있습니다.
import numpy as np
import matplotlib.pyplot as plt
import matplotlib.animation as animation
import requests

def update_line(num, data, line):
    if num == 0:
	    return line,
    global temp_y
    x_data.append(num)
    if num != 0 and num%8 == 1:
        r = requests.get('http://' + device + '/rpc/get-route-engine-information@format=json')
        if r: temp_y = r.json()['route-engine-information'][0]['route-engine'][0]['load-average-one'][0]['data']
    y_data.append(float(temp_y))
    line.set_data(x_data, y_data)
    return line,

device = input('Enter device:port ')

temp_y = 1
fig1 = plt.figure()
x_data = []
y_data = []
l, = plt.plot([], [])
plt.xlim(0, 80)
plt.ylim(0, 1.5)
plt.xlabel('Time in seconds')
plt.ylabel('CPU utilization (load average)')
plt.title('REST-API test')
line_ani = animation.FuncAnimation(fig1, update_line, 80, fargs=(0, l), interval=1000, blit=True)
plt.show()