このページの内容
WAN SLE
WANサービスレベルエクスペリエンス(SLE)を使用して、WANエッジの健全性、WANリンクの健全性、アプリケーションの健全性など、ユーザーに影響を及ぼす要因を評価します。
概要
WAN SLEダッシュボードの検索
WAN SLEダッシュボードを見つけるには、左側のメニューから監視>サービスレベルを選択し、WANボタンをクリックします。
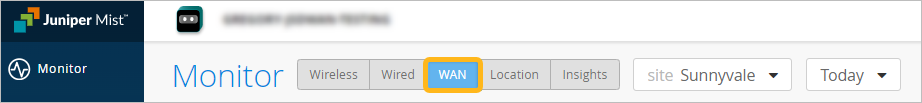
ボタンは、必要なサブスクリプションがある場合にのみ表示されます。要件 を参照してください。
SLEフィルターボタン
-
左側のボタンを使用して、 成功率 または 値を表示します。
[ カスタム アプリの表示] ボタンを使用して、カスタム アプリケーションを表示または非表示にします。
以下の例では、ボタンがオフの位置にあるため、すべてのアプリケーションが含まれています。ボタンを [オン ] の位置にドラッグすると、カスタム アプリケーションのみが表示されます。

ビデオ:WAN Assuranceの概要
Juniper MIST WAN Assurance delivers insights and troubleshooting driven by MIST AI into the WAN, exposing many factors that impact user experience across your distributed enterprise. WAN Assurance complements your SD-WAN deployment and is focused on delivering the best user experience, from client to the cloud. SD-WAN solutions dynamically optimize traffic flows across the WAN based on an SLA policy for your applications.
However, these SLAs are set once at the beginning and don't account for changes over time that impact the WAN, rendering these static SLAs ineffective. In contrast, WAN Assurance is centered around the concept of the user minute, which is represented by Service Level Expectations, or SLE for short. If a user is experiencing a poor Microsoft Teams call, then the user is having bad user minutes.
Let's see what this looks like in a Juniper Cloud instance. From the monitor view, we select WAN, choosing from the time frame over the last seven days, and we see three SLEs for the WAN. The first one is Gateway Health, which accounts for the overall state of the SRX WAN edge device itself.
We track CPU, memory, temperature, fan, and power, all of which account for the overall device health. WAN Link Health represents the overall state of the WAN connections to the device. It tracks IPsec status, routing, and the WAN interfaces.
Thirdly, there's App Experience, which accounts for factors that impact application performance based on traffic. This SLE tracks latency, jitter, packet loss, and round-trip time. Together, these three SLEs describe how WAN performance is impacting overall user experience.
Let's ask Marvis what's happening with Microsoft Teams. By simply typing, obvious Teams call is bad, Marvis begins a root cause analysis. Marvis first responds by listing five Teams sessions from the past 24 hours.
We select the troublesome session from the list. Marvis quickly responds that the bad Teams experience was due to high latency on the Gateway SRX. Marvis also shows where the issue is in a simplified network diagram.
It displays how Abhi's MacBook is connected wirelessly to an access point, which in turn is connected to an EX access switch, and finally, the traffic is sent to the WAN via the SRX gateway. Marvis visually shows how each of these points in the network are impacting user experience. We see the AP and the gateway devices may be impacting experience.
We click the AP first. There is some non-WiFi interference in the 5GIG band that could be impacting users. Next, we select the gateway device.
We see it has high latency in one of its WAN links due to slow response from the application server. Marvis makes it that easy to determine root cause analysis of issues impacting user experience. By correlating across Wi-Fi, wired, and WAN, we are able to drive a better user experience within our sites, out of our sites, from client to cloud.
ビデオ:SLEによるWANの問題のトラブルシューティング
Looking at our recently deployed Cupertino site, we can see that it is not meeting Service Levels. Clicking into the site, we get a closer look at the SLEs. They are broken down into three important health categories that play a role in user experience: the WAN Edge device health, the health of WAN links and paths, and the health of applications themselves. Each SLE is broken down into a simple unit of measure for the user experience called a User Minute.
Simply put, this is telling us what our user experiences on the WAN are per user, per minute. Behind these seemingly simple measurements are the complex and powerful AI models of the Mist Cloud, fed by rich telemetry from the Session Smart Network. For each SLE, we get a breakdown of the root cause of the issues identified. Whenever user experience is poor on the WAN, Mist not only tells us the root cause, but also tells us what was affected, such as the impacted applications, users, links, paths and devices.
WAN SLEブロック
次の例に示すように、各SLEブロックは貴重な情報を提供します。
-
左側には、この SLE の成功率が 85% であることがわかります。値フィルター ボタンを選択すると、代わりに数字が表示されます。
タイムラインの中央には、期間にわたる変動が表示されます。任意のポイントにマウスポインタを置くと、正確な時刻とSLEの結果を確認できます。
右側の分類子は、各根本原因に起因する問題の割合を示しています。この例では、問題の100%がジッターに起因しています。

-
分類子をクリックすると、根本原因分析ページに詳細情報が表示されます。ほとんどの分類子には、正確な原因をより深く理解するためのサブ分類子があります。根本原因分析ページには、問題の範囲と影響に関する追加の詳細も記載されています。
WAN SLEと分類子の詳細については、以下の表を参照してください。
| SLE | SLEの説明 | 分類子 | 分類子の説明 |
|---|---|---|---|
| WANエッジの健全性 | ジュニパー Mist は、WAN エッジ デバイスの健全性またはパフォーマンスが最適でない場合、ユーザーの時間(分)を監視します。最適でない状態だと、デバイスのトラフィック通過能力が低下し、デバイスに接続されているクライアントに直接影響します。 |
WANエッジの切断 | ジュニパー Mist クラウドへの接続が失われました |
| システム | 容量に対するシステム使用率が高い サブ分類子:
|
||
| テーブル容量 | 容量に比べてテーブルエントリー数が多い サブ分類子:
|
||
| DHCP プール | プールサイズに対する高いDHCP使用率 サブ分類子:
|
||
| WANリンクの正常性 | ジュニパー Mist は、WAN リンクの健全性が SLE しきい値を満たしているか、満たしていないときをユーザーの分単位で監視します。WANリンクの健全性が悪いと、デバイスのトラフィック通過能力が低下し、そのリンクを使用しているクライアントに直接影響します。 |
ネットワーク | ネットワークの問題 サブ分類子:
|
| インターフェース | インターフェイスの問題 サブ分類子:
|
||
| WANアプリケーションの正常性 | ジュニパー Mist は、WAN アプリケーションの遅延を監視して、最適とは言えないアプリケーションを特定します。 このSLEは、アプリケーションにアクセスする際のエンドユーザーのエクスペリエンスを理解するのに役立ちます。例えば、ネットワーク接続が弱いと、FTPまたはSMTPベースのアプリケーションでは優れたユーザーエクスペリエンスが得られても、VoIPアプリケーションのユーザーエクスペリエンスは低下する可能性があります。 パフォーマンスメトリックはデバイスによって異なります。
微調整するには、[ 設定 ]ボタンをクリックして、含めるまたは除外する個々のアプリケーションを選択できます。 |
ジッター | 一貫性のないパケット送信時間 |
| 遅延 | 遅い応答時間(遅れ) |
||
| 損失 | パケット損失 |
||
| アプリケーションサービス(SSRのみ) | アプリケーション要求への応答が遅い、切断が繰り返される、帯域幅不足といった問題 サブ分類子:
|
||
| ゲートウェイ帯域幅 | ジュニパー Mist は、SD-WAN を構成する IPsec オーバーレイを評価します。 このSLEを使用して、サイトにより多くのWAN帯域幅が必要かどうかを判断します。 |
帯域幅のヘッドルーム | 過去 14 日間の最高使用量によって決定されるベースラインを超える現在の使用量 自動速度テストを有効にしている場合、これらの結果も帯域幅ヘッドルーム分類器に組み込まれます。この場合、ヘッドルームのしきい値は、最大使用量と速度テスト結果(利用可能な場合)に基づきます。 速度テストは、組織設定で構成され、WAN Edgeテンプレート、ハブプロファイル、またはWAN EdgeデバイスのWAN設定で有効になっている場合に発生します。 |
| 混雑アップリンク(SRXのみ) | 送信された総パケット数(TXパケット)に対する総送信バイト数(TXドロップ)の比率が高い。 |